


现在每一个 Oracle DBA,很少有不知道隐含参数的。但至少在表面上,Oracle 是不支持将隐含参数用于数据库的。隐含参数通常用于救急,或者是作为 Oracle BUG 的临时解决方案(Workaround)。在使用隐含参数之前,需要确认这个隐含参数会不会对系统带来负面影响。本文就有这么一个案例,使用一个隐含参数给数据库带来了严重的性能问题。
一、案例之问题现象
客户一套核心的系统,在业务高峰期常常出现数据库响应非常缓慢的问题现象。发生故障的时间通常出现在上午11点左右和下午16至17点左右。在出现故障时,对数据库的任何操作,包括连接数据库都非常缓慢。故障通常持续几分钟至十几分钟,就自动恢复正常。
这套系统是一个省级集中系统,数据库为 Oracle 9.2.0.8。由于系统比较大,将系统分成了2套库,这里称为A库和B库。每套库分别承担全省约一半的业务量。这2套库轮流出现相同现象的性能问题。这套系统的数据库原来运行在 HP-UX 平台上,在2个月之前迁移到了新的 AIX 平台上,迁移之后保留了原来的表和索引统计信息,统计信息的收集策略包括脚本都与原来完全一样。数据库版本一致,新的主机每套库为80逻辑 CPU。
在系统出现问题时,系统的一些性能情况如下:
1. 主机的 IO 和内存使用无明显变化,在正常范围之内,主机 CPU 的利用率也不是很高(70%以下)。
2. 数据库中大量的 latch free 和 library cache pin 等待,尤其以 latch free 等待最为严重,等待的 latch 主要为 shared poollatch 和 library cachelatch。这2类等待的会话数达到 500-700 个。
3. 从 Statspack 报告来看,latch free 等待消耗了大量的时间。
下面就是对这个案例的详细分析。
二、问题分析
根据故障期间的 Statspack 的性能数据作进一步分析。
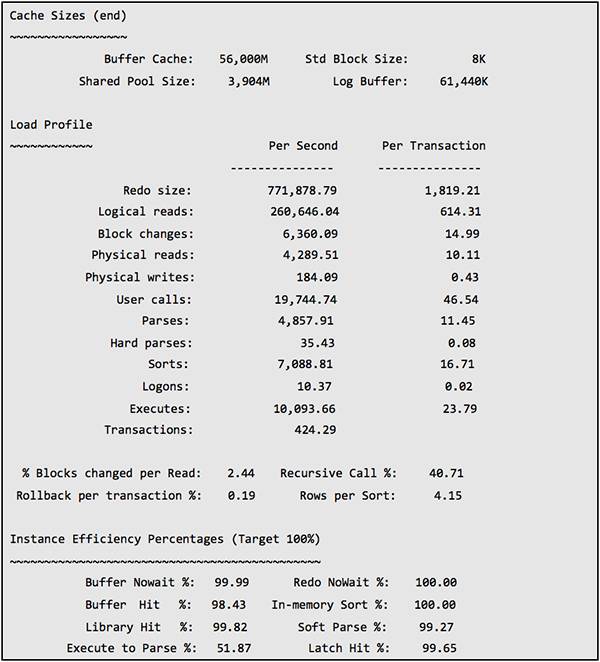
以下是B库包含了故障时间段的1小时 Statspack 中的性能数据:
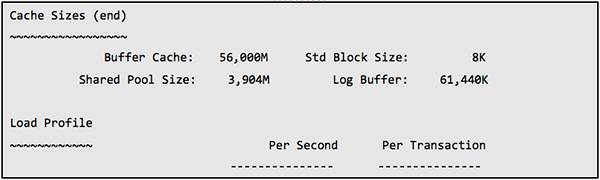
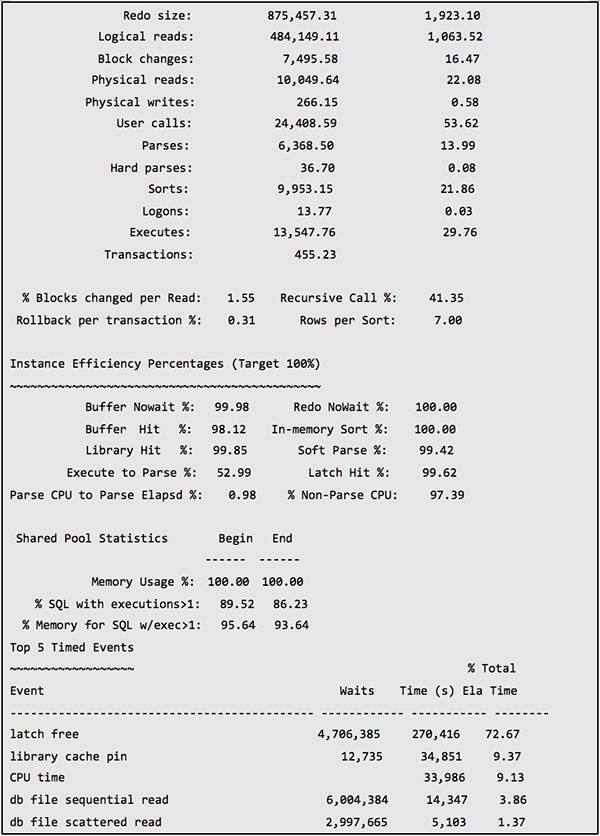
可以看到 latch free 和 library cache pin 等待非常严重。
通过 AWR 和 Statspack,我们需要自顶向下的分析方法。首先在 Top Waits 中发现瓶颈,然后在报告的后部分析更详细的数据。
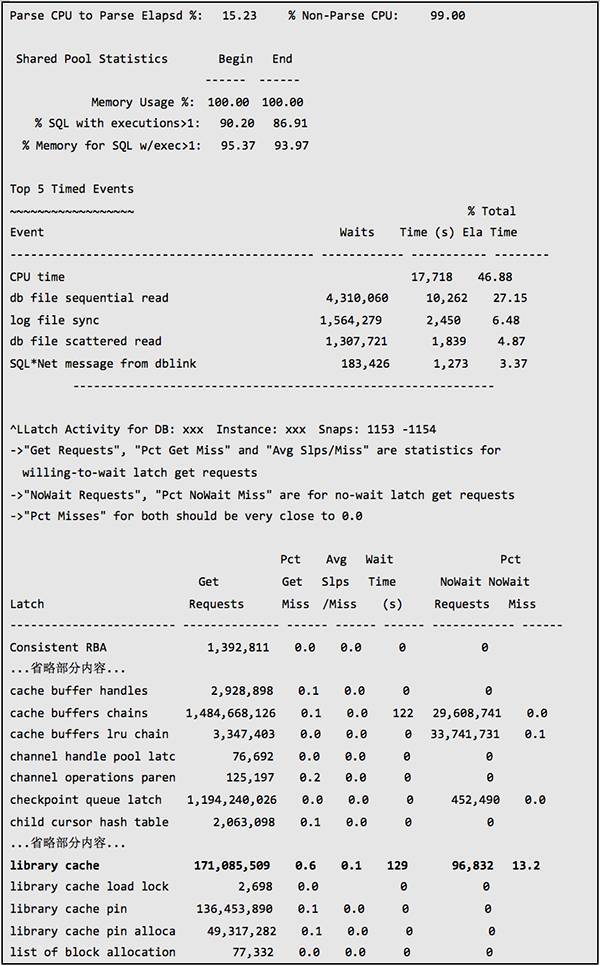
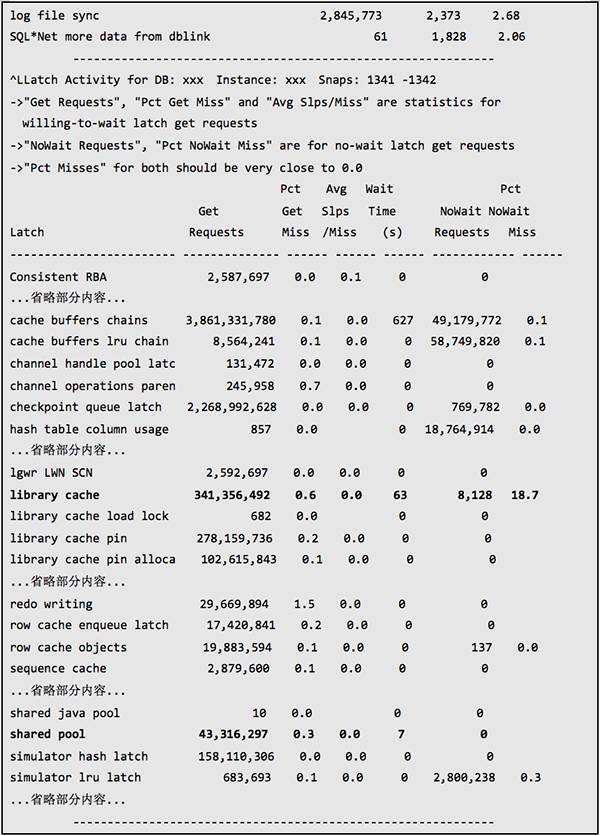
下面是关于 latch 的更详细性能数据:
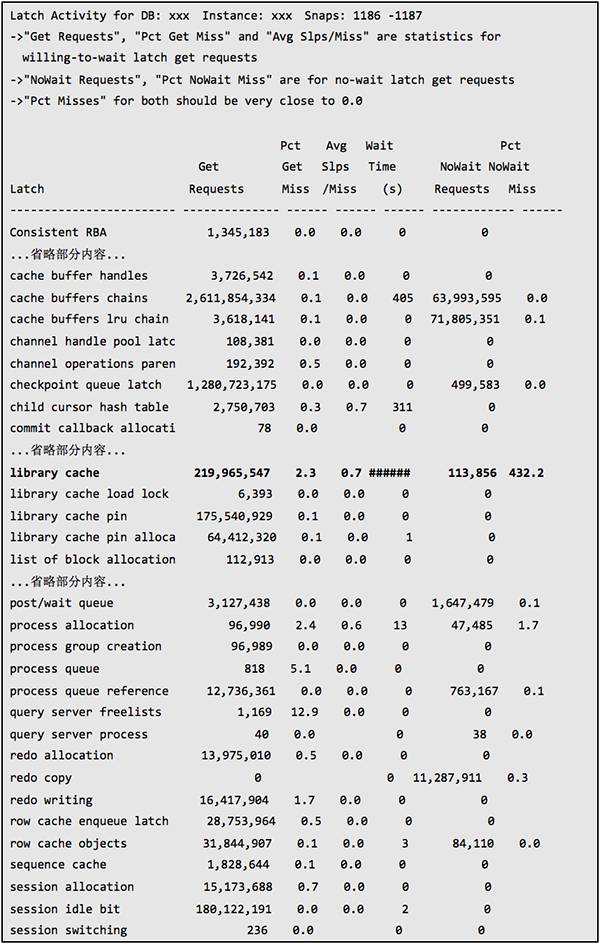
从上面的数据可以看到 shared pool latch 和 library cache latch 的 gets miss 和 wait time 都非常高,争用十分严重。而从等待时间来看,library cache latch 最长,其次是 shared pool latch,但前者的等待时间远远高于后者,从表面上看主要是 library cachelatch 争用引起的问题。
下面是B库在正常时间段的1小时性能数据:
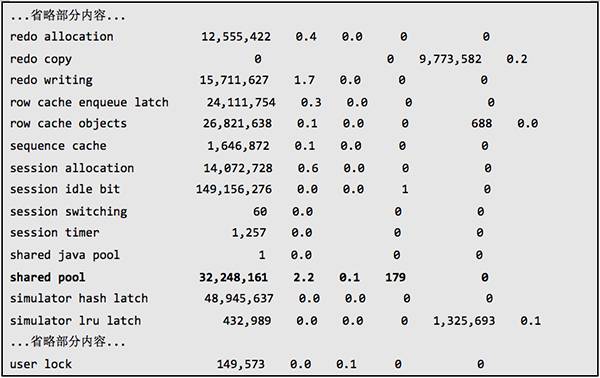
可以看到 sharedpool latch 的 gets misspercent 仍然高达 2.2%,library cache latch 的 gets miss percent 为0.6%。正常情况下,latch 的 gets misspercent 在 1% 以下。
从两个时间段的性能数据比较来看,故障时间段的负载要高于正常时间段,特别是每秒 Parse 次数增加了31%。这种现象与故障时间总是在业务高峰期是相吻合的。
在故障时间段,虽然也有大量的 librarycache pin 等待,但是由于 Oracle 在 library cache pin 操作时,进程需要获取 library cache latch 和 shared pool latch。这里 library cache pin 等待主要是由于 library cache latch 和 shared pool latch 不能获取所引起,因此 library cache pin 等待是一个衍生问题,解决了 latch free 等待问题,library cache pin 的问题也会一并解决。
那么这里重点就在于是什么原因引起了 shared pool latch 和 library cache latch 的严重争用?
再来看看B库的参数:
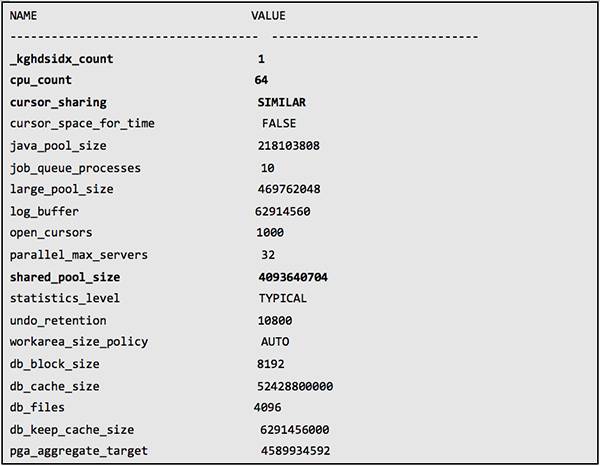
A库的参数与B库类似,唯一比较明显的区别是 CPU_COUNT 为48,而不是64。而实际上2套库的主机其 CPU 个数是相同的。
从参数来看,有几个参数对 sharedpool latch 和 library cachelatch 的争用有比较大的影响。下面是对几个参数的分析:
1. CURSOR_SHARING 参数设置为 SIMILAR,这样使得 Shared Pool 的消耗并不严重,这也是 Shared Pool 剩余内存比较多的原因。但是由于这个参数,在有直方图的情况下,会使 SQL 产生很多的子游标,这会增加 library cache latch 的争用,同时解析产生子游标时,相当于一次硬解析,Oracle 对于产生一条子游标,的确会增加 parse count(hard) 计数。同时子游标过多,会消耗更多的 Shared Pool,并引起内存碎片,这两个因素会使过多的子游标,会增加 share poollatch 的竞争。但是从 Statspack 报告来看,每秒40个左右的硬解析对这么大的系统来说并不算高,同时 Shared Pool 还有足够多的剩余。
2.
的确是有很多的 SQL 语句其子游标很多,即 VERSION_COUNT 很高的 SQL 很多。不过这里显示的子游标个数中,有相当一部分已经被刷出了内存,但是从 Statspack 里面仍然可以看到很多子游标数超过 1000 的 SQL。
3. CPU_COUNT 的值会影响 library cache latch 的数量。Oracle 会将大于 CPU_COUNT 并最接近 CPU_COUNT 的质数,作为 library cache latch 的数量,但最大值为67。A库 CPU_COUNT 为48,其 library cachelatch 个数为53,B库的 CPU_COUNT 为64,其 librarycache latch 的数量达到了最大值,即67。这2个 CPU_COUNT 应该是由原库从 HP-UX 迁移时保留下来。虽然A库的 CPU_COUNT 较小,使得 library cache latch 个数比最大值小,一定程度上会加大 library cache latch 的争用。但是B库的 library cache latch 已经达到最大值的情况下仍然出现问题,并且其出现频繁程度不比A库少,这表明问题与 CPU_COUNT 无关。
4. _KGHDSIDX_COUNT 是一个隐含参数,这个参数的作用是控制共享池 Sub Pool 的个数。使用这个参数的目的通常有两个,一是避免将共享池划分成多个(最多7个)子池之后,出现 ORA-4031 错误。二是作为 Workaround 避免一些 BUG。检查数据库日志,可以发现出现过 ORA-600[504] 错误,这个错误正是由 BUG“ORA-600 [504] DURING SHUTDOWN ORALTER SYSTEM FLUSH SHARED_POOL [ID 428226.1]”引起,BUG 号为 5508574。而将_kghdsidx_count 这个隐含参数设为1,正是一个解决此 BUG 的临时方案。那么这个参数的影响在哪里呢?由于每个 Shared Pool 子池由一个 shared pool latch 来保护,那么如果将这个参数设置为1,将会只有一个 shared pool latch,在高并发的情况下,shared pool latch 的争用将非常严重。而在 4GB 这么大的 shared pool 时,默认情况下有7个子池,那么 shared pool patch 的争用将会少得多。
对于上面提到的 BUG 5508574,检查数据库已经安装的补丁,发现对应的补丁已经安装上。
5. SHARED_POOL_SIZE,目前大小约为4GB。检查发现并没有 ORA-04031 错误,同时 SGA 中 shared pool free memory 比较多,在1G以上。这说明 shared pool 没有多大问题。如果 shared pool 空闲空间不足,则在向 shared pool 中申请分配内存时,需要寻找并刷出其他的内存块,这使得持有 sharedpool latch 的时间变长,也就加剧了 sharedpool latch 的争用。
在前面的分析中提到,这个系统的关键是需要解决 library cache latch 和 shared pool latch 的争用问题,特别是前者,其等待时间比 shared pool latch 的等待时间长得多。那么从表面上首要的是解决 library cache latch 的问题。而 library cache latch 的争用,目前最值得怀疑的是由 VERSION COUNT 过高的 SQL 引起。但是如果深入思考,就会否决这个怀疑。虽然有这么些 VERSION COUNT 高的 SQL,但是这套系统2个月之前由HP主机迁移到具有更高处理能力的 IBM 主机上(毕竟 IBM 主机是新购置的),数据库所有的配置、版本都没有变化,同时在应用系统系统没有什么主要的改动的情况下,VERSION COUNT 过高的 SQL 是不会有这么高的影响。
接下来_KGHDSIDX_COUNT 这个参数是最可疑的。这个参数表面上会影响 shared poollatch 的争用,那么它与 librarycache latch 有没有关系呢? 可以这样推测,如果一个会话持有某个 library cache latch 的情况下,去请求分配 Shared Pool 内存,这样不可避免请求持有 shared pool latch,shared pool latch 只有一个,很可能被其他会话持有,这就引起了争用,而等待 shared pool latch 的会话持有的 library cache latch 又会被其他一个甚至是多个会话请求,这又引起了 library cache latch 的争用。经过这样的分析,将一切问题的源头指向 shared pool latch 的争用,最终指向了_kghdsidx_count 参数。
在这个问题的处理过程中,对 VERSIONCOUNT 排名前列的 SQL 做了紧急处理,取消了表列上不合适的直方图,高 VERSION COUNT 的 SQL 大量减少,但是这项措施的确降低了硬解析,但是系统的主要问题仍然存在,这也表明 library cache latch 的主因的确不在于 VERSION COUNT 过高的 SQL。
三、问题的解决
现在,问题的源头在于_kghdsidx_count 参数,需要将这个参数复原到默认值,但这里的问题是,复原后会引起 ORA-600[504] 错误,严重的情况下会引起库宕掉,这是个两难的问题。而正如前面所述,相应的补丁已经打上,应该怎么样来解决这个问题?在找客户了解了这套系统当初安装的情况后,笔者将这套系统的 Oracle 数据库软件通过 TAR 复制到一台测试用的 IBM 主机上,并建一个测试库,经过测试,ORA-600[504] 错误仍然会触发,然后 relink 了 oracle 可执行文件之后,错误不再出现。看起来当初的 Oracle 软件是以其他地方 TAR 过来的方式安装的。这个 ORA-600[504] 就这样以这种意外的方式给解决了。
最终针对这个系统的性能问题,作出了如下的调整:
1. 将_kghdsidx_count 参数复原到默认值7。
2. Relink Oracle 软件。
3. 将 CPU_COUNT 复原到与逻辑 CPU 一样的值。
4. 再调大 shared_pool_size 到 5G 以预防 shared pool 子池增多后引起 ORA-4031 错误。
经过上述调整后,性能问题得到彻底的解决。甚至在几个月之后,一次由于一个后台大并发的批处理使得每秒解析数达到13000以上时,系统也没有遇到过这样的严重问题。
下面是调整后的性能数据:

可以看到与原来正常时间段的性能数据相比,shared pool latch 的 gets miss percent 从原来的2.2%降低到0.3%,等待时间从原来的179秒减少到只有7秒。Library cache latch 的 gets miss percent 虽然仍然是0.6%,但是等待时间却从原来的129秒降低到63秒。Shared pool 和 library cache 这2类的Latch 等待降低非常明显,这还是在 Parses/s、Executions/s 和 Transactions/s 均大大高于原来的情况下。而 Hard Parses/s 的减少得益于大量高VERSION COUNT 的 SQL 被处理,不再产生过多子游标。
四、问题的验证
在这个案例中,有一个关键的技术点:在执行 SQL 解析时,Oracle 进程会在持有了 library cache latch 的情况下去请求 shared pool latch,而不是在请求 shared pool 时不需要持有 library cache latch。
验证上面的这一点,有2个方法。下面以测试过程来详细描述。
测试环境 :Oracle 10.2.0.5.1 for Linux X86.
方法一:使用 oradebug。
1. 将数据库的“_kghdsidx_count”参数值设为1,并重启数据库,以保证只有一个 shared pool child latch。
2. 使用 sqlplus 连接到数据库,假设这个会话是 session-1,查询当前的 SID:
SQL> select sid from v$mystat where rownum=1;
SID
----------
159
同时获得当前连接的 spid 为2415。
3. 新建一个连接到数据库,假设会话是 session-2,查询 shared pool latch 的地址,并使用 oradebug 将这个地址对应的值置为1,以表示该 latch 已经被持有:
SQL> select addr,latch#,level#,child#,name,gets from v$latch_children where name='shared pool';
ADDR LATCH# LEVEL# CHILD# NAME GETS
-------- ---------- ---------- ---------- -------------------------------------------------- ----------
200999BC 216 7 1 shared pool 34949
20099A20 216 7 2 shared pool 6
20099A84 216 7 3 shared pool 6
20099AE8 216 7 4 shared pool 6
20099B4C 216 7 5 shared pool 6
20099BB0 216 7 6 shared pool 6
20099C14 216 7 7 shared pool 6
SQL> oradebug poke 0x200999BC 4 1
BEFORE: [200999BC, 200999C0) = 00000000
AFTER: [200999BC, 200999C0) = 00000001
4. 在 session-1 会话中执行下面的 SQL:
SQL> select owner from t where object_id=3003;
正如预料之中的反映,这个会话 hang 住。
5. 在 session-2 中,对 session-1 的进程作 process dump。(注意这个时候不能查询 v$session_wait、v$latchholder 等视图)
SQL> oradebug setospid 2415
Oracle pid: 15, Unix process pid: 2415, image: oracle@xty (TNS V1-V3)
SQL> oradebug dump processstate 10
Statement processed.
SQL> oradebug tracefile_name
/oracle/app/oracle/admin/xty/udump/xty_ora_2415.trc
然后从 /oracle/app/oracle/admin/xty/udump/xty_ora_2415.trc 这个 TRACE 文件中可以找到下面的信息:
Process global information:
process: 0x51a2dce8, call: 0x51b465e4, xact: (nil), curses: 0x51b2a4b8, usrses: 0x51b2a4b8
----------------------------------------
SO: 0x51a2dce8, type: 2, owner: (nil), flag: INIT/-/-/0x00
(process) Oracle pid=15, calls cur/top: 0x51b465e4/0x51b465e4, flag: (0) -
int error: 0, call error: 0, sess error: 0, txn error 0
(post info) last post received: 110 0 4
last post received-location: kslpsr
last process to post me: 51a2a904 1 6
last post sent: 0 0 24
last post sent-location: ksasnd
last process posted by me: 51a2a904 1 6
(latch info) wait_event=0 bits=20
Location from where call was made: kghupr1: Chunk Header
Context saved from call: 1306572176
waiting for 200999bc Child shared pool level=7 child#=1
Location from where latch is held: kghupr1: Chunk Header
Context saved from call: 1299065692
state=busy, wlstate=free
waiters [orapid (seconds since: put on list, posted, alive check)]:
10 (54, 1304393092, 54)
11 (54, 1304393092, 54)
24 (15, 1304393092, 15)
15 (6, 1304393092, 6)
waiter count=4
gotten 35138 times wait, failed first 502 sleeps 5
gotten 0 times nowait, failed: 0
on wait list for 200999bc
holding (efd=3) 4f7c75f8 Child library cache level=5 child#=1
Location from where latch is held: kgllkdl: child: no lock handle: latch
Context saved from call: 2
state=busy, wlstate=free
从 waiting for200999bc Child shared pool level=7 child#=1 和 holding (efd=3) 4f7c75f8 Child library cache level=5 child#=1 可以看到,进程的确是在持有了 library cache latch 的同时去请求 shared pool latch。
最后使用“oradebugpoke 0×200999BC 4 0”命令将 shared pool latch 置为 free 状态。
方法二:使用 gdb。
1. 还原”_kghdsidx_count”参数,重启数据库。
2. 使用 sqlplus 连接到数据库,获取对应的 Oracle Process 的 spid 为 4763。
3. 使用 gdb:
[oracle@xty ~]$ gdb -p 4763
GNU gdb (GDB) Red Hat Enterprise Linux (7.0.1-23.el5)
Copyright (C) 2009 Free Software Foundation, Inc.
...省略部分输出...
Reading symbols from /lib/libnss_files.so.2...(no debugging symbols found)...done.
Loaded symbols for /lib/libnss_files.so.2
0x0059b402 in __kernel_vsyscall ()
4. 在 gdb 中,在 latch 的获取和释放的函数上设置断点:
(gdb) b kslgpl
Breakpoint 1 at 0x8339fca
(gdb) b kslgetsl
Breakpoint 2 at 0x833a2d5
(gdb) b kslgpl
Breakpoint 3 at 0x83473bf
(gdb) b kslg2c
Breakpoint 4 at 0x8347886
(gdb) b kslg2csl
Breakpoint 5 at 0x834794e
(gdb) b kslgprl
Breakpoint 6 at 0x8346186
(gdb)
Note: breakpoint 6 also set at pc 0x8346186.
Breakpoint 7 at 0x8346186
(gdb) b kslfre
Breakpoint 8 at 0x833c05d
(gdb) b kslf2c
Breakpoint 9 at 0x8347a1e
(gdb) b kslfpl
Breakpoint 10 at 0x8347812
(gdb) b kslfal
Breakpoint 11 at 0x833fbca
(gdb) b kslfpl0
Breakpoint 12 at 0x834766d
(gdb)
注:最后几个函数只是猜测跟 latch 有关....latch 的请求和释放所调用的函数主要为:kslgetl、kslgetsl 和 kslfre。
(gdb) c
Continuing.
5. 在 sqlplus 中执行 SQL:
SQL> select * from t where object_id=10000;
正如预期的那样,会话 hang 住。这是因为运行到了 gdb 设置的断点。
6. 在 gdb 中可以看到:
Breakpoint 2, 0x0833a2d5 in kslgetsl ()
(gdb) info f
Stack level 0, frame at 0xbfd3fb08:
eip = 0x833a2d5 in kslgetsl; saved eip 0x84257e1
called by frame at 0xbfd3fb44
Arglist at 0xbfd3fb00, args:
Locals at 0xbfd3fb00, Previous frame's sp is 0xbfd3fb08
Saved registers:
ebp at 0xbfd3fb00, eip at 0xbfd3fb04
(gdb) x /10x 0xbfd3fb00
0xbfd3fb00: 0xbfd3fb3c 0x084257e1 0x51b4c38c 0x00000001
0xbfd3fb10: 0x51b11738 0x00000058 0x00000008 0x00000002
0xbfd3fb20: 0x0d099c40 0x0d099d3c
0×51b4c38c 这是一个地址,从 v$latch 和 v$latch_children 中可以查到正是是 session idle bit latch。
7. 在 gdb 中继续:
(gdb) c
Continuing.
Breakpoint 8, 0x0833c05d in kslfre ()
(gdb) info f
Stack level 0, frame at 0xbfd3fb18:
eip = 0x833c05d in kslfre; saved eip 0x842581a
called by frame at 0xbfd3fb44
Arglist at 0xbfd3fb10, args:
Locals at 0xbfd3fb10, Previous frame's sp is 0xbfd3fb18
Saved registers:
ebp at 0xbfd3fb10, eip at 0xbfd3fb14
(gdb) x /10x 0xbfd3fb10
0xbfd3fb10: 0xbfd3fb3c 0x0842581a 0x51b4c38c 0x00000002
0xbfd3fb20: 0x0d099c40 0x0d099d3c 0x0d099c40 0x00000002
0xbfd3fb30: 0x00000000 0x517a7090
(gdb) c
Continuing.
----下面很重要-----
Breakpoint 1, 0x08339fca in kslgetl ()
(gdb) x /10x $ebp+8
0xbfd3ecc0: 0x4f7c7594 0x00000001 0x00000001 0x00000a57
0xbfd3ecd0: 0x0af275ca 0x00000000 0x0dcfdcc0 0x0d045860
0xbfd3ece0: 0xbfd3ed58 0x0b20fc09
(gdb) c
Continuing.
Breakpoint 8, 0x0833c05d in kslfre ()
(gdb) x /10x $ebp+8
0xbfd3ed64: 0x4f7c7594 0x00000000 0x10010040 0x0d045860
0xbfd3ed74: 0xbfd3ef10 0x0b1f5d10 0x0d099c40 0x4f7c7594
0xbfd3ed84: 0x00000000 0x00000008
(gdb) c
Continuing.
Breakpoint 1, 0x08339fca in kslgetl ()
(gdb) x /10x $ebp+8
0xbfd3ecc0: 0x4f7c7594 0x00000001 0x00000001 0x00000a57
0xbfd3ecd0: 0x0af275ca 0x00000000 0x0dcfdcc0 0x0d045860
0xbfd3ece0: 0xbfd3ed58 0x0b20fc09
(gdb) c
Continuing.
Breakpoint 1, 0x08339fca in kslgetl ()
(gdb) x /10x $ebp+8
0xbfd3eb50: 0x200999bc 0x00000001 0x00000000 0x000009de
0xbfd3eb60: 0x0d099c40 0x0000000f 0x0c3c3ec0 0x0d045860
0xbfd3eb70: 0xbfd3ec10 0x0af3983b
(gdb) c
Continuing.
Breakpoint 8, 0x0833c05d in kslfre ()
(gdb) x /10x $ebp+8
0xbfd3eb6c: 0x200999bc 0x0d099c40 0x2001d310 0x0d045860
0xbfd3eb7c: 0xbfd3ec10 0x0af390a8 0x0d099c40 0x200999bc
0xbfd3eb8c: 0xbfd3ebe8 0x00000164
(gdb) c
Continuing.
Breakpoint 8, 0x0833c05d in kslfre ()
(gdb) x /10x $ebp+8
0xbfd3ed64: 0x4f7c7594 0x00000000 0x10010040 0x0d045860
0xbfd3ed74: 0xbfd3ef10 0x0b1f58e6 0x0d099c40 0x4f7c7594
0xbfd3ed84: 0x00000000 0x00000008
(gdb) quit
A debugging session is active.
Inferior 1 [process 4763] will be detached.
同时可以从数据库中查到:
SQL> select addr,latch#,child#,level#,name from v$latch_children
where name in ('library cache','shared pool');
ADDR LATCH# CHILD# LEVEL# NAME
-------- ---------- ---------- ---------- --------------------------------------------------
4F7C75F8 217 1 5 library cache
4F7C7594 217 2 5 library cache
4F7C7530 217 3 5 library cache
200999BC 216 1 7 shared pool
20099A20 216 2 7 shared pool
20099A84 216 3 7 shared pool
20099AE8 216 4 7 shared pool
20099B4C 216 5 7 shared pool
20099BB0 216 6 7 shared pool
20099C14 216 7 7 shared pool
标记为”下面很重要“的输出,汇总起来就是:
kslgetl 0x4f7c7594 library cache
kslfre 0x4f7c7594 library cache
kslgetl 0x4f7c7594 library cache
kslgetl 0x200999bc shared pool
kslfre 0x200999bc shared pool
kslfre 0x4f7c7594 library cache
这个过程可以理解为:Oracle 进程首先获取 library cache latch,在 library cache 中查找是否已经有要执行的 SQL 语句(这里显然没有找到),然后释放 library cache。接下来是硬解析 SQL 的后半部分,首先获取 library cache latch,然后获取 shared pool latch,从 shared pool 中申请内存, 然后释放 shared pool latch,最后再获取 library cache latch。
后面不再继续跟踪解析的过程,这个过程会有相当多的 latch 的获取和释放,但是从上面可以很清晰地看到,进程在持有了 library cache latch 的同时去请求 shared pool latch。
四、问题总结
从这个问题可以总结出,在 Oracle DBA 日常工作中值得注意的几个经验:
1. 对于隐含参数的使用,一定要确认其带来的影响。
2. 安装 Oracle 数据库软件,如果是从其他主机上 TAR 到新主机上的,那么建议对执行一次 relink all。以避免出现本文出现的诡异问题。
3. 对于性能问题的 Trouble Shooting,不要被性能数据的表面现象所迷惑,性能数据中最明显的地方不一定是问题的根源,需要仔细分析,找到真正的 Root Cause。
文章来源:《Oracle DBA 手记 3》隐含参数与 LibraryCache 与 Shared Pool Latch 原理 作者:熊军
配图来源: https://ashminderubhi.files.wordpress.com/2012/07/untitled3.png

2015 Oracle 技术嘉年华最后9折抢票中,点击原文链接注册参会。


 1
1


 被折叠的 条评论
为什么被折叠?
被折叠的 条评论
为什么被折叠?
 到【灌水乐园】发言


