


利用python—matplotlib绘制股票K线图
成品展示:
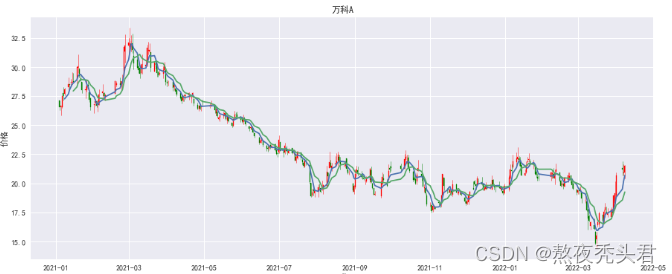
用Python绘制股票K线图并不复杂,不过得做好一些准备工作例如相关库的安装,库的引入、日期格式的调整and表格转换
安装库
#Windows命令行窗口中输入并执行命令
pip install https://github.com/matplotlib/mpl_finance/archive/master.zip
导入库
import tushare as ts
import matplotlib.pyplot as plt
import mpl_finance as mpf
import seaborn as sns
sns.set()
数据获取
#获取股票数据
df = ts.get_k_data('000002','2021-01-01','2022-04-10')
df
时间格式调整And格式转换
结果
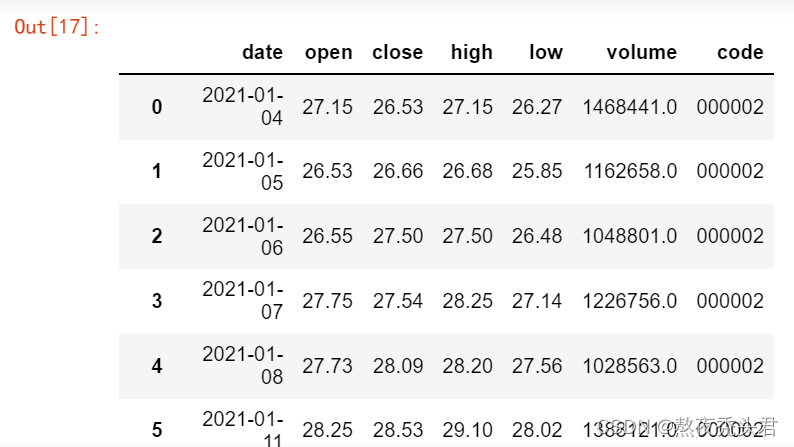
*由于通过tushare模块获取的数据中时间部分格式无法普配,需要使用时间格式调整函数将时间格式更改为我们能够使用的数据类型
 最低0.47元/天 解锁文章


 261
261


 被折叠的 条评论
为什么被折叠?
被折叠的 条评论
为什么被折叠?
 到【灌水乐园】发言


