


没写过 写着玩玩 不足的地方还望小伙伴补充~~
概念篇
文档奉上:数据集 - 概念篇 - 使用手册 - Apache ECharts![]() https://echarts.apache.org/handbook/zh/concepts/dataset
https://echarts.apache.org/handbook/zh/concepts/dataset
<template>
<div id="main" style="width: 600px; height: 400px"></div>
</template>
<script>
import * as echarts from "echarts";
// 基于准备好的dom,初始化echarts实例
var myChart = echarts.init(document.getElementById("main"));
// 绘制图表
myChart.setOption({
title: {
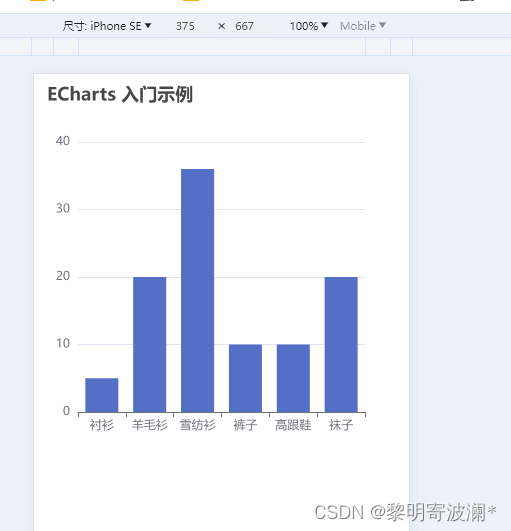
text: "ECharts 入门示例",
},
tooltip: {},
xAxis: {
data: ["衬衫", "羊毛衫", "雪纺衫", "裤子", "高跟鞋", "袜子"],
},
yAxis: {},
series: [
{
name: "销量",
type: "bar",
data: [5, 20, 36, 10, 10, 20],
},
],
});
</script>
遇到的报错问题
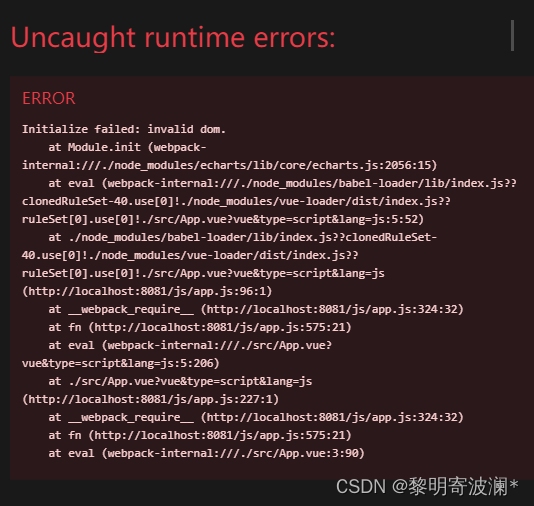
我觉得应该是在加载的时候 dom还没有加载出来 所以我决定 给他写进生命周期里边 就有了如下代码
<template>
  <div id="main" style="width: 600px; height: 400px"></div>
</template>
<script setup>
import * as echarts from "echarts";
import { onMounted } from "vue";

onMounted(() => {
  // 基于准备好的dom,初始化echarts实例
  var myChart = echarts.init(document.getElementById("main"));

  // 绘制图表
  myChart.setOption({
    title: {
      text: "ECharts 入门示例",
    },
    tooltip: {},
    xAxis: {
      data: ["衬衫", "羊毛衫", "雪纺衫", "裤子", "高跟鞋", "袜子"],
    },
    yAxis: {},
    series: [
      {
        name: "销量",
        type: "bar",
        data: [5, 20, 36, 10, 10, 20],
      },
    ],
  });
});
</script>

<style lang="scss">
#app {
  font-family: Avenir, Helvetica, Arial, sans-serif;
  -webkit-font-smoothing: antialiased;
  -moz-osx-font-smoothing: grayscale;
  text-align: center;
  color: #2c3e50;
}
</style>
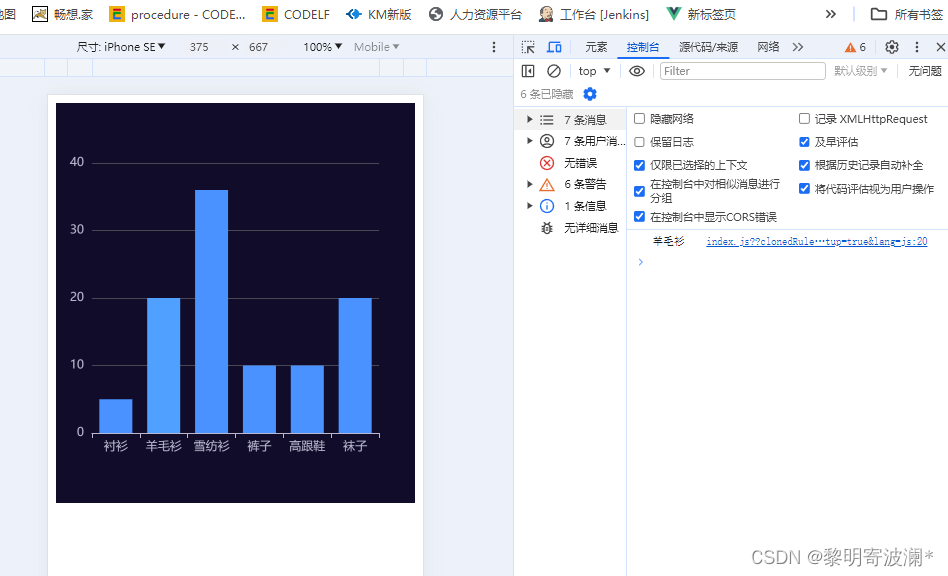
’看下效果图
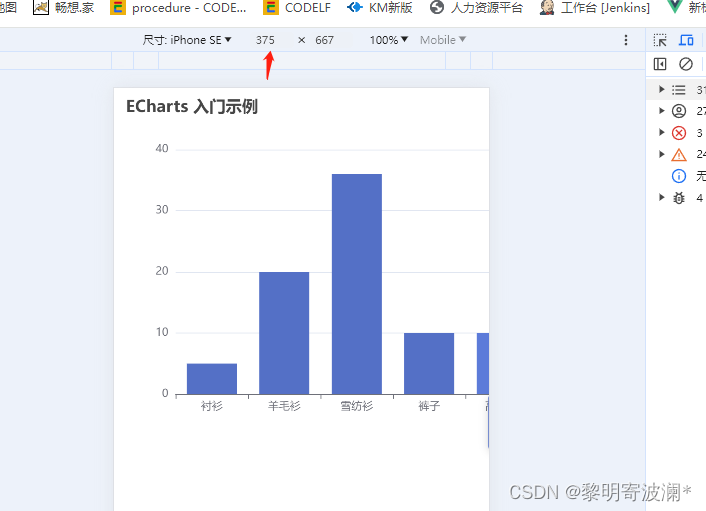 展示不全 因为我这个显示得宽度是375 而我给定了宽度是600 这种情况怎么让他自适应宽度呢
发现一段代码
响应容器大小的变化
监听图表容器的大小并改变图表大小
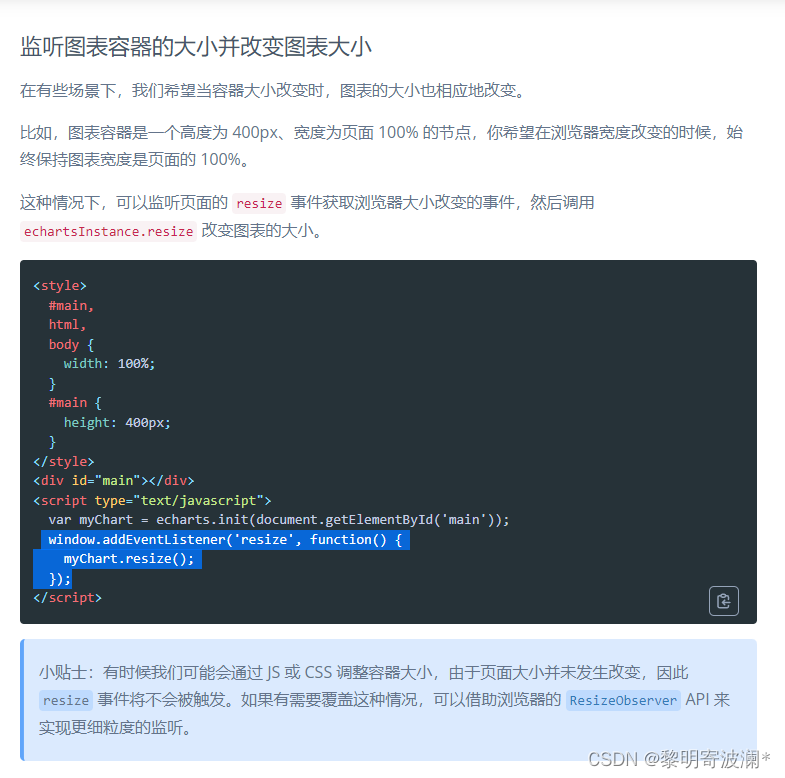
加上试试
<template>
  <div id="main" style="height: 400px"></div>
</template>
<script setup>
import * as echarts from "echarts";
import { onMounted } from "vue";

onMounted(() => {
  // 基于准备好的dom,初始化echarts实例
  var myChart = echarts.init(document.getElementById("main"));
  window.addEventListener("resize", function () {
    myChart.resize();
  });
  // 绘制图表
  myChart.setOption({
    title: {
      text: "ECharts 入门示例",
    },
    tooltip: {},
    xAxis: {
      data: ["衬衫", "羊毛衫", "雪纺衫", "裤子", "高跟鞋", "袜子"],
    },
    yAxis: {},
    series: [
      {
        name: "销量",
        type: "bar",
        data: [5, 20, 36, 10, 10, 20],
      },
    ],
  });
});
</script>

<style lang="scss">
#app {
  font-family: Avenir, Helvetica, Arial, sans-serif;
  -webkit-font-smoothing: antialiased;
  -moz-osx-font-smoothing: grayscale;
  text-align: center;
  color: #2c3e50;
}
</style>
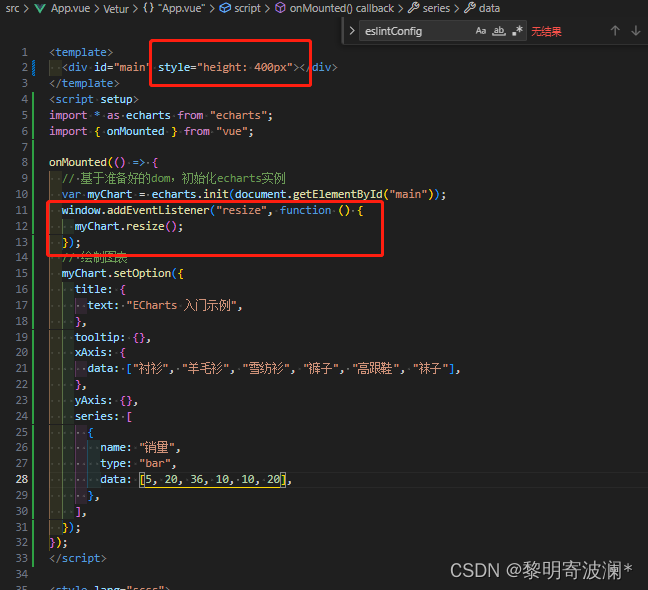
加上后别忘记删除你的行内给的宽度哈 不然还是不生效的 果然 加完这段代码后 我的效果图宽度可以自适应了 看下效果图吧~
为图表设置特定的大小
除了直接调用 resize() 不含参数的形式之外,还可以指定宽度和高度,实现图表大小不等于容器大小的效果。
myChart.resize({
  width: 800,
  height: 400
});
样式
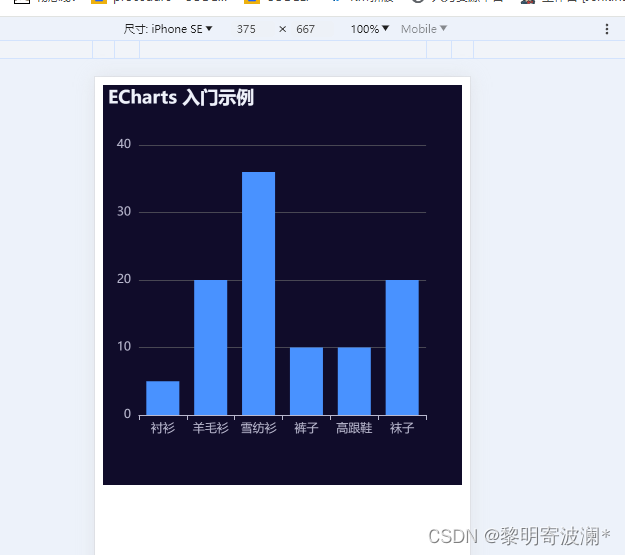
颜色主题(深色主题)
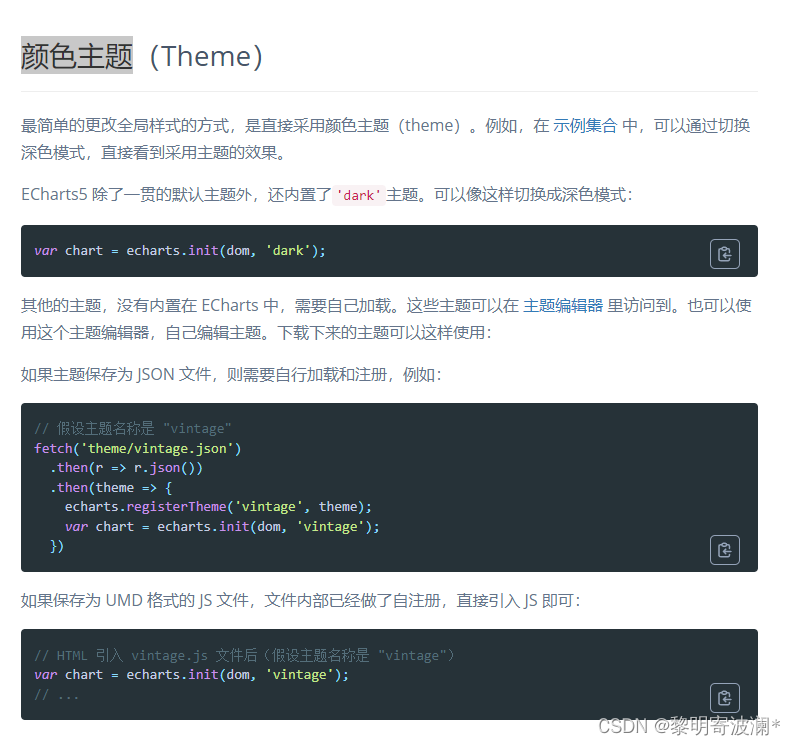
看下效果图吧
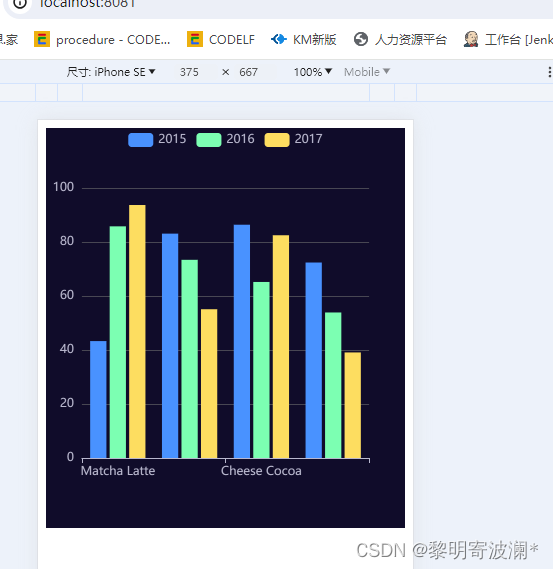
数据集
数据集(dataset)是专门用来管理数据的组件。虽然每个系列都可以在 series.data 中设置数据,但是从 ECharts4 支持数据集开始,更推荐使用数据集来管理数据。因为这样,数据可以被多个组件复用,也方便进行 “数据和其他配置” 分离的配置风格。毕竟,在运行时,数据是最常改变的,而其他配置大多并不会改变。
<template>
<div id="main" style="height: 400px"></div>
</template>
<script setup>
import * as echarts from "echarts";
import { onMounted } from "vue";
onMounted(() => {
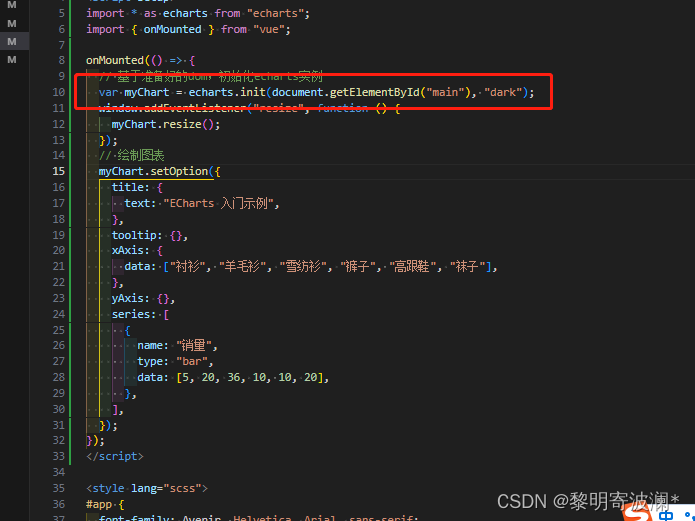
// 基于准备好的dom,初始化echarts实例
var myChart = echarts.init(document.getElementById("main"), "dark");
window.addEventListener("resize", function () {
myChart.resize();
});
// 绘制图表
myChart.setOption({
legend: {},
tooltip: {},
dataset: {
// 提供一份数据。
source: [
["product", "2015", "2016", "2017"],
["Matcha Latte", 43.3, 85.8, 93.7],
["Milk Tea", 83.1, 73.4, 55.1],
["Cheese Cocoa", 86.4, 65.2, 82.5],
["Walnut Brownie", 72.4, 53.9, 39.1],
],
},
// 声明一个 X 轴,类目轴(category)。默认情况下,类目轴对应到 dataset 第一列。
xAxis: { type: "category" },
// 声明一个 Y 轴,数值轴。
yAxis: {},
// 声明多个 bar 系列,默认情况下,每个系列会自动对应到 dataset 的每一列。
series: [{ type: "bar" }, { type: "bar" }, { type: "bar" }],
});
});
</script>
<style lang="scss">
#app {
font-family: Avenir, Helvetica, Arial, sans-serif;
-webkit-font-smoothing: antialiased;
-moz-osx-font-smoothing: grayscale;
text-align: center;
color: #2c3e50;
}
</style>
看下效果图吧
坐标轴
上代码
<template>
  <div id="main" style="height: 400px"></div>
</template>
<script setup>
import * as echarts from "echarts";
import { onMounted } from "vue";

onMounted(() => {
  // 基于准备好的dom,初始化echarts实例
  var myChart = echarts.init(document.getElementById("main"), "dark");
  window.addEventListener("resize", function () {
    myChart.resize();
  });
  // 绘制图表
  myChart.setOption({
    //  提示框,可以全局设置,也可设置在坐标系或系列数据中
    tooltip: {
      //触发类型,'item'数据项图形触发,主要在散点图,饼图等无类目轴的图表中使用;'axis'坐标轴触发,主要在柱状图,折线图等会使用类目轴的图表中使用。
      trigger: "axis",
      axisPointer: { type: "cross" },
    },
    // /图例,图中的标记(symbol),通常位于右上方,颜色和名字。可以通过点击图例控制哪些系列不显示。
    legend: {},
    xAxis: [
      {
        type: "category",
        axisTick: {
          alignWithLabel: true, //刻度是否位于标签中间
        },
        data: [
          "1月",
          "2月",
          "3月",
          "4月",
          "5月",
          "6月",
          "7月",
          "8月",
          "9月",
          "10月",
          "11月",
          "12月",
        ],
      },
    ],
    yAxis: [
      {
        type: "value",
        name: "降水量",
        min: 0,
        max: 250,
        position: "right",
        axisLabel: {
          formatter: "{value} ml",
        },
      },
      {
        type: "value",
        name: "温度",
        min: 0,
        max: 25,
        position: "left",
        axisLabel: {
          formatter: "{value} °C",
        },
      },
    ],
    series: [
      {
        name: "降水量",
        type: "bar",
        yAxisIndex: 0,
        data: [
          6, 32, 70, 86, 68.7, 100.7, 125.6, 112.2, 78.7, 48.8, 36.0, 19.3,
        ],
      },
      {
        name: "温度",
        type: "line",
        smooth: true,
        yAxisIndex: 1,
        data: [
          6.0, 10.2, 10.3, 11.5, 10.3, 13.2, 14.3, 16.4, 18.0, 16.5, 12.0, 5.2,
        ],
      },
    ],
    title: {
      text: "ECharts 入门示例",
    },
  });
});
</script>

<style lang="scss">
#app {
  font-family: Avenir, Helvetica, Arial, sans-serif;
  -webkit-font-smoothing: antialiased;
  -moz-osx-font-smoothing: grayscale;
  text-align: center;
  color: #2c3e50;
}
</style>
看下效果图吧

代码有些注释我已经写上了 具体还得看文档
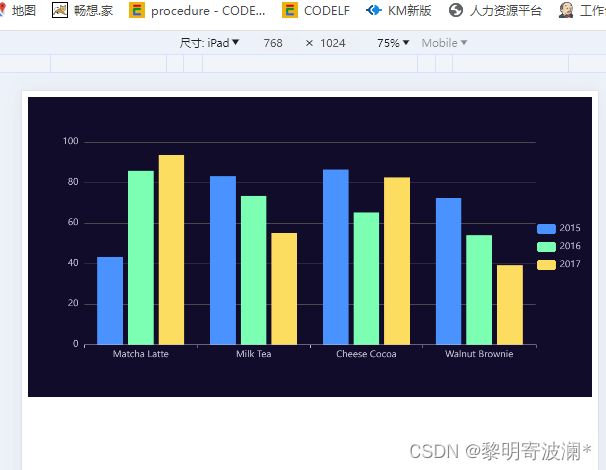
图例
图例是图表中对内容区元素的注释、用不同形状、颜色、文字等来标示不同数据列,通过点击对应数据列的标记,可以显示或隐藏该数据列。图例虽然不是图表中的主要信息、却是了解图表信息的钥匙。
option = {
  legend: {
    // Try 'horizontal'
    orient: 'vertical',
    right: 10,
    top: 'center'
  },
  dataset: {
    source: [
      ['product', '2015', '2016', '2017'],
      ['Matcha Latte', 43.3, 85.8, 93.7],
      ['Milk Tea', 83.1, 73.4, 55.1],
      ['Cheese Cocoa', 86.4, 65.2, 82.5],
      ['Walnut Brownie', 72.4, 53.9, 39.1]
    ]
  },
  xAxis: { type: 'category' },
  yAxis: {},
  series: [{ type: 'bar' }, { type: 'bar' }, { type: 'bar' }]
};
看下效果图吧
事件与行为
myChart.on('click', function(params) {
  // 控制台打印数据的名称
  console.log(params.name);
});
我点击了羊毛衫 就log出了羊毛衫


 4904
4904


 被折叠的 条评论
为什么被折叠?
被折叠的 条评论
为什么被折叠?
 到【灌水乐园】发言


