


测试环境 172.16.139.186
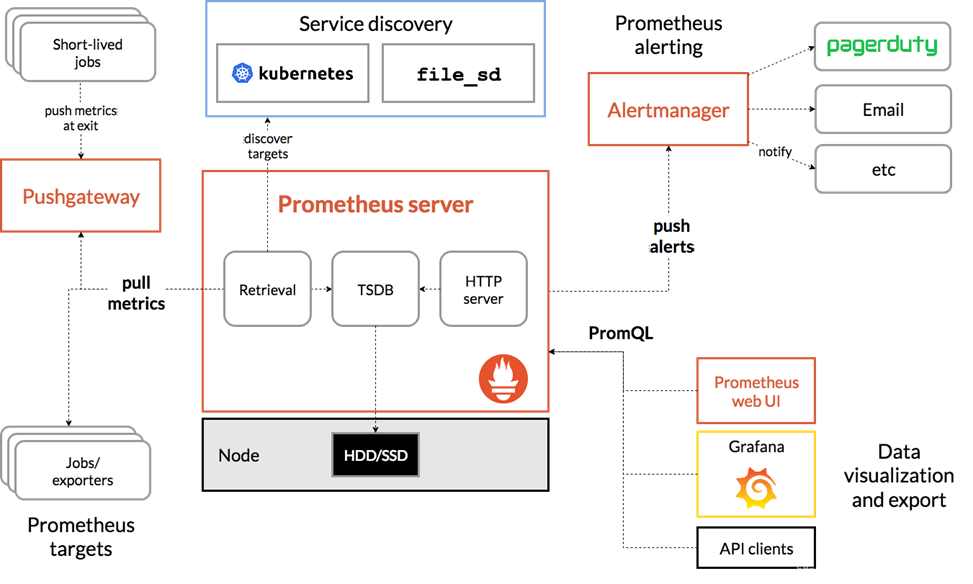
1、安装prometheus客户端
[root@172-16-139-186 1-prometheus]#tar -xf prometheus-2.33.3.linux-amd64.tar.gz #解压软件包
[root@172-16-139-186 1-prometheus]#mv prometheus-2.33.3.linux-amd64/ /usr/local/prometheus #将软件包移动到安装软件的目录并改名
[root@172-16-139-186 1-prometheus]#cd /usr/local/prometheus/
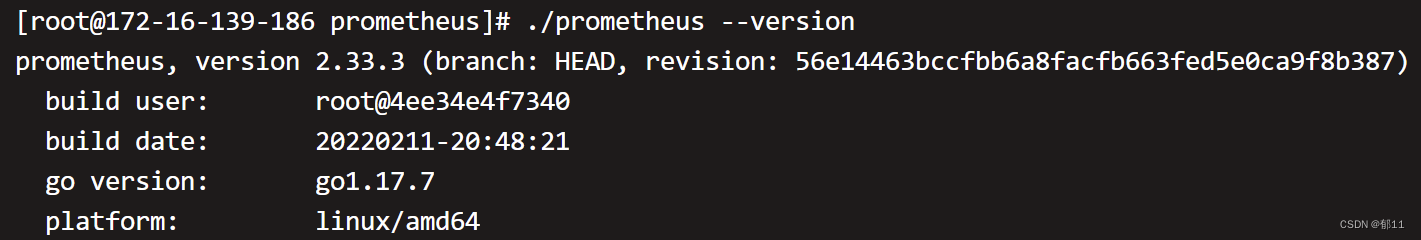
[root@172-16-139-186 1-prometheus]#./prometheus --version
[root@172-16-139-186 1-prometheus]#sed -i '$s/"localhost:/"172.16.139.186:/' prometheus.yml #修改配置文件,IP为本机地址
[root@172-16-139-186 1-prometheus]#./promtool check config ./prometheus.yml #检查配置文件语法
[root@172-16-139-186 1-prometheus]#vim /usr/lib/systemd/system/prometheus.service

[root@172-16-139-186 1-prometheus]#systemctl daemon-reload
[root@172-16-139-186 1-prometheus]#systemctl enable prometheus.service --now
[root@172-16-139-186 1-prometheus]#ss -tunlp |grep 9090
此时通过浏览器访问:172.16.139.186:9090 ;确保prometheus正常

2、安装prometheus被控端
[root@172-16-139-186 1-prometheus]#tar -xf node_exporter-1.3.1.linux-amd64.tar.gz
[root@172-16-139-186 1-prometheus]#mv node_exporter-1.3.1.linux-amd64 /usr/local/node_exporter
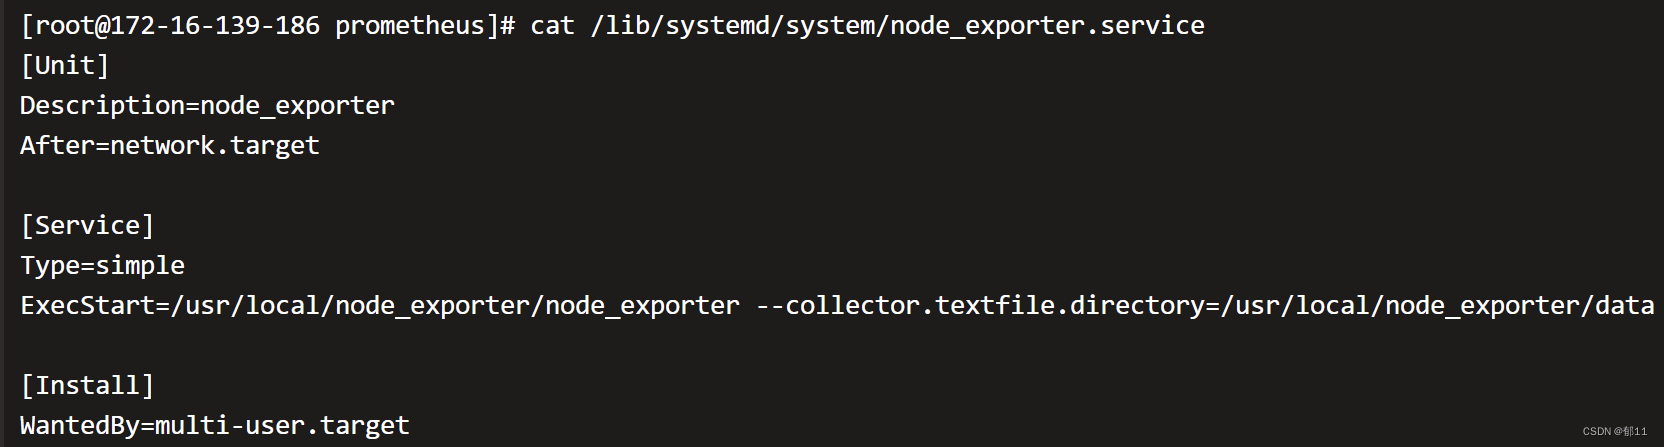
[root@172-16-139-186 1-prometheus]#vim /lib/systemd/system/node_exporter.service
[root@172-16-139-186 1-prometheus]#systemctl daemon-reload
[root@172-16-139-186 1-prometheus]#systemctl enable node_exporter.service --now
[root@172-16-139-186 1-prometheus]#ss -tunlp |grep 9100
[root@172-16-139-186 1-prometheus]#vim /usr/local/prometheus/prometheus.yml #在行尾添加被控端配置

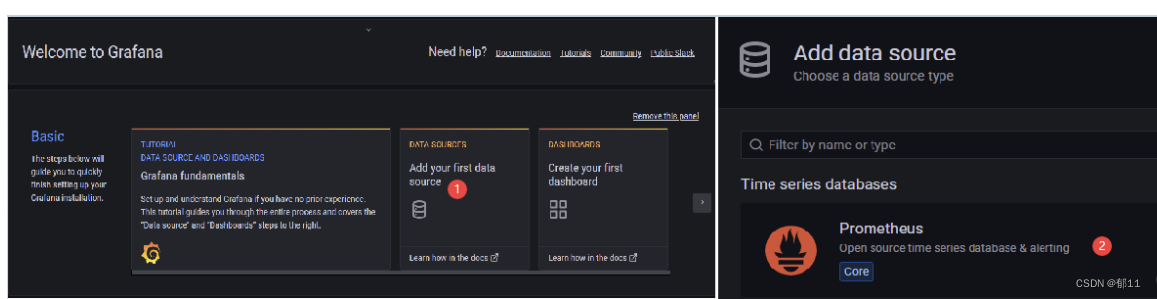
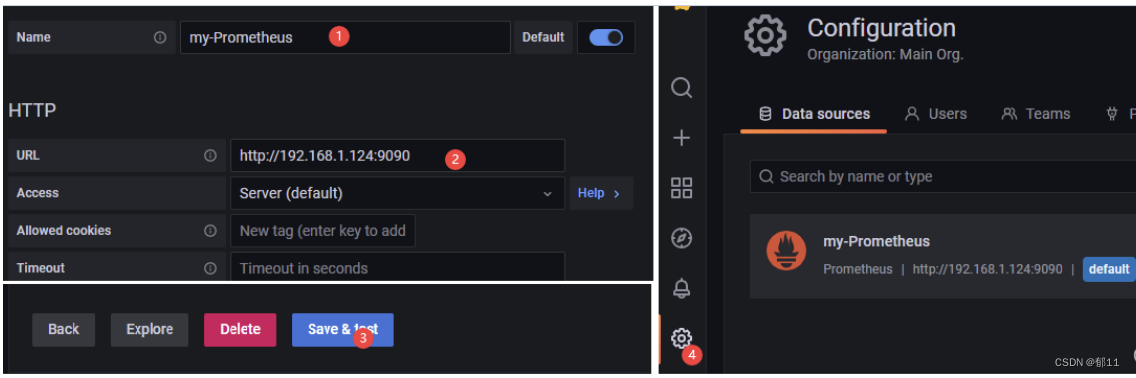
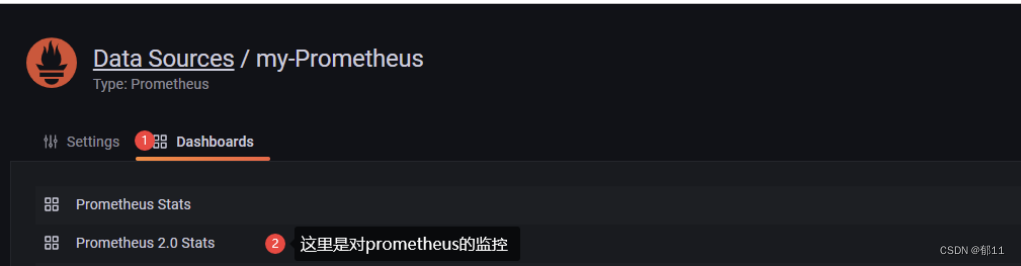
3、安装grafana
[root@172-16-139-186 1-prometheus]#wget https://dl.grafana.com/enterprise/release/grafana-enterprise-8.3.6-1.x86_64.rpm
[root@172-16-139-186 1-prometheus]#yum -y install grafana-enterprise-8.3.6-1.x86_64.rpm
[root@172-16-139-186 1-prometheus]#systemctl enable grafana-server.service --now
[root@172-16-139-186 1-prometheus]#ss -tunlp | grep grafana

4、安装Alertmanager
[root@172-16-139-186 1-prometheus]#tar -xf alertmanager-0.23.0.linux-amd64.tar.gz -C /usr/local/
[root@172-16-139-186 1-prometheus]#mv /usr/local/alertmanager-0.23.0.linux-amd64/ /usr/local/alertmanager
[root@172-16-139-186 1-prometheus]#vim /lib/systemd/system/alertmanager.service
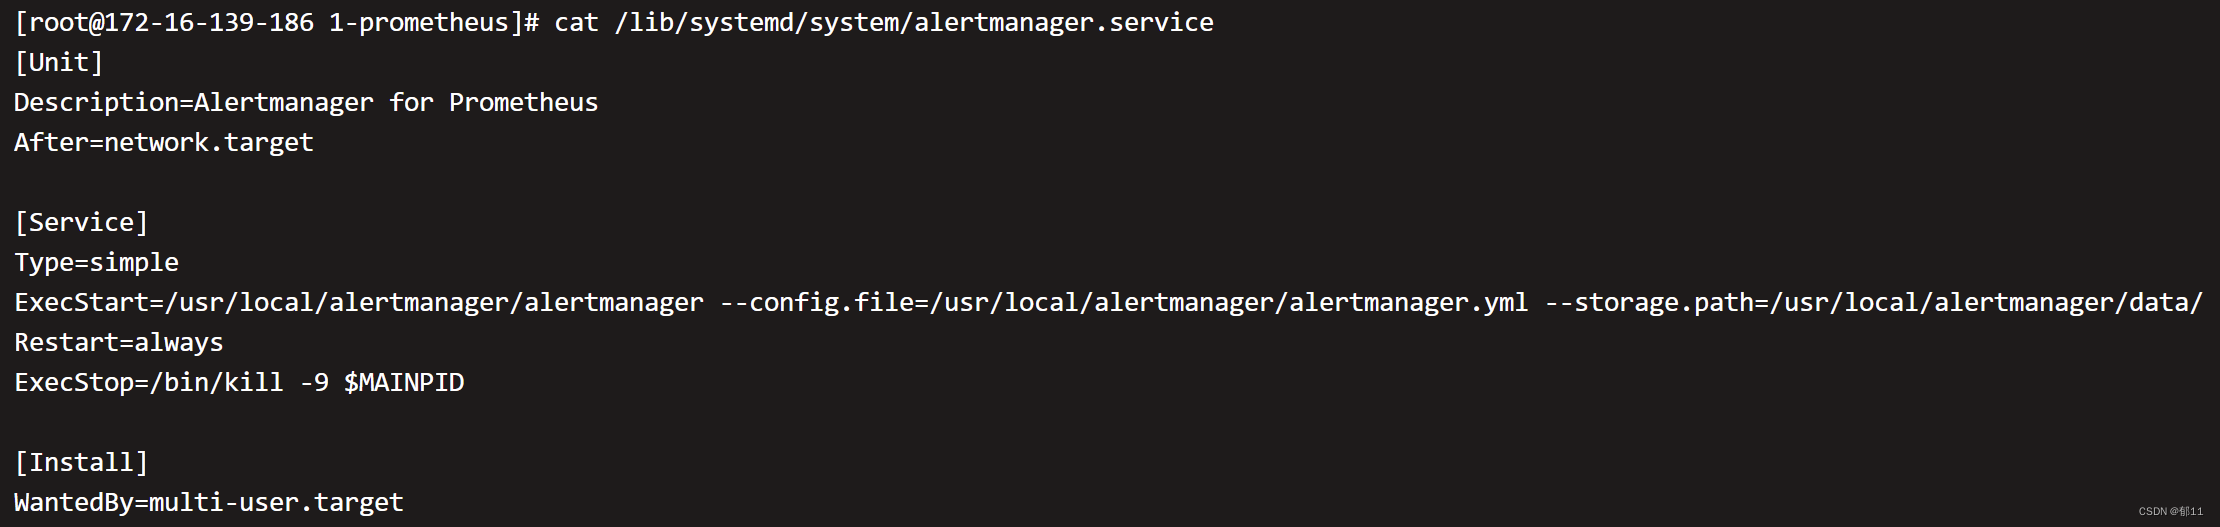
[root@172-16-139-186 1-prometheus]#systemctl daemon-reload
[root@172-16-139-186 1-prometheus]#systemctl enable alertmanager.service --now
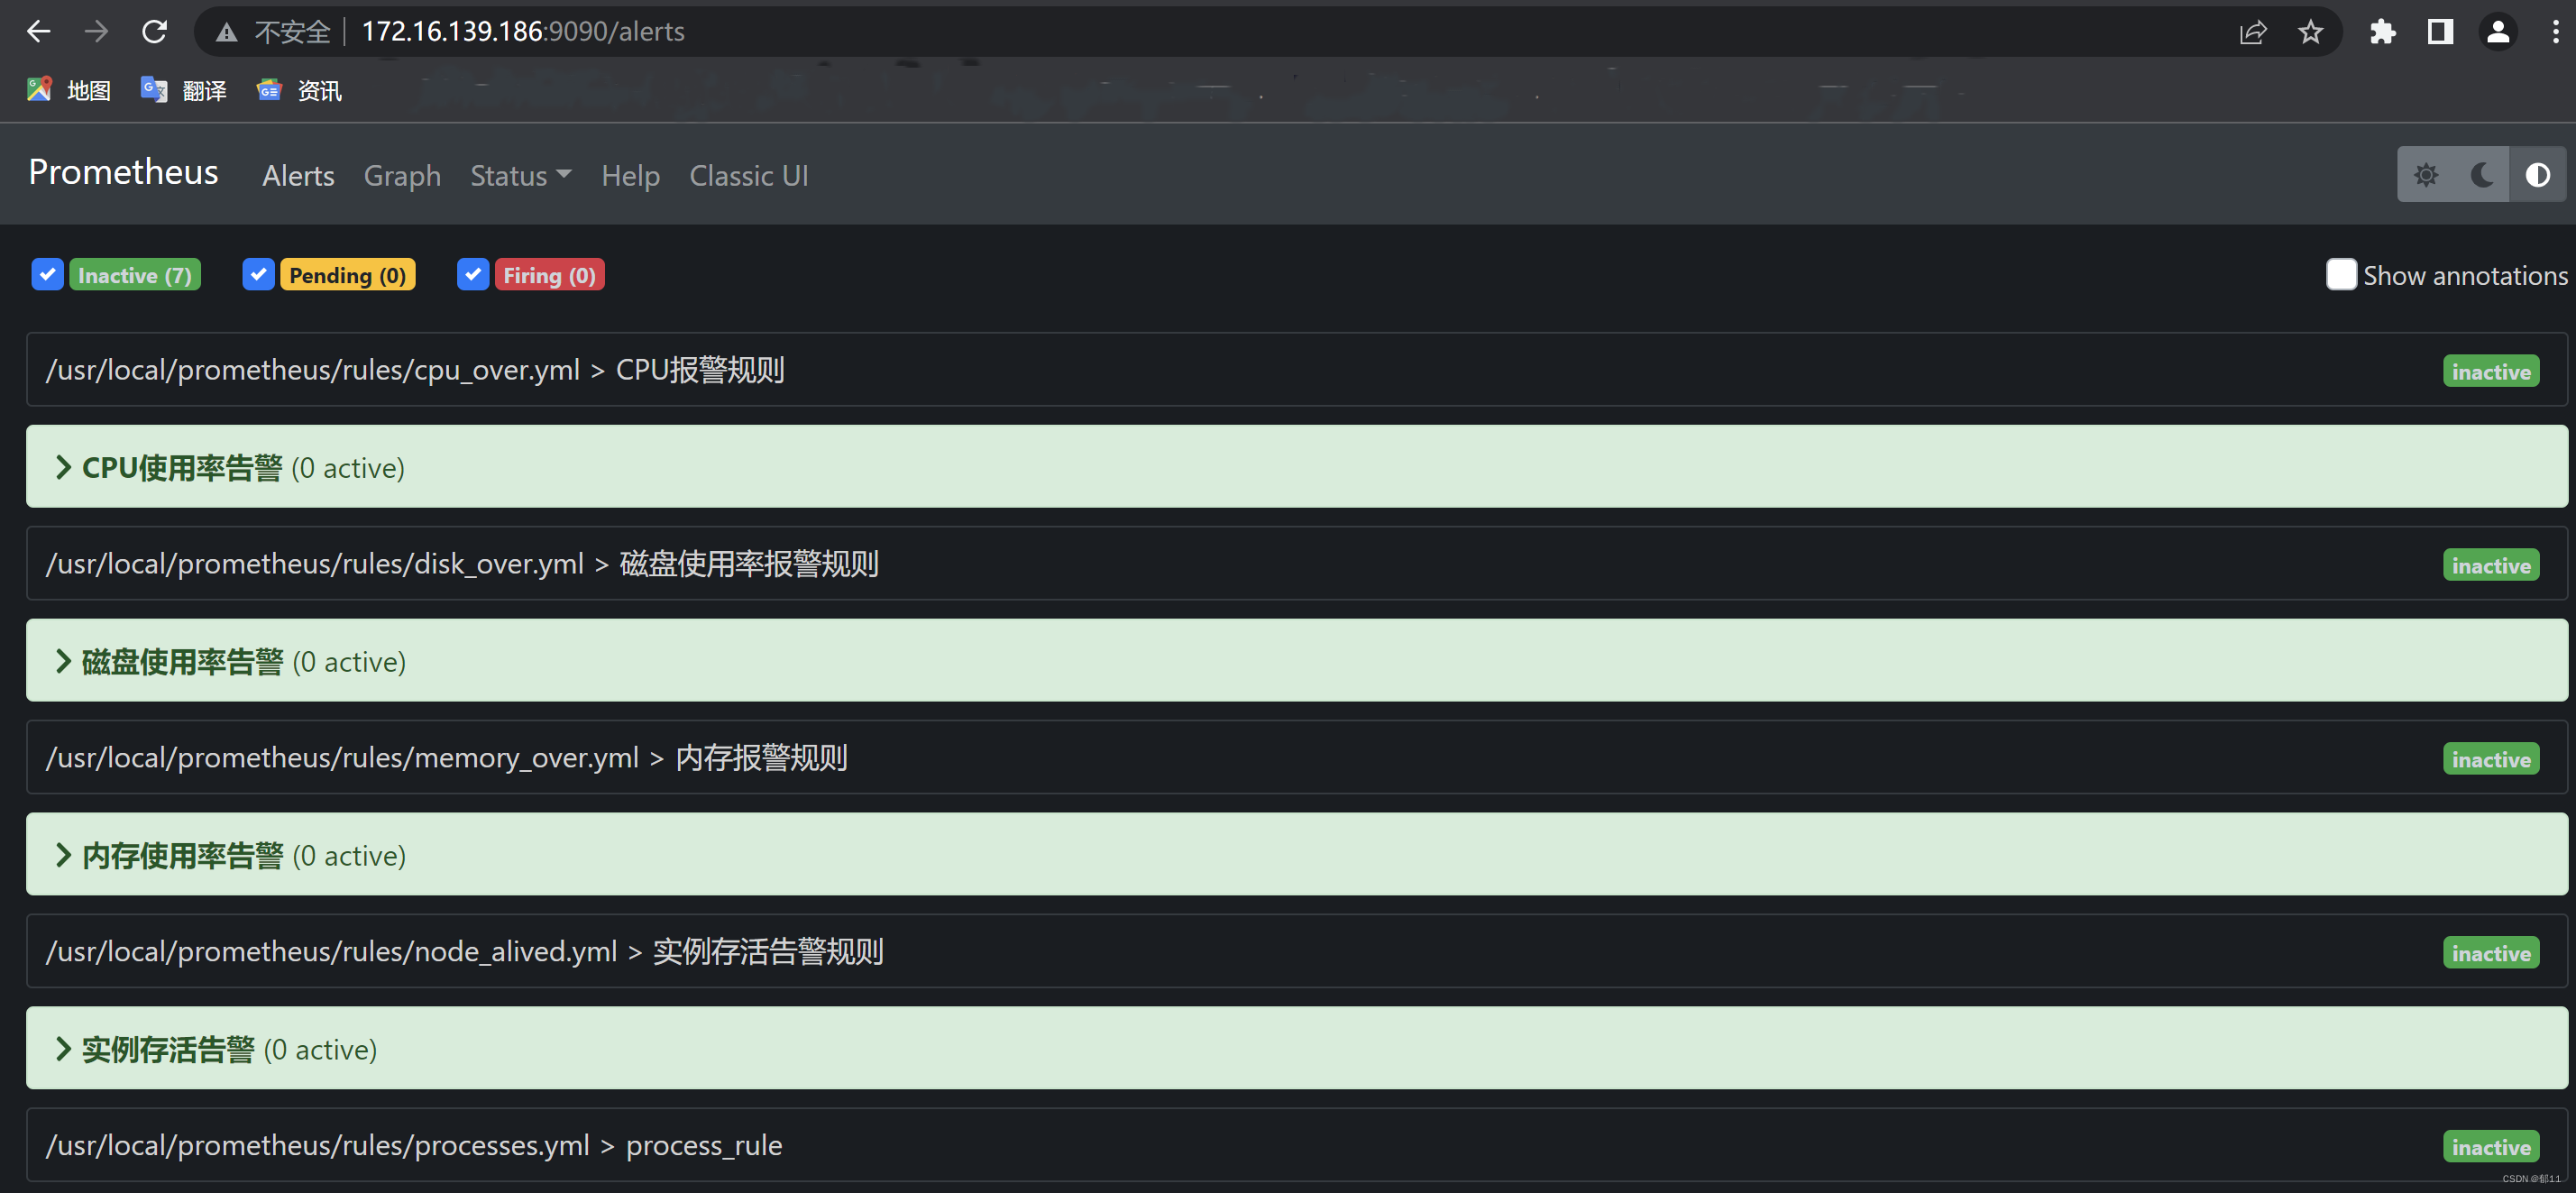
5、配置告警规则
[root@172-16-139-186 1-prometheus]#mkdir /usr/local/prometheus/rules
[root@172-16-139-186 1-prometheus]#vim /usr/local/prometheus/rules/node_alived.yml 实例存活告警
[root@172-16-139-186 1-prometheus]#vim /usr/local/prometheus/rules/memory_over.yml 内存报警规则
[root@172-16-139-186 1-prometheus]#vim /usr/local/prometheus/rules/cpu_over.yml CPU报警
[root@172-16-139-186 1-prometheus]#vim /usr/local/prometheus/rules/disk_over.yml 磁盘使用率报警
[root@172-16-139-186 1-prometheus]#curl -X POST http://172.16.139.186:9090/-/reload 热加载配置
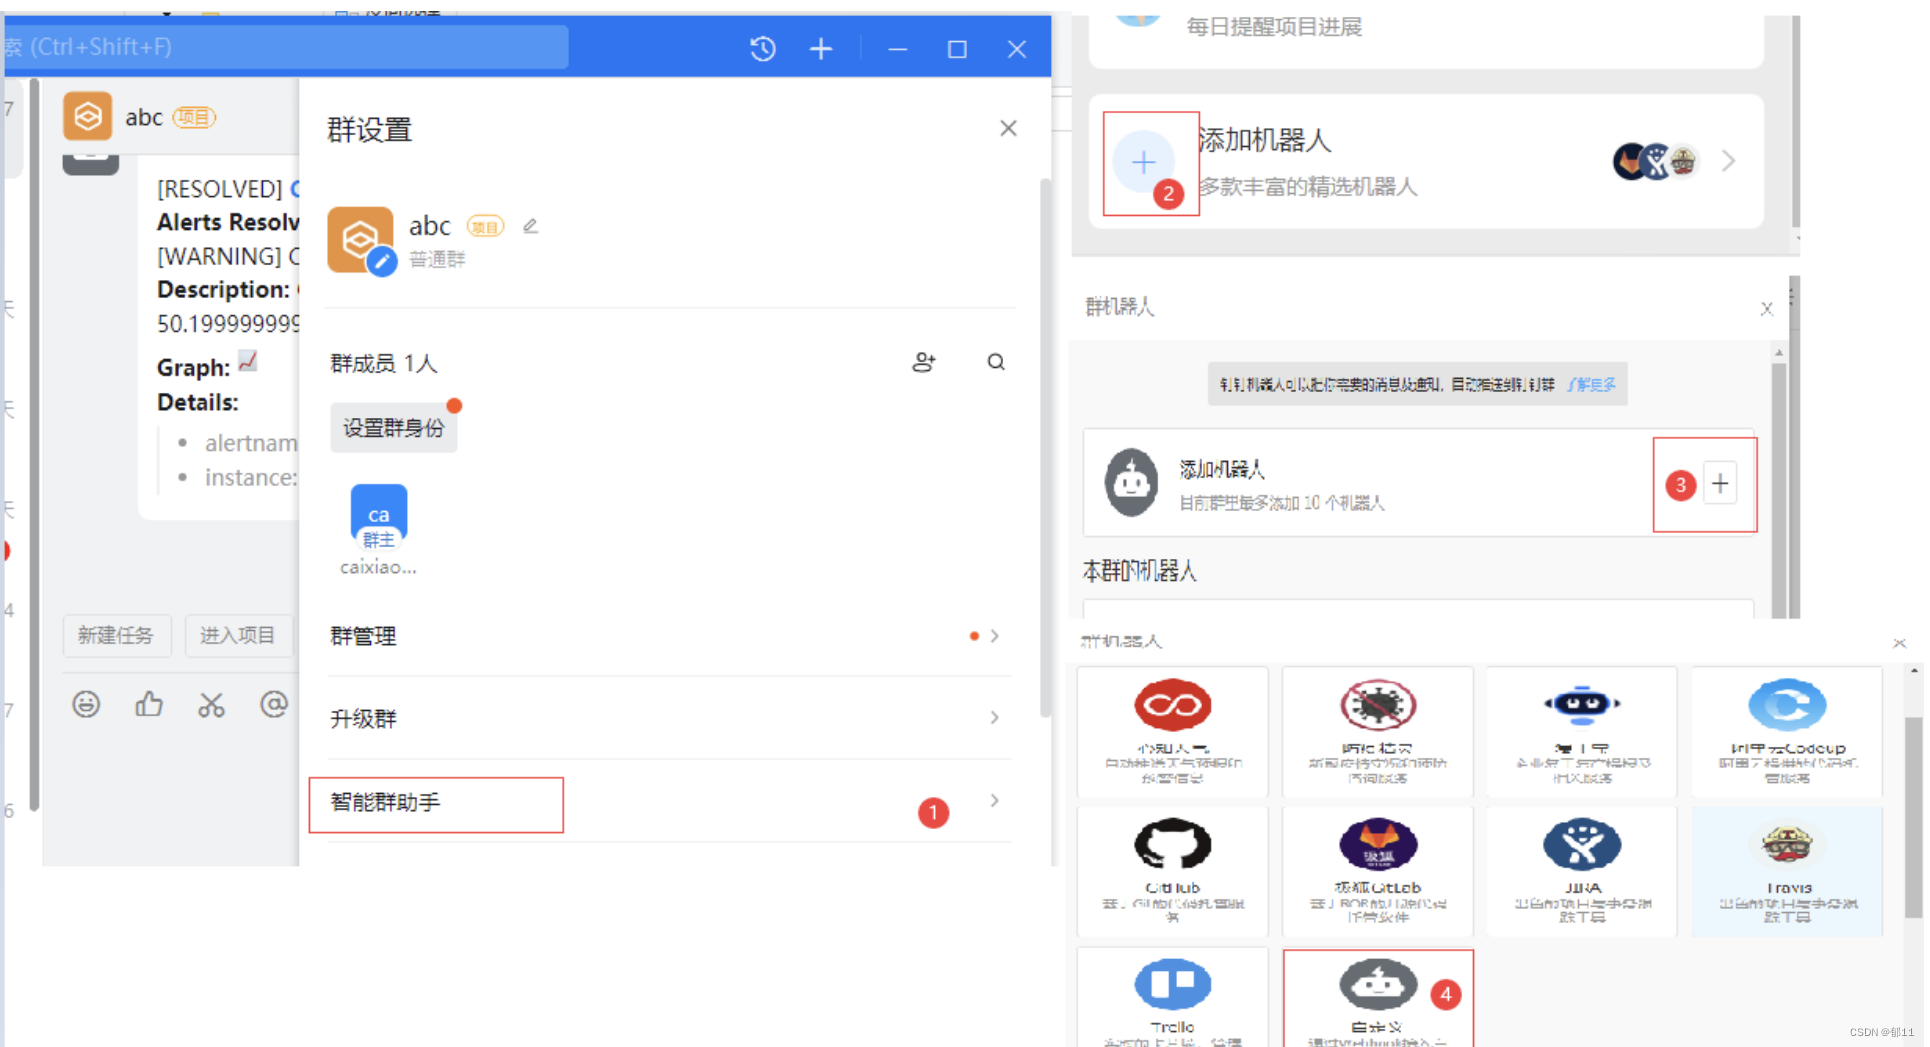
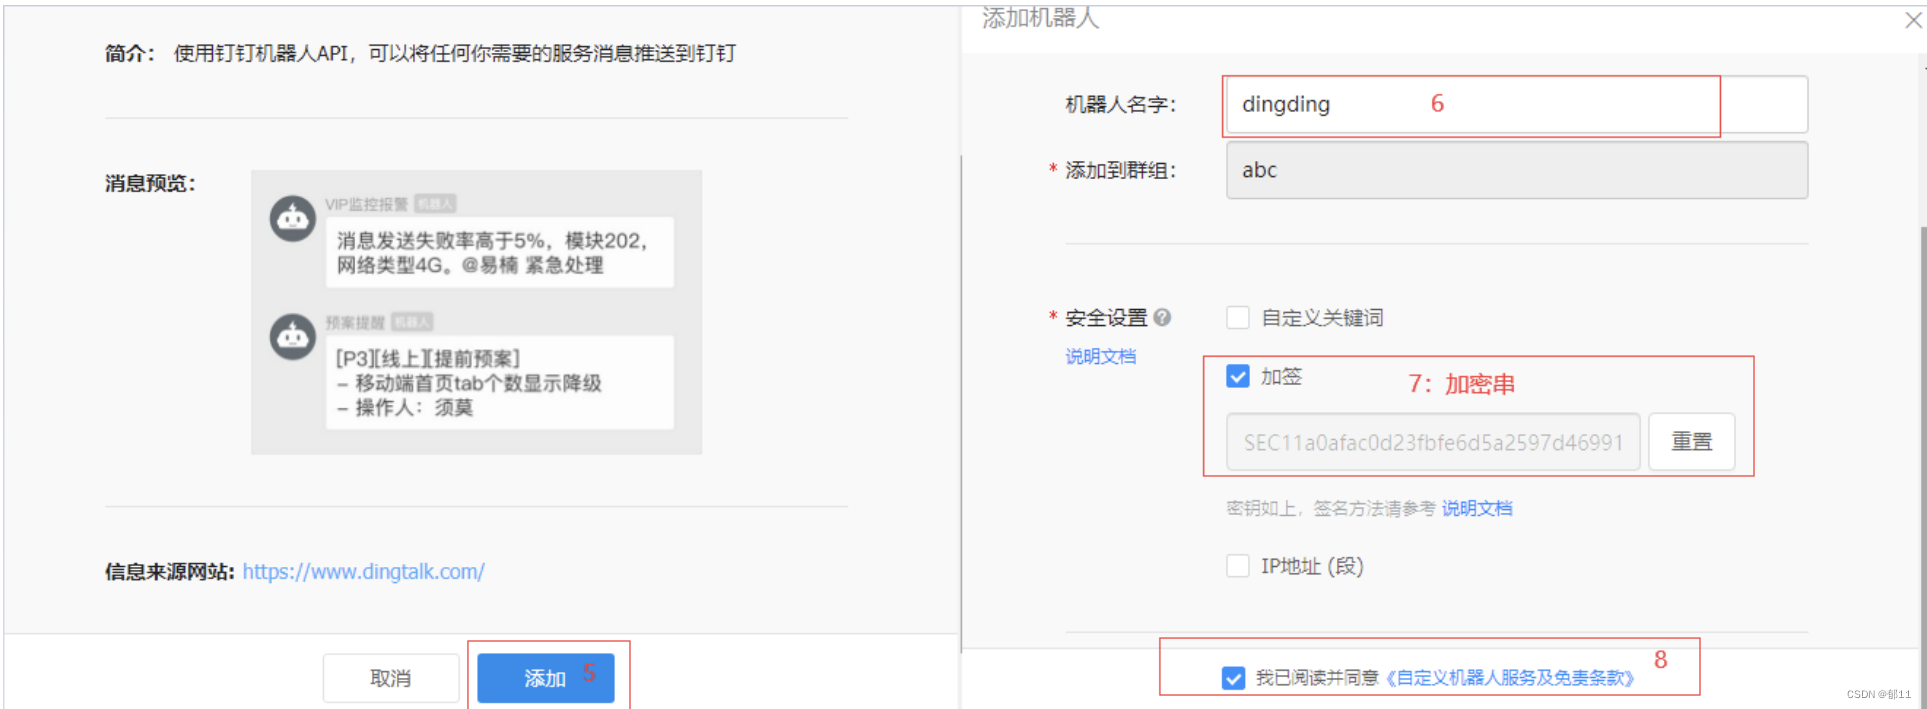
6、创建钉钉机器人
7、安装钉钉插件并修改
[root@172-16-139-186 1-prometheus]#tar -zxf /root/prometheus-webhook-dingtalk-1.4.0.linux-amd64.tar.gz -C /usr/local/
[root@172-16-139-186 1-prometheus]#mv /usr/local/prometheus-webhook-dingtalk-1.4.0.linux-amd64 /usr/local/ding
[root@172-16-139-186 1-prometheus]#cp config.example.yml conf.yml 拷贝模板文件
[root@172-16-139-186 1-prometheus]#vim conf.yml
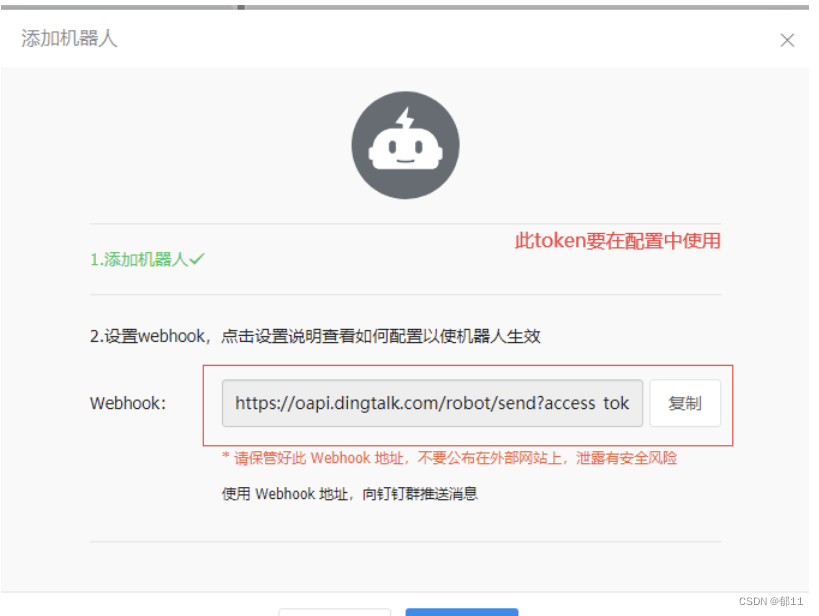
targets:
webhook1:
url: webhook地址 #(复制创建钉钉那个Token)
secret: 加密串
[root@172-16-139-186 1-prometheus]#vim /usr/local/prometheus/prometheus.yml

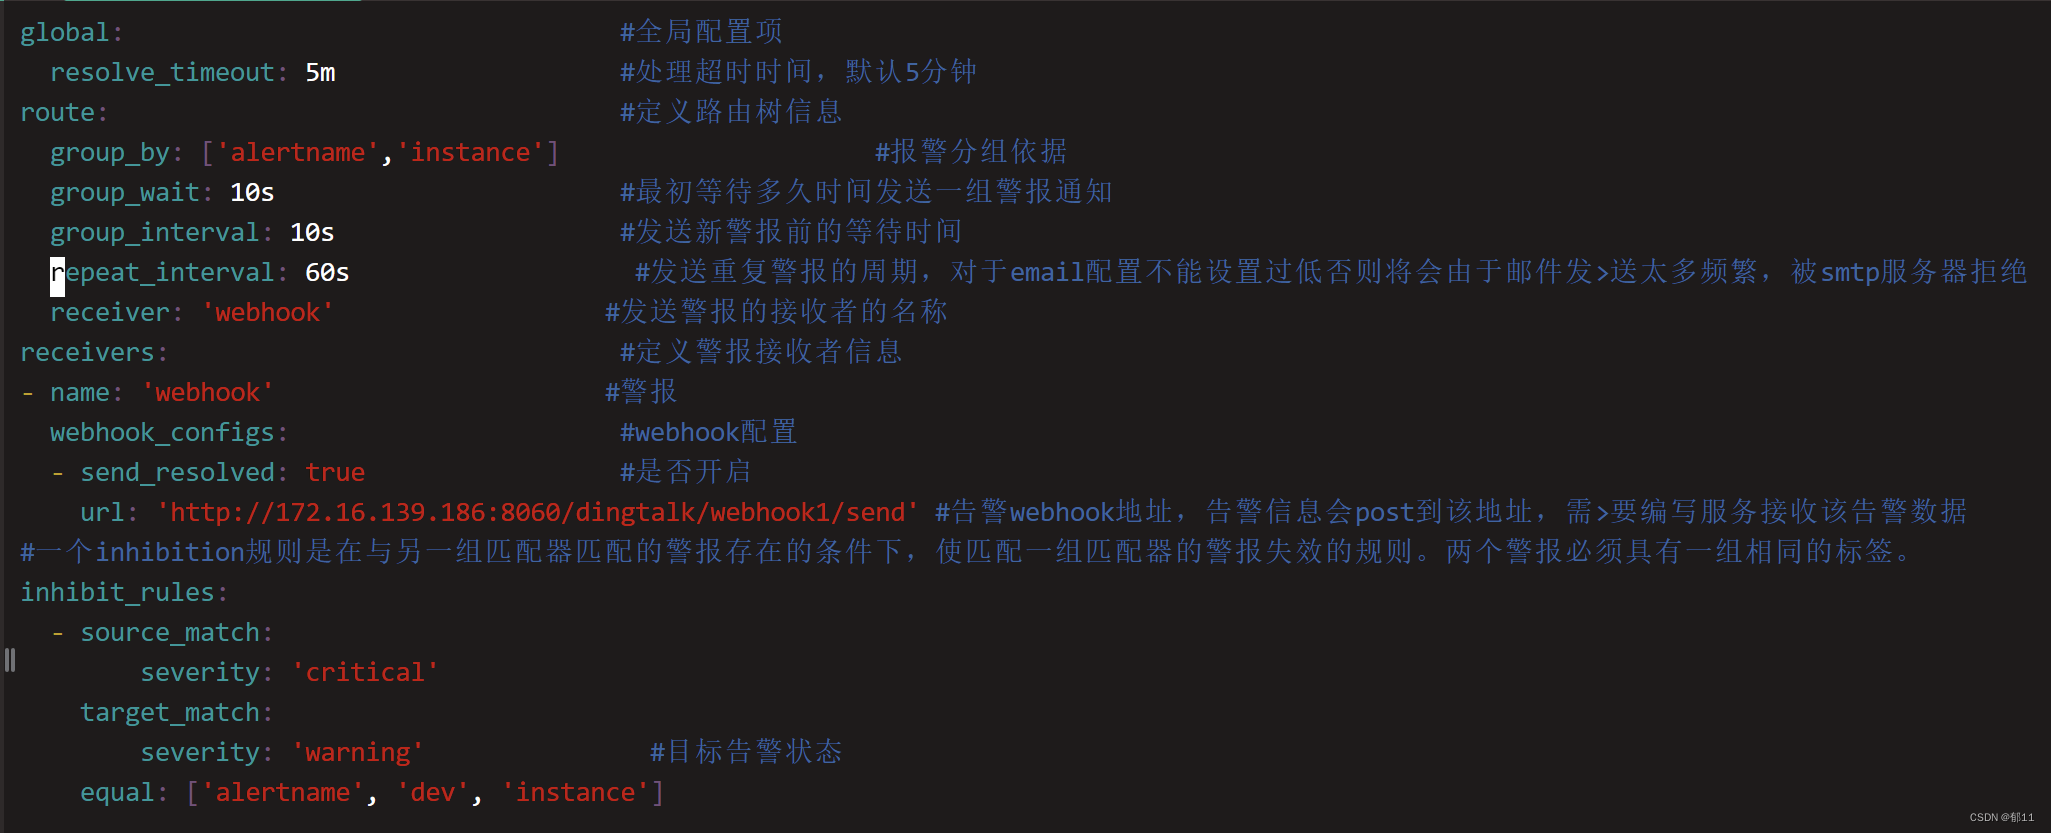
[root@172-16-139-186 1-prometheus]#vim /usr/local/alertmanager/alertmanager.yml
[root@172-16-139-186 1-prometheus]#systemctl restart alertmanager.service
[root@172-16-139-186 1-prometheus]#nohup ./prometheus-webhook-dingtalk --config.file="conf.yml" 2>&1 1>dingding.log & 启动程序后台运行退出终端不影响
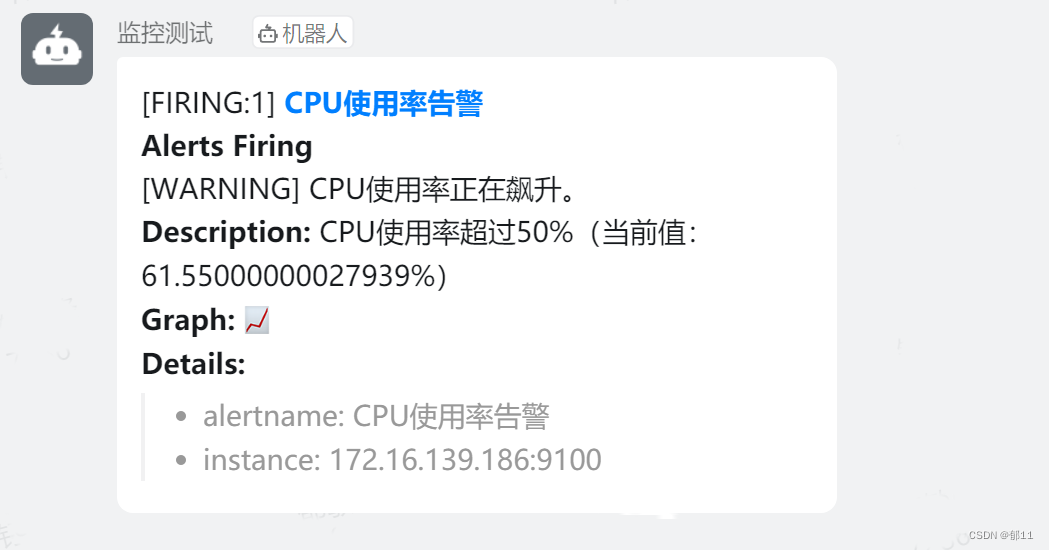
[root@172-16-139-186 1-prometheus]#dd if=/dev/zero of=/dev/null 模拟提升CPU使用率,达到报警效果


 1万+
1万+


 被折叠的 条评论
为什么被折叠?
被折叠的 条评论
为什么被折叠?
 到【灌水乐园】发言


