


 这段代码展示了如何利用Python的pandas和matplotlib库读取Excel数据并绘制英超球员射门次数的柱状图。通过设置参数,解决了中文显示问题,并对x轴标签进行了旋转,以便清晰展示球员名字。最终生成的图表直观地展现了每位球员的射门数。
导入英超射手榜数据
import pandas as pd #导入pandas模块
import matplotlib.pyplot as plt
#解决数据输出时列名不对齐的问题
pd.set_option('display.unicode.east_asian_width', True)
df=pd.read_excel('data.xlsx') #读取Excel文件
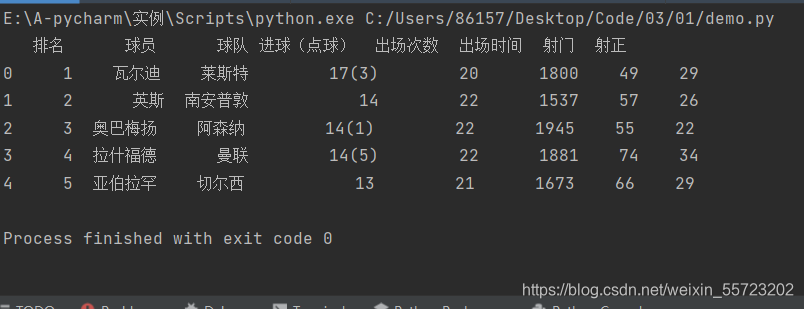
print(df.head()) #显数据——默认显示5条
plt.rcParams['font.sans-serif']=['SimHei'] #解决中文乱码
x = df['球员']
height = df['射门']
plt.grid(axis="y",which="major") #生成网格
plt.xlabel('球员')
plt.ylabel('射门')
plt.bar(x,height,width=0.6,align='center',color='b',alpha=0.8)
for a,b in zip(x,height):
plt.text(a,b,format(b,','),ha='center',va='bottom',fontsize=9,color='b',alpha=0.9)
plt.title('球员射门数')
plt.legend(['射门数'])
plt.xticks(x)
plt.xticks(rotation=90) #旋转x轴文本标签的方向
plt.show()默认显示5条信息如下:
代码运行——绘制的柱状图如下: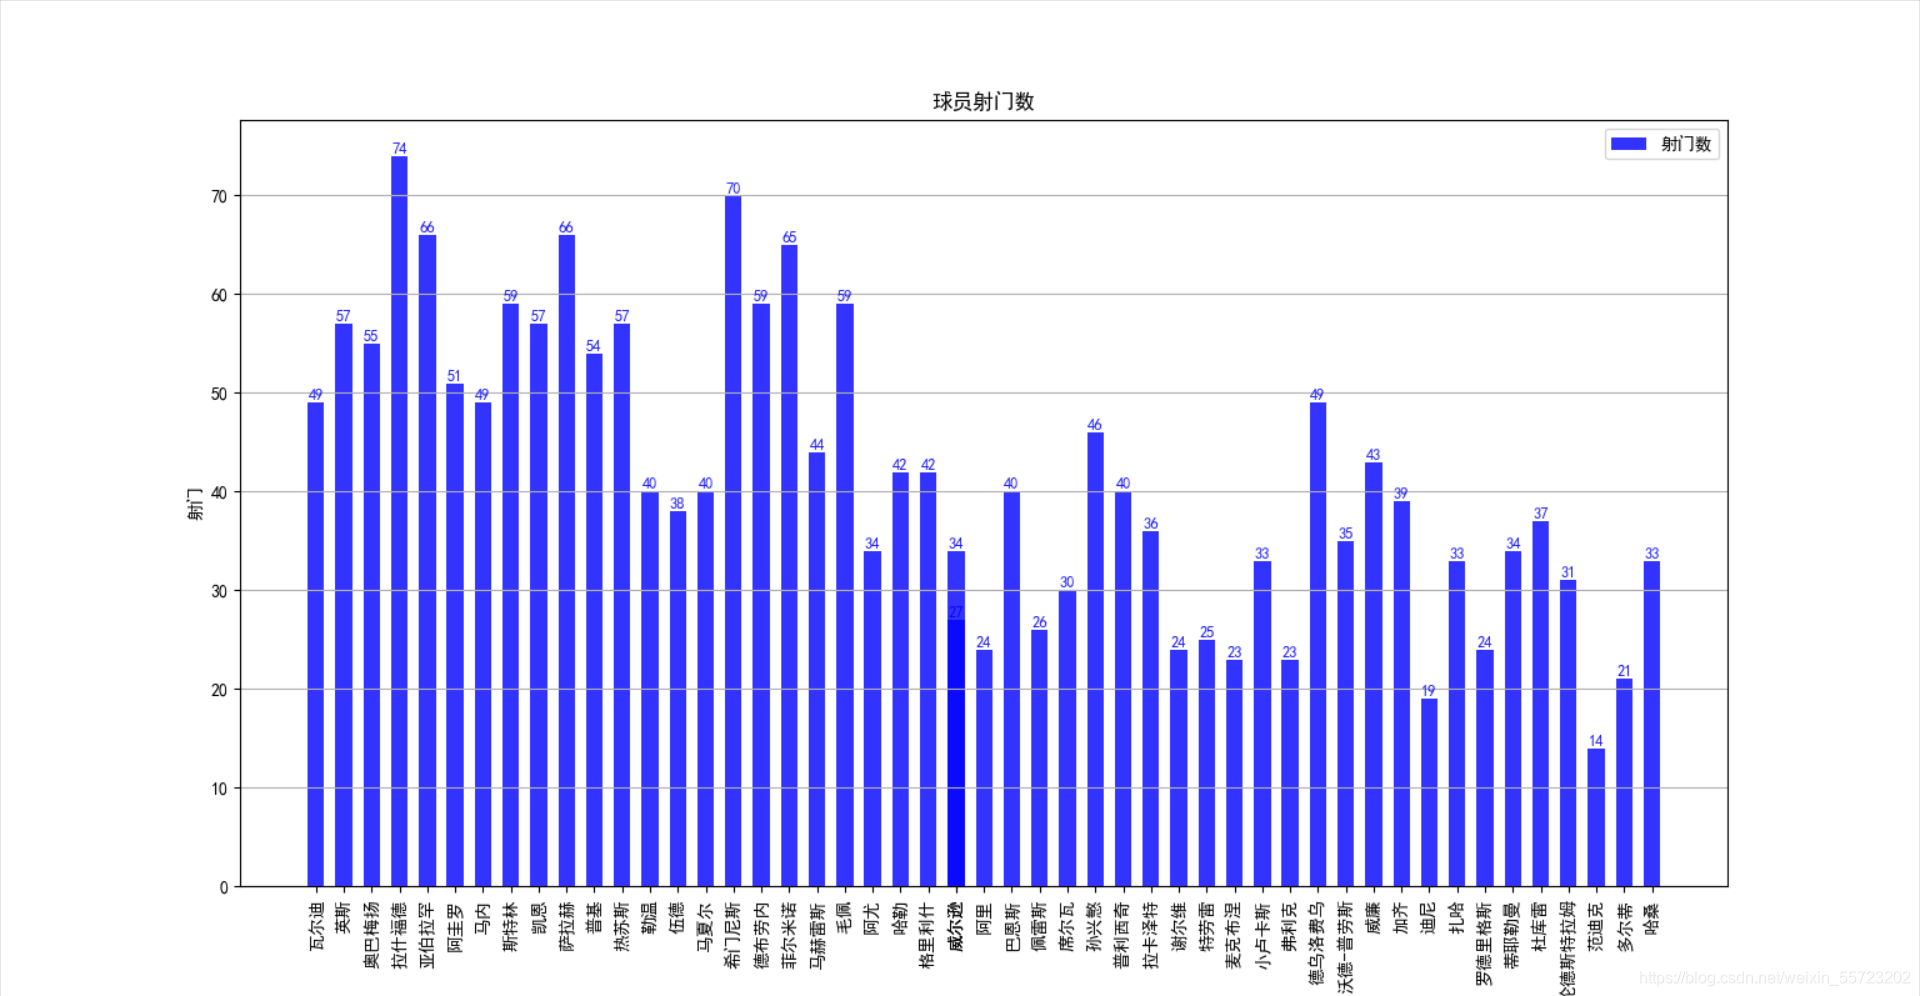
(由于数量较多,图片需放大后可显示完整)


 1195
1195

 被折叠的 条评论
为什么被折叠?
被折叠的 条评论
为什么被折叠?
 到【灌水乐园】发言


