1.页面框架
<template>
<div>
<header>
<h1>赣州房价分析平台</h1>
</header>
<!-- 大容器 -->
<section class="container">
<!-- 左容器 -->
<section class="itemLeft">
<TopTenPage>
<ItemOne/>
</TopTenPage>
<PiePage>
<ItemTwo/>
</PiePage>
</section>
<!-- 中容器 -->
<section class="itemCenter">
<TimePage/>
<CenterBottom>
<MapPage/>
</CenterBottom>
</section>
<!-- 右容器 -->
<section class="itemRight">
<ItemPage>
<ItemThree/>
</ItemPage>
<ItemPage>
<ItemFour/>
</ItemPage>
</section>
</section>
</div>
</template>
<script>
import ItemPage from "@/components/itemPage.vue"
import PiePage from "@/components/piePage.vue"
import TopTenPage from "@/components/topTenPage.vue"
import TimePage from "@/components/timePage.vue"
import CenterBottom from "@/components/centerBottom.vue"
import MapPage from "@/components/mapPage.vue"
import LinePage from "@/components/linePage.vue"
import ItemOne from "@/components/itemOne.vue"
import ItemTwo from "@/components/itemTwo.vue"
import ItemThree from "@/components/itemThree.vue"
import ItemFour from "@/components/itemFour.vue"
import MainPage from "@/components/views/main/mainPage.vue"
export default {
name: 'homePage',
data() {
return {
};
},
components:{
ItemPage,
PiePage,
TopTenPage,
TimePage,
CenterBottom,
MapPage,
ItemOne,
ItemTwo,
ItemThree,
ItemFour,
LinePage,
MainPage
},
computed:{
},
methods: {
},
};
</script>
<style lang="less" scoped>
header{
height: 1rem;
width: 100%;
margin: .625rem 0;
background: url("~@/assets/headerbg.png");
h1{
font-size: .625rem;
color: #fff;
text-align: center;
line-height: 1rem;
}
}
.container{
min-width: 1200px;
max-width: 2048px;
margin: 0 auto;
padding: .125rem .125rem 0;
display: flex;
.itemLeft,.itemRight{
flex: 3.5;
}
.itemCenter{
flex: 4;
height: 10.5rpx;
padding: 0.125rem;
margin: .25rem;
}
}
</style>
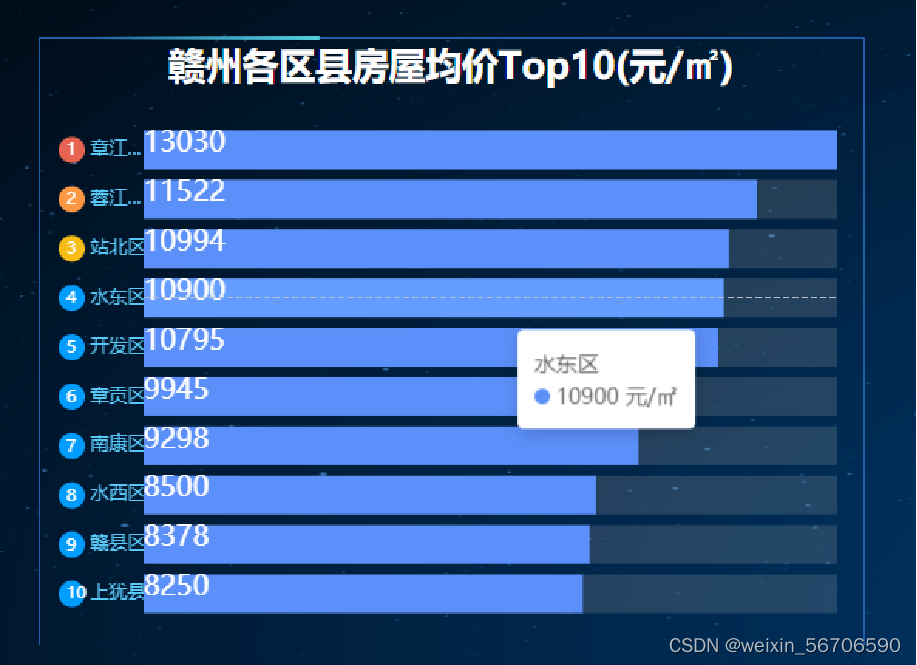
2.柱状图
<template>
<div>
<dv-border-box-8 style="height:100% width:100%">
<h2>赣州各区县房屋均价Top10(元/㎡)</h2>
<div class="chart" id="topten">
</div>
</dv-border-box-8>
</div>
</template>
<script>
import Border from "@/components/border.vue"
import axios from "axios";
export default {
name: "",
data() {
return {
price: [],
xprice: [],
district: []
};
},
components: {},
computed: {},
methods: {
myEcharts() {
let _this = this;
var myChart = this.$echarts.init(document.getElementById("topten"));
var option;
axios.get("https://4o977191w3.goho.co/rank").then(
res => {
console.log(res.data.data.rank[0]);
console.log(res);
let ydata = res.data.data.rank[0].ydata;
let xdata = res.data.data.rank[0].xdata;
option = {
tooltip: {
trigger: "axis",
formatter(params){
return '<div><p>'+params[0].name+'<br/>'+params[0].marker+params[0].value+' 元/㎡</p></div>'
}
},
grid: {
left: "70",
right: "20",
bottom: "20",
top: "20",
containLabel: false
},
xAxis: {
type: "value",
show: false,
max: "dataMax"
},
yAxis: {
type: "category",
data: ydata,
inverse: true,
axisLine: {
show: false
},
axisTick: {
show: false
},
axisLabel: {
margin: 55,
width: 60,
align: "left",
overflow: "truncate",
formatter: function(value, index) {
let ind = index + 1;
if (ind + 9 == ydata.length) {
return "{one|" + (index + 1) + "} {a|" + value + "}";
} else if (ind + 8 == ydata.length) {
return "{two|" + (index + 1) + "} {b|" + value + "}";
} else if (ind + 7 == ydata.length) {
return "{three|" + (index + 1) + "} {c|" + value + "}";
}
if (ydata - index < 8) {
return "{five|" + (index + 1) + "} {d|" + value + "}";
}
return "{four|" + (index + 1) + "} {d|" + value + "}";
},
rich: {
a: {
color: "#59c9f9"
},
b: {
color: "#59c9f9"
},
c: {
color: "#59c9f9"
},
d: {
color: "#59c9f9"
},
one: {
backgroundColor: "#E86452",
color: "white",
width: 12,
height: 16,
padding: [1, 0, 0, 5],
borderRadius: 10,
fontSize: 11
},
two: {
backgroundColor: "#FF9845",
color: "white",
width: 12,
height: 16,
padding: [1, 0, 0, 5],
borderRadius: 10,
fontSize: 11
},
three: {
backgroundColor: "#F6BD16",
color: "white",
width: 12,
height: 16,
padding: [1, 0, 0, 5],
borderRadius: 10,
fontSize: 11
},
four: {
backgroundColor: "#009dff",
color: "white",
width: 12,
height: 16,
padding: [1, 0, 0, 5],
borderRadius: 10,
fontSize: 11
},
five: {
backgroundColor: "#009dff",
color: "white",
width: 16,
height: 16,
padding: [1, 0, 0, 1],
borderRadius: 10,
fontSize: 13
}
}
}
},
series: [
{
type: "bar",
showBackground: true,
realtimeSort: true,
label: {
show: true,
position: "center",
color: "#fff",
fontSize: 18
},
barWidth: 25,
itemStyle: {
color: "#5B8FF9"
},
data: xdata
}
]
};
myChart.setOption(option);
},
res => {
console.log("error");
}
);
}
},
mounted() {
this.myEcharts();
}
};
</script>
<style lang='less' scoped>
h2 {
height: 0.5rem;
color: #fff;
line-height: 0.5rem;
font-size: 0.3rem;
text-align: center;
}
.chart {
height: 4.5rem;
}
</style>
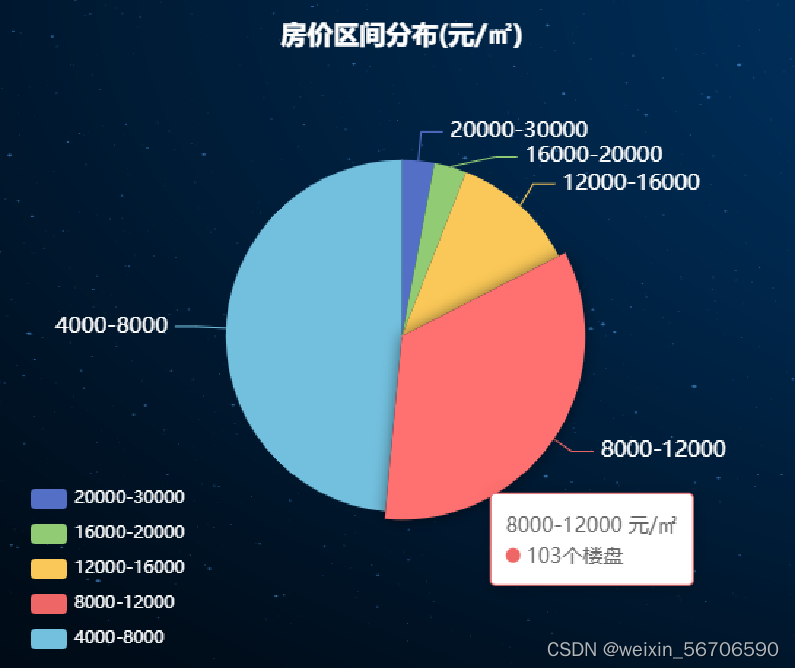
3.饼状图
<template>
<div class="box" id="piechart">
<!-- <h2>hhhhh</h2> -->
</div>
</template>
<script>
import axios from "axios";
export default {
name: "",
data() {
return {};
},
components: {},
computed: {},
mounted() {
this.myEcharts();
},
methods: {
myEcharts() {
var chartDom = document.getElementById("piechart");
var myChart = this.$echarts.init(chartDom);
var option;
axios.get("https://4o977191w3.goho.co/count").then(
res => {
console.log(res);
let count = res.data.data.data;
option = {
title: {
text: "房价区间分布(元/㎡)",
left: "center",
textStyle:{
color:"#fff"
}
},
tooltip: {
trigger: "item",
formatter(params){
return '<div><p>'+params.name+' 元/㎡ '+'<br/>'+params.marker+params.value+'个楼盘</p></div>'
}
},
legend: {
orient: "vertical",
left: "left",
top:"bottom",
textStyle:{
color:"#fff"
}
},
series: [
{
name: "房价区间分布(元/㎡)",
type: "pie",
radius: "55%",
data: count,
label:{
color:"#fff",
fontSize:15
},
labelLine:{
show:true,
length:40,
length:20
},
emphasis: {
itemStyle: {
shadowBlur: 10,
shadowOffsetX: 0,
shadowColor: "rgba(0, 0, 0, 0.5)"
}
}
}
]
};
myChart.setOption(option);
},
res => {
console.log("error");
}
);
}
}
};
</script>
<style lang='less' scoped>
.box {
width: 6.5rem;
height: 5.5rem;
}
</style>
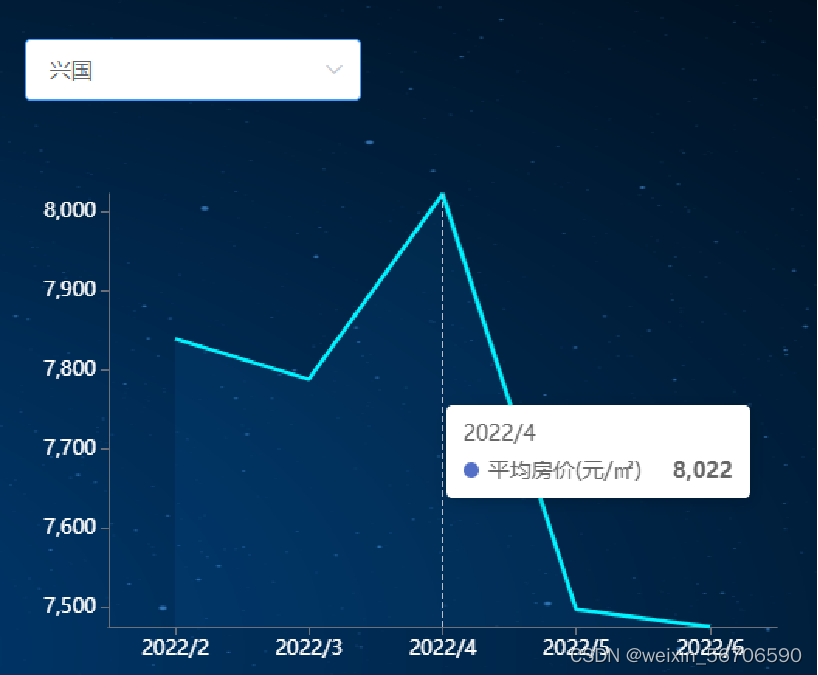
4.折线图
<template>
<div id="chart">
<!-- <h3>{{ Title }}</h3> -->
<el-select v-model="value" placeholder="切换地区" @change="onchange" >
<el-option v-for="item in options" :key="item.value" :label="item.label" :value="item.value"></el-option>
</el-select>
<div ref="myChart3" id="myChart3" style="height:100%;width:100%;"></div>
</div>
</template>
<script>
import axios from "axios";
import MenuPage from "@/components/menuPage.vue";
import LinePage from "@/components/linePage.vue";
export default {
name: "",
data() {
return {
value: "",
datas: [
],
seltValue: [
],
options: [
{
value: "0",
label: "赣州"
},
{
value: "1",
label: "上犹"
},
{
value: "2",
label: "于都"
},
{
value: "3",
label: "会昌"
},
{
value: "4",
label: "信丰"
},
{
value: "5",
label: "全南"
},
{
value: "6",
label: "兴国"
},
{
value: "7",
label: "南康"
},
{
value: "8",
label: "大余"
},
{
value: "9",
label: "宁都"
},
{
value: "10",
label: "定南"
},
{
value: "11",
label: "寻乌"
},
{
value: "12",
label: "崇义"
},
{
value: "13",
label: "开发区"
},
{
value: "14",
label: "瑞金"
},
{
value: "15",
label: "石城"
},
{
value: "16",
label: "站北"
},
{
value: "17",
label: "章江新区"
},
{
value: "18",
label: "章贡"
},
{
value: "19",
label: "赣县"
},
{
value: "20",
label: "龙南"
}
]
};
},
methods: {
onchange(value) {
this.datas.map((item, index) => {
if (index == value) {
this.downSelect(this.seltValue[index]);
}
});
},
downSelect(seltValue) {
console.log(seltValue);
let myChart3 = this.$echarts.init(document.getElementById("myChart3"));
var lineStyle = {
normal: {
width: 1,
opacity: 0.5
}
};
axios.get("https://4o977191w3.goho.co/line").then(
res => {
console.log(res);
this.datas = res.data.data;
this.seltValue = res.data.data;
myChart3.setOption({
xAxis: {
type: "category",
data: ["2022/2", "2022/3", "2022/4", "2022/5", "2022/6"],
axisTick: {
alignWithLabel: true
},
axisLabel: {
color: "#fff",
fontSize: 13
}
},
yAxis: {
type: "value",
max: "dataMax",
min: "dataMin",
axisTick: {
alignWithLabel: true,
show:true
},
axisLine: {
show: true
},
axisLabel: {
color: "#fff",
fontSize: 13,
shouw:true
},
splitLine: {
show: false
}
},
tooltip: {
show:true,
trigger: "axis",
showContent:true,
},
series: [
{
name: "平均房价(元/㎡)",
type: "line",
silent: true,
axisLabel: {
color: "#fff"
},
lineStyle: {
normal: {
type: "solid",
color: "#00ddff",
width: 2.5,
opacity: 1
}
},
data: seltValue,
itemStyle: {
normal: {
opacity: 0
}
},
areaStyle: {
normal: {
color: "#0d6dba",
opacity: 0.1
}
}
}
]
});
},
res => {
console.log("error");
}
);
}
},
mounted() {
this.downSelect(this.seltValue[0]);
}
};
</script>
<style lang='less' scoped>
#chart {
height: 5.125rem;
}
</style>
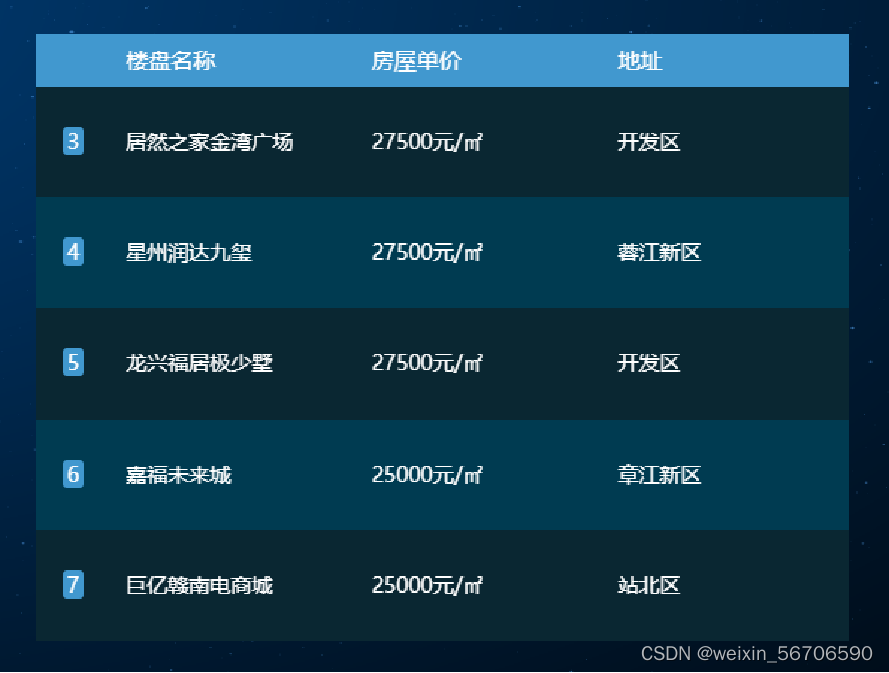
5.轮播表格
<template>
<div class="box">
<dv-scroll-board :config="config" style="width:100%;height:100%" />
</div>
</template>
<script>
import axios from "axios";
export default {
name: '',
data() {
return {
config:{
header: ['楼盘名称', '地址', '房屋单价(元/㎡)'],
headerBGC :"rgb(65, 152, 207)",
data: [],
index: true,
columnWidth: [50],
align: ['center']
}
}
},
components:{
},
mounted(){
this.getData();
},
methods: {
getData(){
axios.get('https://4o977191w3.goho.co/all').then(res => {
console.log(res)
console.log(res.data.data.data[155])
this.config={
header: ['楼盘名称', '房屋单价', '地址'],
headerBGC :"rgb(65, 152, 207)",
data: res.data.data.data,
index: true,
columnWidth: [50],
align: ['center'],
waitTime:1500,
indexHeader:''
}
}, res => {
console.log("error");
});
}
},
};
</script>
<style lang='less' scoped>
.box {
width: 100%;
height: 100%;
}
</style>
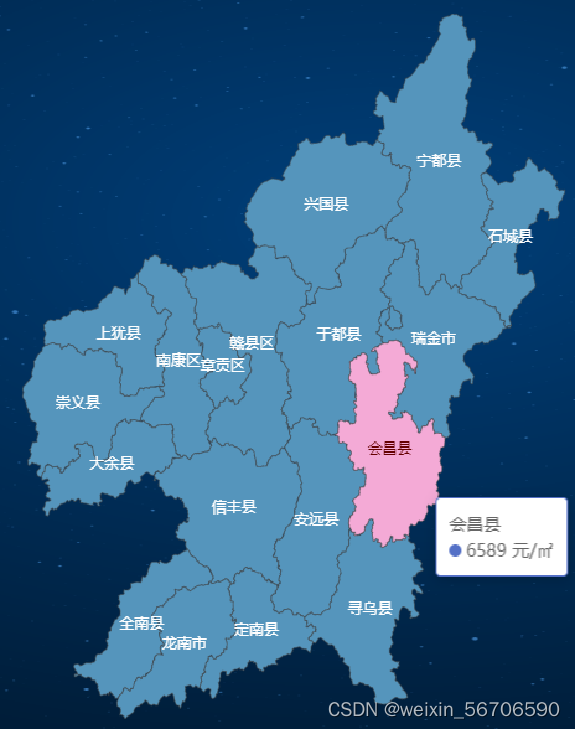
6.地图
<template>
<div class="item">
<div ref="map" style="width:100%;height:100%;"></div>
</div>
</template>
<script>
import axios from "axios";
import gzMap from "@/assets/ganzhou.json";
export default {
data() {
return {
data: ""
};
},
mounted() {
this.init();
},
methods: {
init() {
var myChart = this.$echarts.init(this.$refs.map);
this.$echarts.registerMap("ganzhou", gzMap);
axios.get('https://4o977191w3.goho.co/map').then(res => {
console.log(res)
var option = {
title: {
left: "left",
textStyle: {
fontSize: 25,
color: "#fff"
}
},
tooltip: {
trigger: "item",
enterable: true,
formatter: function(params) {
return '<div><p>'+params.name+'<br/>'+params.marker+params.value+' 元/㎡</p></div>'
}
},
series: [
{
name:'房价地图',
type: "map",
map: "ganzhou",
zoom: "1.25",
data: res.data.data,
label: {
show: "true",
textStyle: {
color: "#fff"
}
},
itemStyle: {
normal: {
areaColor: "#5595bc"
},
emphasis: {
areaColor: "#f4aad6",
}
}
}
]
};
myChart.setOption(option);
}, res => {
console.log("error");
});
}
}
};
</script>
<style lang="less" scoped>
.item {
height: 7.125rem;
margin-top: .625rem;
}
</style>


 2565
2565

 被折叠的 条评论
为什么被折叠?
被折叠的 条评论
为什么被折叠?
 到【灌水乐园】发言


