


 需求开发一个图表在小程序里面 这是ui图
下图是我做的遇到的问题
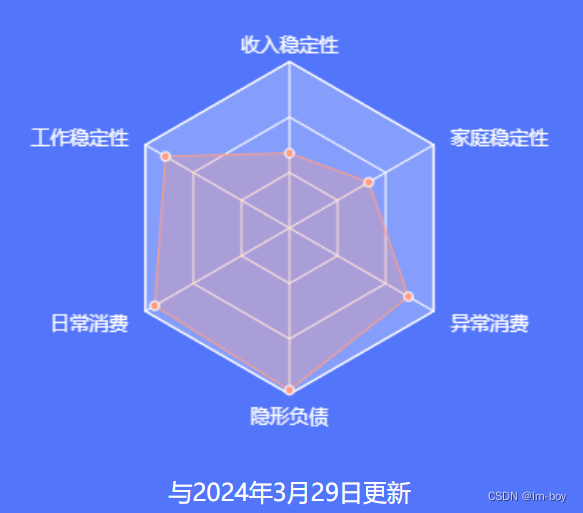
一、用的雷达图 我想在雷达区域设置白色背景色但是我没设置成功 只好添加了一条满值的数据来充当白色区域背景
二、因为UI图白色背景区域是没有点与点之间的链接线的但是我无法单独的把连接线取消
三、内容区域的用了渐变颜色,但是看着颜色也不对来着是因为我的底色不对么。
下面是图表的配置参数有没有大佬懂的告知一下感谢了
    uChartsInstance[id] = new uCharts({
        type: "radar",
        context: ctx,
        width: cWidth.value,
        height: cHeight.value,
        categories: data.categories,
        series: data.series,
        animation: true,
        timing: "easeOut",
        duration: 1000,
        rotate: false,
        rotateLock: false,
        padding: [5, 5, 5, 5],
        fontSize: 13,
        fontColor: "#FFFFFF",
        dataLabel: false,
        touchMoveLimit: 60,
        enableScroll: false,
        enableMarkLine: true,
        legend: {
            show: false,
            position: "right",
            lineHeight: 25,
            float: "center",
            padding: 5,
            margin: 5,
            fontSize: 13,
            fontColor: "#666666",
            hiddenColor: "#CECECE",
            itemGap: 10
        },

        extra: {
            radar: {
                gridType: "radar",
                gridColor: "#FFFFFF",
                gridCount: 3,
                opacity: 0.3,
                max: 200,
                labelShow: true,
                gridEval: 1,
                radius: 0,
                axisLabelTofix: 0,
                labelColor: "#FFFFFF",
                border: true,
                labelPointShow: false,
                labelPointRadius: 3,
                labelPointColor: "#FFFFFF",
                borderWidth: 1,
                linearType: "none", //custom,
            },
            tooltip: {
                showBox: false,
            }
        },

    });


 2029
2029


 被折叠的 条评论
为什么被折叠?
被折叠的 条评论
为什么被折叠?
 到【灌水乐园】发言


