


在Prometheus的报警系统中,是分为2个部分的,规则是配置在prometheus中的, prometheus组件完成报警推送给alertmanager的, alertmanager然后管理这些报警信息,包括静默、抑制、聚合和通过电子邮件、on-call通知系统和聊天平台等方法发送通知。
主要步骤如下
安装和部署alertmanager
在prometheus中配置alertmanager的地址信息。
在prometheus中设置报警规则
在alertmanager配置接受者信息等
安装alertmanager
下载AlertmanagerPrometheus官网
[root@prometheus ~]# tar zxvf alertmanager-0.25.0.linux-amd64.tar.gz
[root@prometheus ~]# mv alertmanager-0.25.0.linux-amd64 /usr/local/prometheus/alertrmanager

配置系统启动脚本
[root@prometheus ~]# vim /usr/lib/systemd/system/alertmanager.service
[Unit]
Description=alertmanager
Documentation=https://prometheus.io/
After=network.target

[Service]
User=prometheus
Group=prometheus
ExecStart=/usr/local/prometheus/alertmanager/alertmanager --config.file=/usr/local/prometheus/alertmanager/alertmanager.yml --storage.path=/usr/local/prometheus/alertmanager/data
Restart=on-failure

[Install]
WantedBy=multi-user.target

[root@prometheus ~]# systemctl daemon-reload

[root@prometheus ~]# useradd -M -s /sbin/nologin prometheus
[root@prometheus ~]# chown prometheus:prometheus /usr/local/prometheus/alertmanager -R
[root@prometheus ~]# systemctl enable alertmanager.service --now
[root@prometheus ~]# systemctl status alertmanager.service
在Prometheus集成alertmanager
[root@prometheus ~]# vim /usr/local/prometheus/prometheus.yml
alerting:
  alertmanagers:
    - static_configs:
        - targets:
           - 192.168.43.254:9093

[root@prometheus ~]# systemctl restart prometheus.service
创建报警规则
[root@prometheus ~]# vim /usr/local/prometheus/prometheus.yml
[root@prometheus ~]# mkdir /usr/local/prometheus/rules/
[root@prometheus ~]# vim /usr/local/prometheus/rules/node_rules.yml
groups:
  - name: node-alert
    rules:
    - alert: disk-full
      expr: (1-(node_filesystem_free_bytes{fstype=~"ext4|xfs",mountpoint="/"} / node_filesystem_size_bytes{fstype=~"ext4|xfs",mountpoint="/"})) * 100 > 50
      for: 1m
      labels:
        serverity: page
      annotations:
        summary: "{{ $labels.instance }} disk full "
        description: "{{ $labels.instance }} disk > {{ $value }}  "

[root@prometheus ~]# systemctl restart prometheus.service
Alert: 告警规则的名称
expr:基于PromQL表达式告警触发条件,用于计算是否有时间序列满足该条件。
for:评估等待时间,可选参数。用于表示只有当触发条件持续一段时间后才发送告警。在等待期间新产生告警的状态为pending。
labels:自定义标签,允许用户指定要附加到告警上的一组附加标签。
annotations:用于指定一组附加信息,比如用于描述告警详细信息的文字等,annotations的内容在告警产生时会一同作为参数发送到Alertmanager。
summary描述告警的概要信息
description用于描述告警的详细信息。同时Alertmanager的UI也会根据这两个标签值,显示告警信息。
可以在web界面看到如下信息
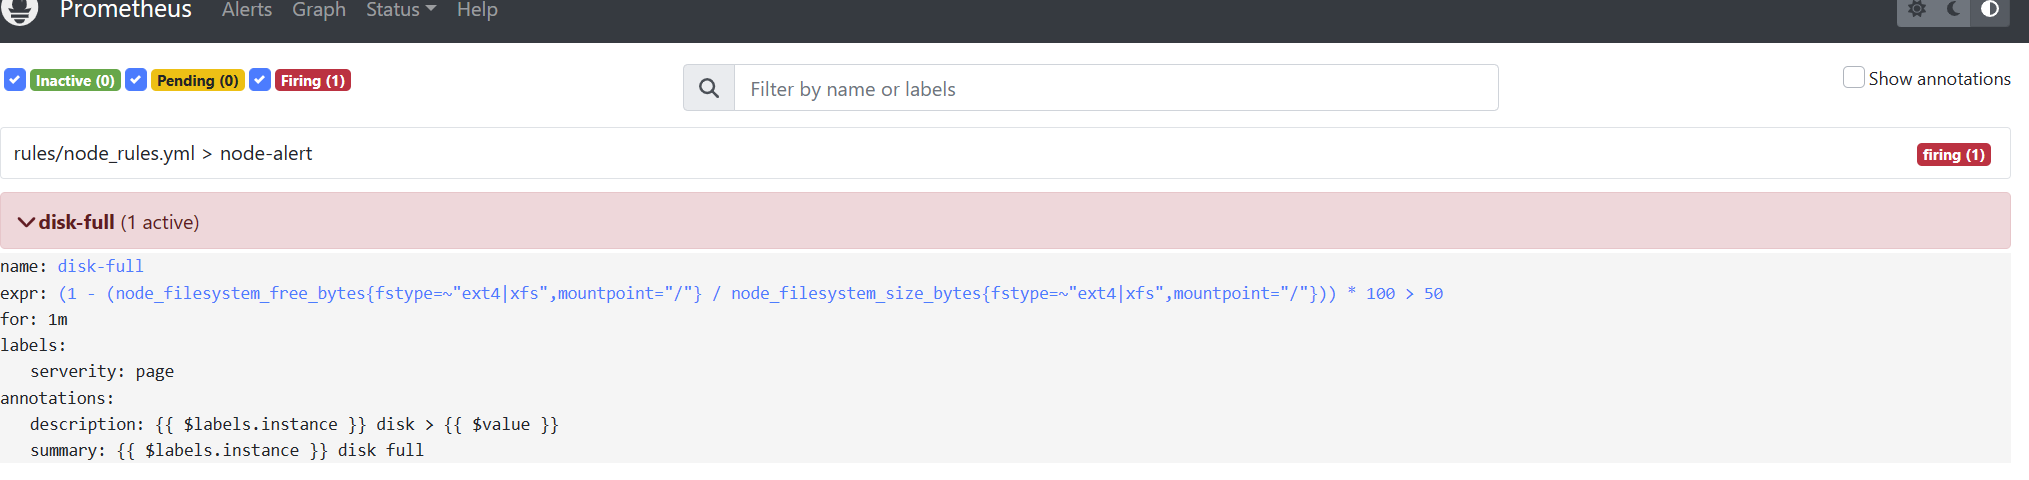
目前磁盘没有达到50%, 我们这里配合下触发这个报警规则
[root@node1 ~]# df -h  |grep "/$"
/dev/mapper/centos-root   50G  1.9G   49G    4% /
[root@node1 ~]# dd if=/dev/zero of=bigfile bs=1M count=30000
自定义监控模板
[root@prometheus ~]# mkdir /usr/local/prometheus/alertmanager/template/
[root@prometheus ~]# vim /usr/local/prometheus/alertmanager/template/wechat.tmpl
{{ define "email.html" }}

{{ range .Alerts }}

<pre>

========start==========

告警程序: prometheus_alert_email

告警级别: {{ .Labels.severity }} 级别

告警类型: {{ .Labels.alertname }}

故障主机: {{ .Labels.instance }}

告警主题: {{ .Annotations.summary }}

告警详情: {{ .Annotations.description }}

处理方法: {{ .Annotations.console }}

触发时间: {{ .StartsAt.Format "2006-01-02 15:04:05" }}

========end==========

</pre>

{{ end }}

{{ end }}

[root@prometheus ~]# chown prometheus:prometheus  /usr/local/prometheus/alertmanager/template/ -R
配置消息接收
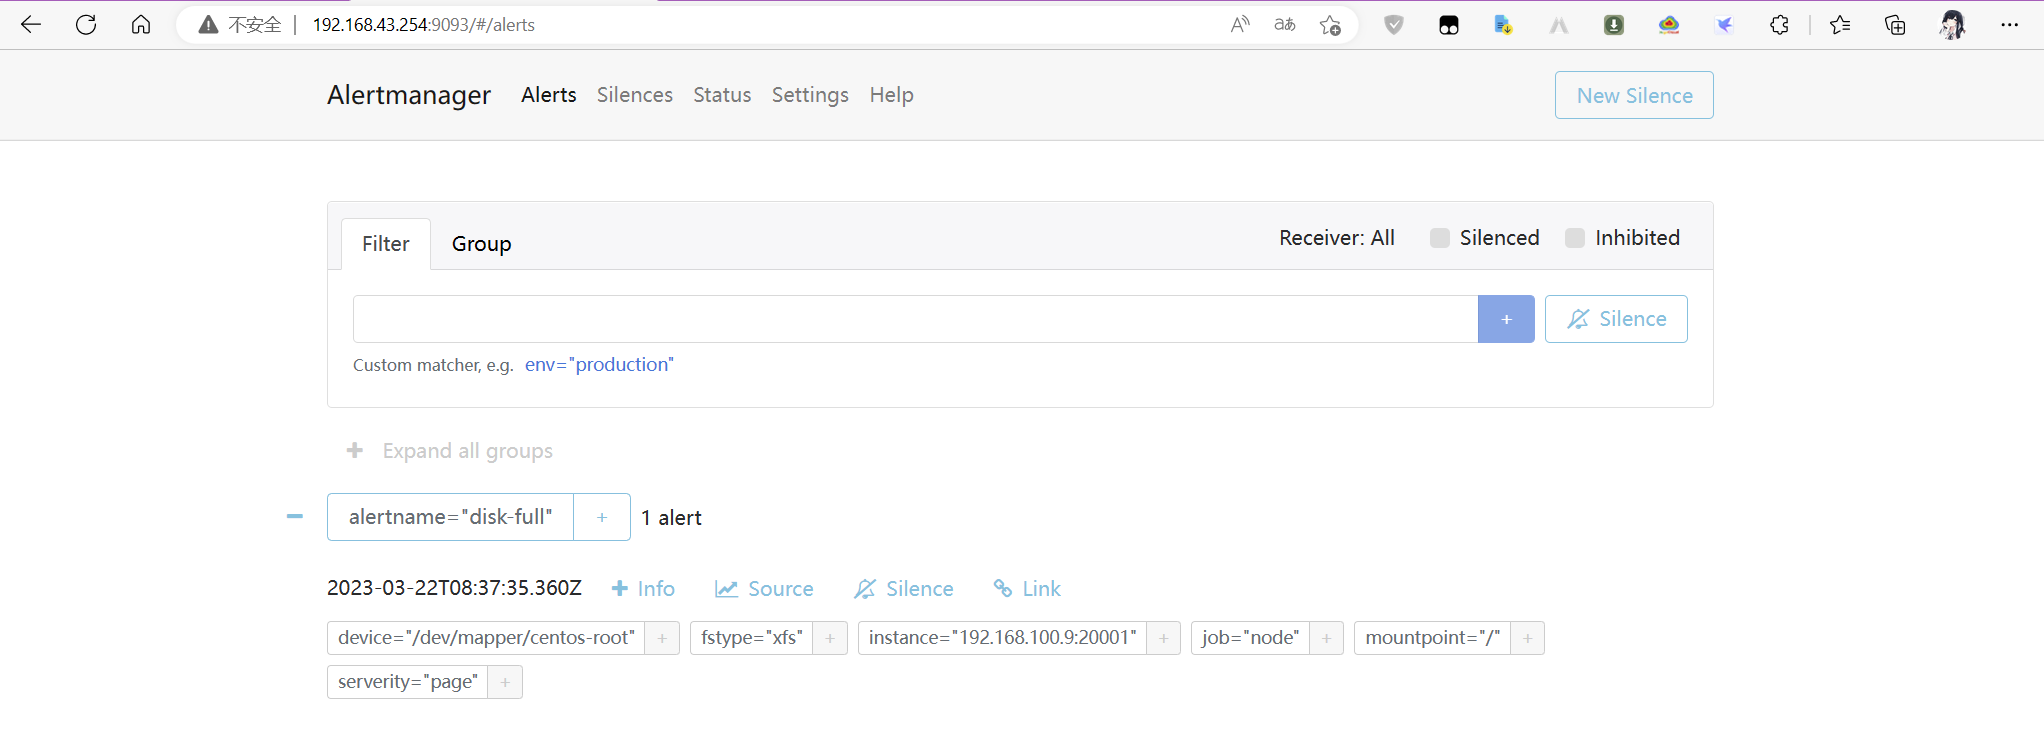
上面的消息信息已经从prometheus推送给alertmanager了,我们已经可以在alertmanager的web管理界面看到对应的报警信息,但是我们还没有配置如何让alertmanager把这些信息推送我们的社交软件上面去。
由于邮件系统大家用的比较多,这里就是用qq邮箱进行后续试验。
[root@prometheus ~]# vim /usr/local/prometheus/alertmanager/alertmanager.yml
global:
  resolve_timeout: 5m
  smtp_smarthost: 'smtp.qq.com:465'
  smtp_from: '3439555351@qq.com'
  smtp_auth_username: '3439555351@qq.com'
  smtp_auth_password: 'yfbovoiudmiwcgja'
  smtp_require_tls: false

templates:
  - '/usr/local/prometheus/alertmanager/temp/*.tmp1'

route:
  group_by: ['alertnamea','cluster','service']
  group_wait: 10s
  group_interval: 10s
  repeat_interval: 1h
  receiver: 'yfbovoiudmiwcgja'
receivers:
- name: 'yfbovoiudmiwcgja'
  email_configs:
  - send_resolved: true
    to: 3439555351@qq.comhtml: '{{ template "email.html" . }}'
    headers: { Subject: "[WARN] 报警邮件" }

inhibit_rules:
  - source_match:
      severity: 'critical'
    target_match:
      severity: 'warning'
    equal: ['alertname', 'dev', 'instance']

[root@prometheus ~]# systemctl restart alertmanager

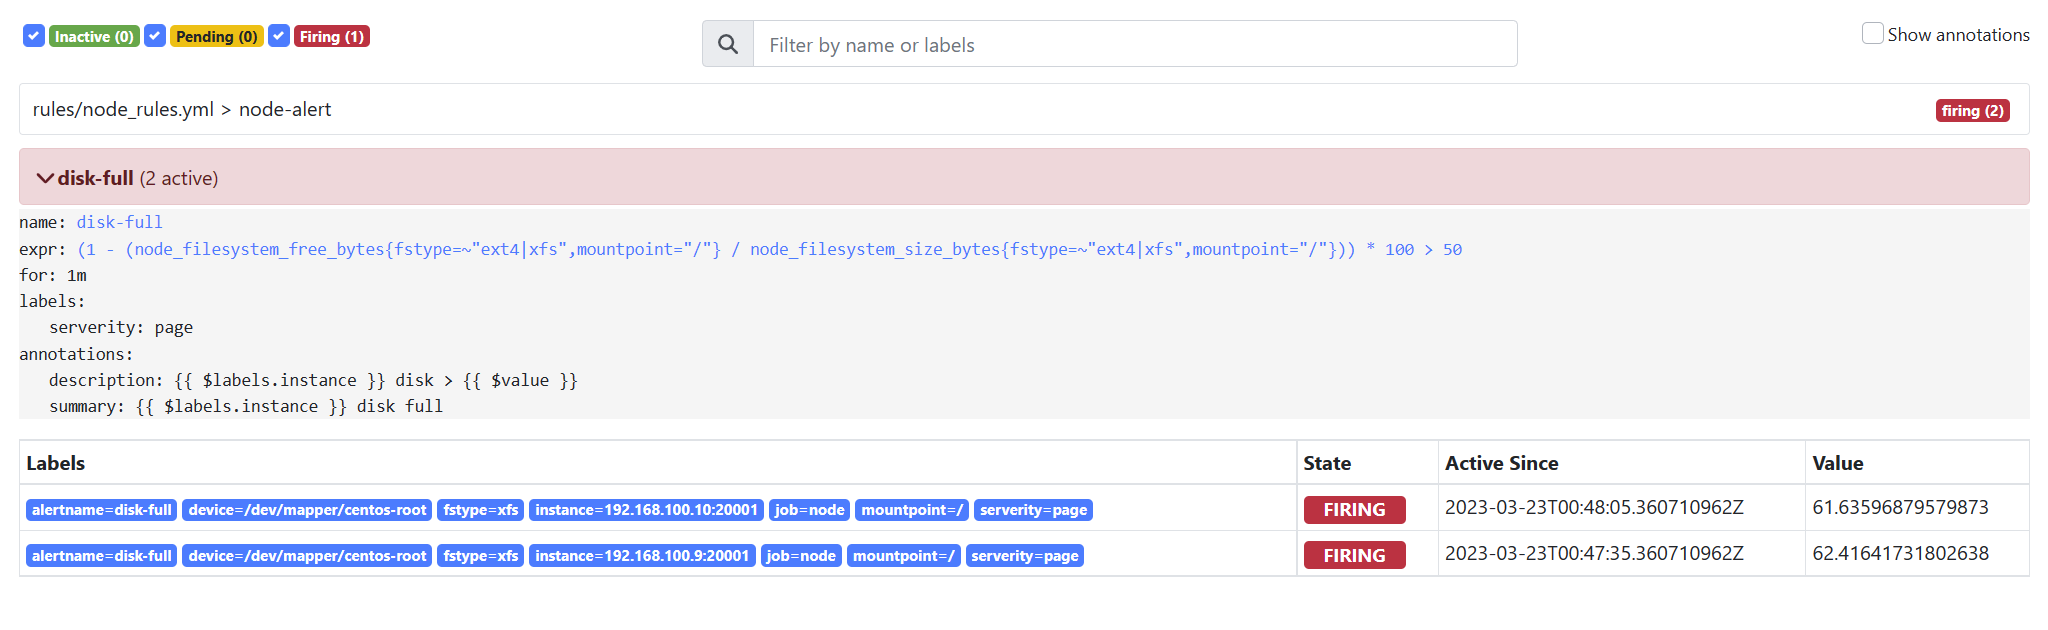
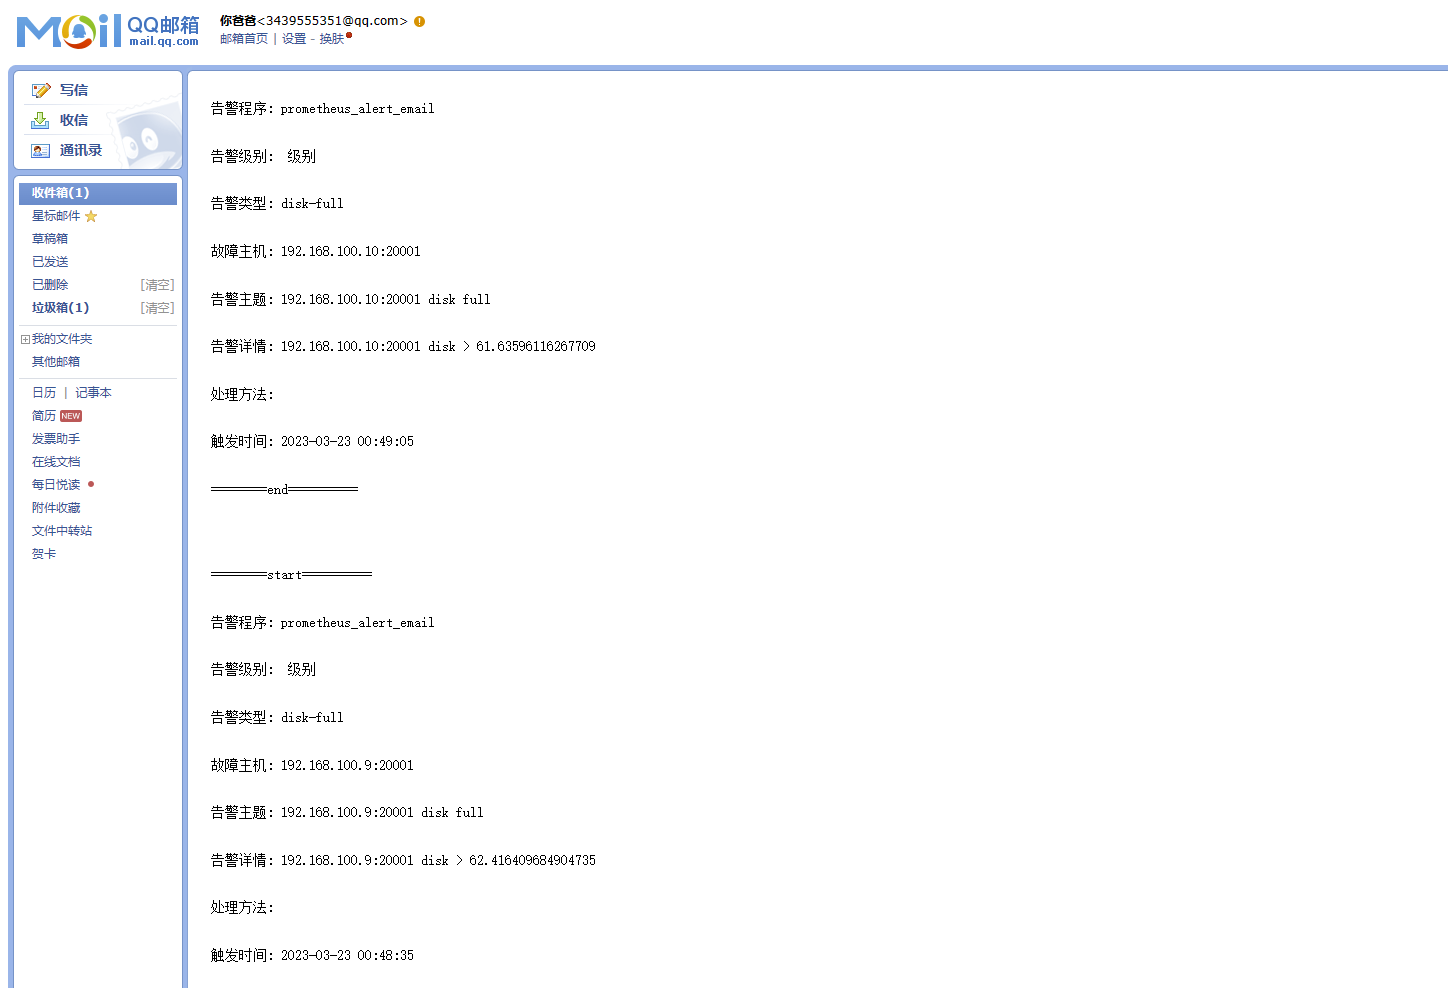
测试
[root@node1 ~]# dd if=/dev/zero of=bigfile bs=1M count=30000
[root@node1 ~]# df -h |grep "/$"
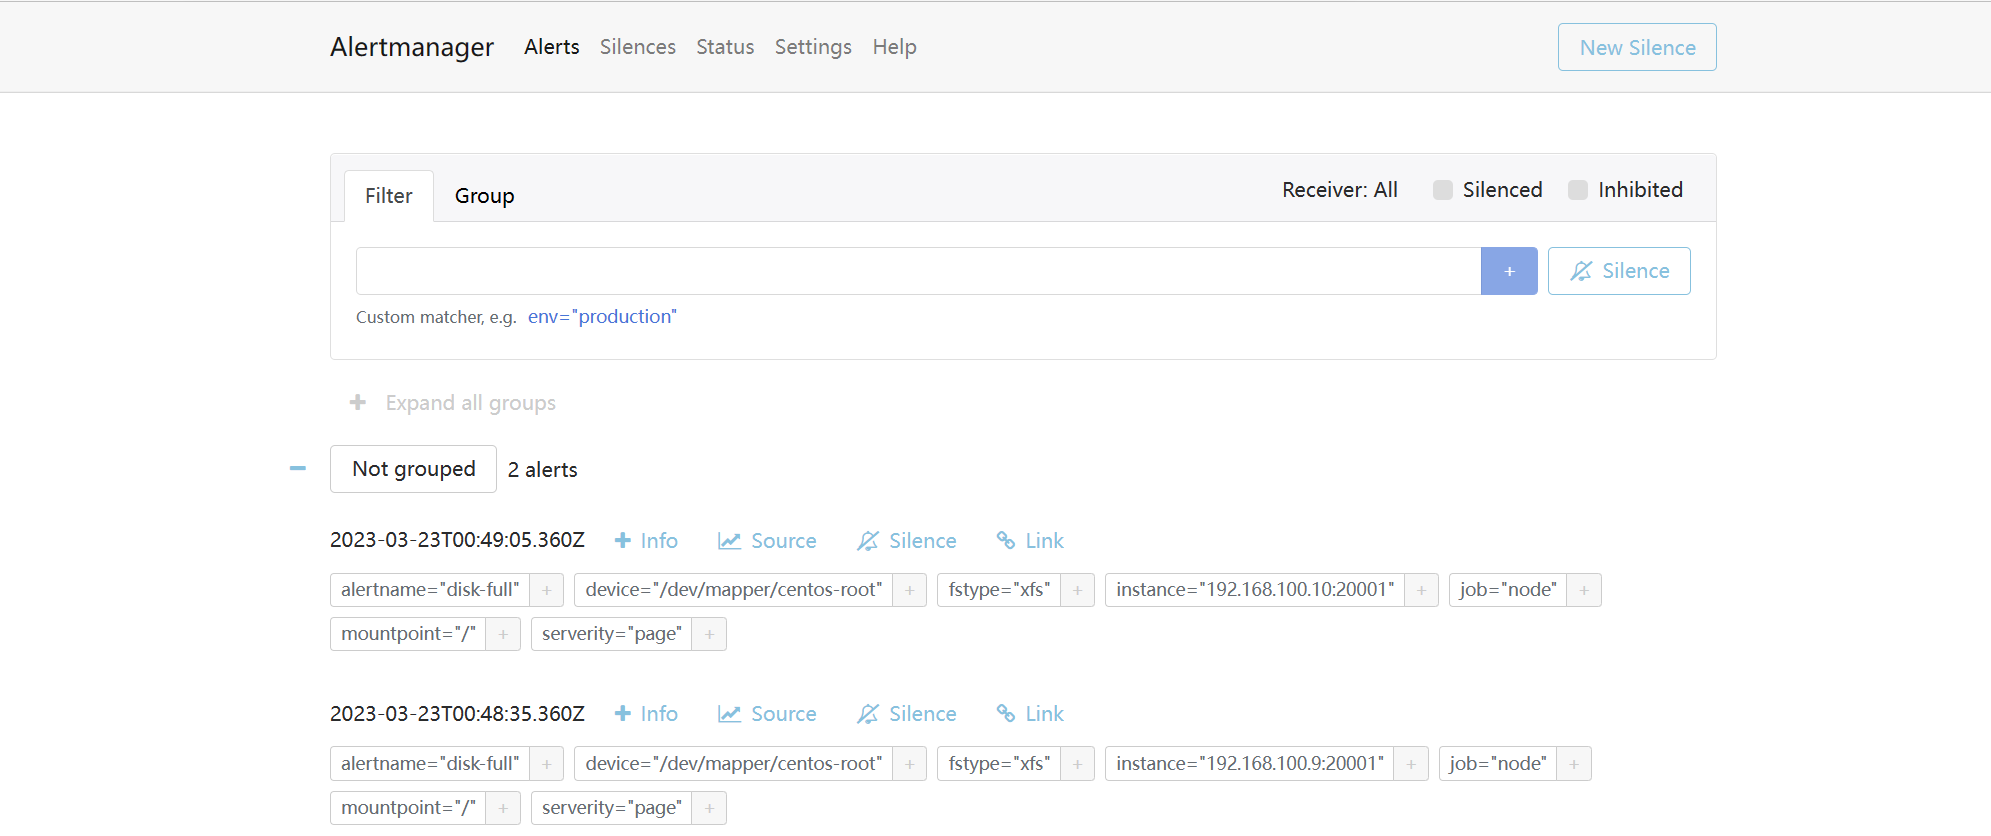
/dev/mapper/centos-root 50G 32G 19G 63% /查看报警信息


 1万+
1万+

 被折叠的 条评论
为什么被折叠?
被折叠的 条评论
为什么被折叠?
 到【灌水乐园】发言


