


 该博客分享了一个关于如何在ECharts中实现竖向显示图例的问题,通过代码调整使饼图和百分比数据显示正确。作者探讨了数据处理和option配置技巧。
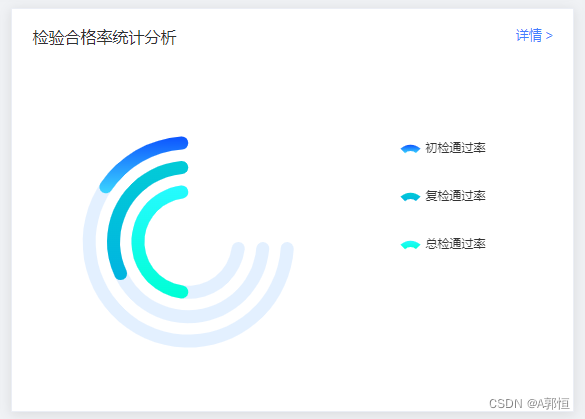
附上代码
export function getQualification(params) {
  let color3 = new echarts.graphic.LinearGradient(0, 1, 0, 0, [{ offset: 0, color: "#00FFD5" }, { offset: 1, color: "#26FAFF" }], false);
  let color2 = new echarts.graphic.LinearGradient(0, 1, 0, 0, [{ offset: 0, color: "#00B4E0" }, { offset: 1, color: "#02CBD7" }], false);
  let color1 = new echarts.graphic.LinearGradient(0, 1, 0, 0, [{ offset: 0, color: "#3BD6FF" }, { offset: 1, color: "#0D54FF" }], false);
  let color = [color1, color2, color3]
  let chartData = [{
    name: "初检通过率",
    value: 11,
    unit: '%'
  },
  {
    name: "复检通过率",
    value: 22,
    unit: '%'
  },
  {
    name: "总检通过率",
    value: 33,
    unit: '%'
  },
  ];
  let arrName = [];
  let arrValue = [];
  let sum = 0;
  let pieSeries = [],
    lineYAxis = [];

  // 数据处理
  chartData.forEach((v, i) => {
    arrName.push(v.name);
    arrValue.push(v.value);
    sum = sum + v.value;
  })

  // 图表option整理
  chartData.forEach((v, i) => {
    pieSeries.push({
      name: '合格率',
      type: 'pie',
      clockWise: false,
      hoverAnimation: false,
      radius: [65 - i * 15 + '%', 57 - i * 15 + '%'],
      center: ["30%", "60%"],
      label: {
        show: false
      },
      data: [{
        value: v.value,
        name: v.name,
        itemStyle: {
          borderRadius: [10, 10, 10, 10]
        },
      }, {
        value: sum - v.value,
        name: '',
        itemStyle: {
          color: "rgba(0,0,0,0)",
        },
        tooltip: {
          show: false
        },
      }]
    });
    pieSeries.push({
      name: '',
      type: 'pie',
      silent: true,
      z: 1,
      clockWise: false, //顺时加载
      hoverAnimation: true, //鼠标移入变大
      radius: [65 - i * 15 + '%', 57 - i * 15 + '%'],
      center: ["30%", "60%"],
      label: {
        show: false
      },
      data: [{
        value: 7.5,
        itemStyle: {
          color: "#E3F0FF",
          borderRadius: [10, 10, 10, 10]
        },
      }, {
        value: 2.5,
        name: '',
        itemStyle: {
          color: "rgba(0,0,0,0)",
        }
      }]
    });
    v.percent = (v.value / sum * 100).toFixed(1) + "%";
    lineYAxis.push({
      value: i,
      textStyle: {
        rich: {
          circle: {
            color: color[i],
            padding: [0, 5]
          }
        }
      }
    });
  })

  let option = {
    backgroundColor: '#fff',
    color: color,
    legend: {
      top: '28%',
      right: '12%',
      icon: 'path://M 5.6625788784379045 9.946769456681356  C 9.224907727110386 6.57672540381792  14.859864269555896 6.514317180616742  18.42219311822838 9.821953010279003  L 23.53899273723063 4.891703377386198  C 17.126800809620217 -1.2867107195300997  6.763662340754848 -1.2867107195300997  0.416240028574828 4.891703377386198  L 5.6625788784379045 9.946769456681356  Z ',
      itemWidth: 20,//修改小图标宽
      itemHeight: 10,//修改小图标高
      // orient: 'vertical',
      itemGap: 12,
    },
    tooltip: {
      trigger: 'item',
      formatter: '{b} {c}%'
    },
    yAxis: [{
      type: 'category',
      inverse: true,
      axisLine: {
        show: false
      },
      axisTick: {
        show: false
      },
    }],
    xAxis: [{
      show: false
    }],
    series: pieSeries
  };
  return option
}
亲们
图例我设置竖向显示 但是还是水平显示 后来注释调就OK了 这个搞不明白 欢迎在评论区讨论


 877
877

 被折叠的 条评论
为什么被折叠?
被折叠的 条评论
为什么被折叠?
 到【灌水乐园】发言


