


## SHAP 原理简介
**目标:** 理解复杂机器学习模型(尤其是“黑箱”模型,如随机森林、梯度提升树、神经网络等)**为什么**会对**特定输入**做出**特定预测**。 SHAP 提供了一种统一的方法来解释模型的输出。
**核心思想:合作博弈论中的 Shapley 值**
print("--- 1. SHAP 特征重要性条形图 ---")
shap.summary_plot(shap_values[0], X_test, plot_type="bar", show=False)  # 直接使用 shap_values[0]
plt.title("SHAP Feature Importance (Bar Plot)")
plt.show() 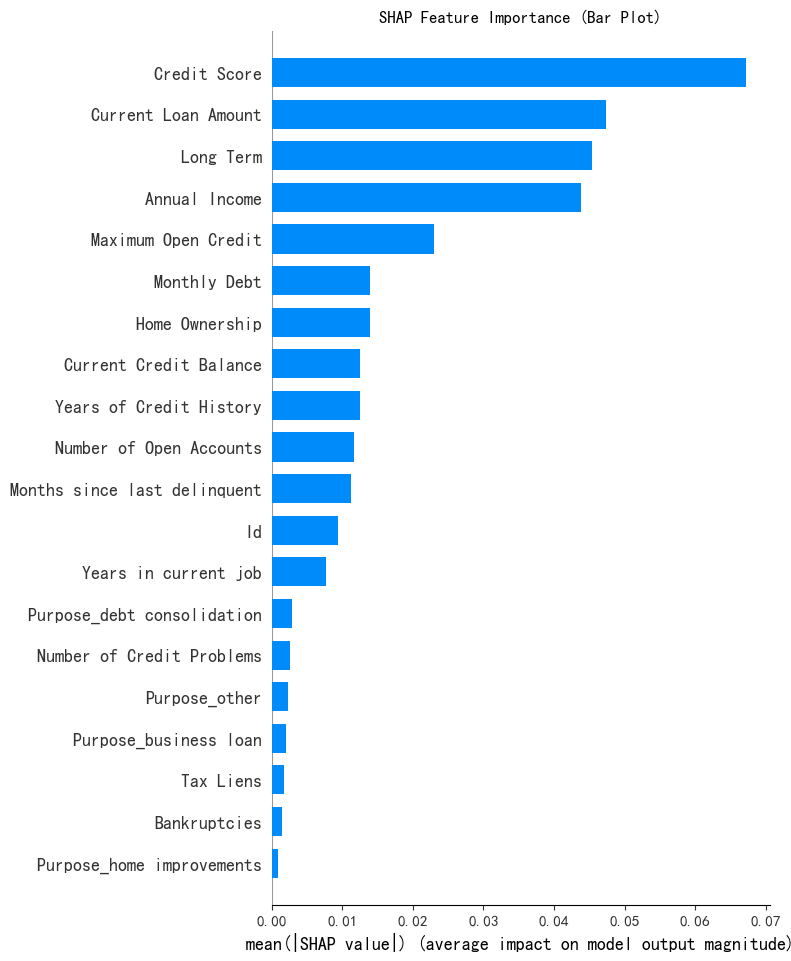
print("--- 2. SHAP 特征重要性蜂巢图 ---")
shap.summary_plot(shap_values[0], X_test, plot_type="violin", show=False, max_display=10)  # 直接用 shap_values[0]
plt.title("SHAP Feature Importance (Violin Plot)")
plt.show() 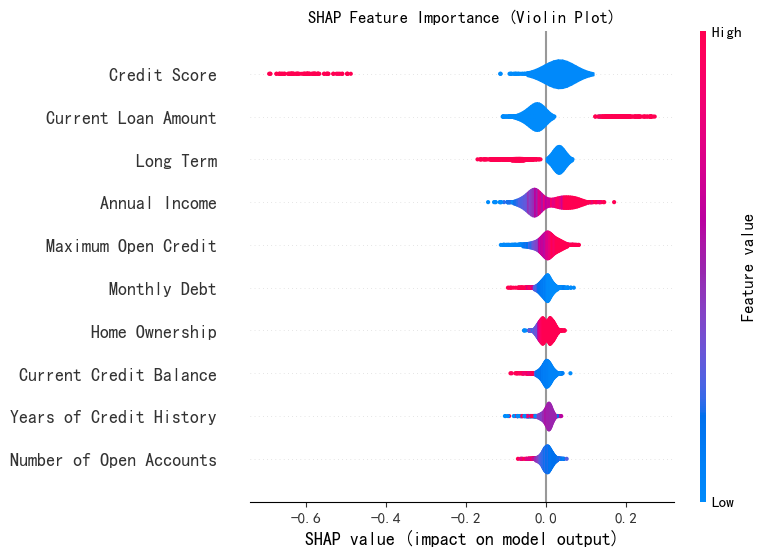
# --- 2. SHAP 散点图 ---
print("--- 2. SHAP 散点图 ---")
# 选择一个特征(例如第0个特征)
feature_idx = 0
shap.dependence_plot(
    feature_idx,
    shap_values[0],
    X_test,
    feature_names=X_test.columns if hasattr(X_test, 'columns') else None,  # 如果X_test是DataFrame
    show=False
)
plt.title(f"SHAP Dependence Plot (Feature {feature_idx})")
plt.show() 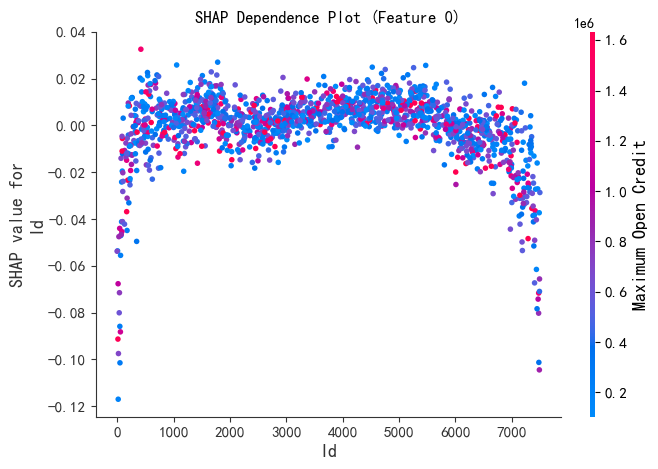
# 确保 shap_values[0] 是 NumPy 数组
if isinstance(shap_values, list):
    shap_values_array = np.array(shap_values[0])  # 转换为 NumPy 数组(如果尚未是)
else:
    shap_values_array = shap_values  # 如果已经是 NumPy 数组

# 绘制决策图
shap.plots.decision(
    shap_values_array[sample_idx],  # 单个样本的 SHAP 值
    X_test.iloc[sample_idx] if hasattr(X_test, 'iloc') else X_test[sample_idx],  # 特征值
    show=False
)
plt.title(f"SHAP Decision Plot (Sample {sample_idx})")
plt.show()
# --- 5. SHAP 交互作用图 ---
print("--- 5. SHAP 交互作用图 ---")
# 注意:需先计算交互作用值(如果模型支持)
try:
# 假设 explainer 支持 interaction_values
interaction_values = explainer.shap_interaction_values(X_test) # 替换为你的explainer对象
# 选择一个特征对(例如第0和第1个特征)
shap.dependence_plot(
(0, 1), # 特征对索引
interaction_values[0], # 交互作用值
X_test,
feature_names=X_test.columns if hasattr(X_test, 'columns') else None,
show=False
)
plt.title("SHAP Interaction Values (Features 0 & 1)")
plt.show()
except AttributeError:
print("警告:当前explainer不支持交互作用值计算!")最后两个图要跑半天我没等到跑出来把code贴出来。


 被折叠的 条评论
为什么被折叠?
被折叠的 条评论
为什么被折叠?
 到【灌水乐园】发言


