


Prometheus介绍
-
官方站点: https://prometheus.io
-
为什么选择Prometheus?
对于容器集群【Kubernetes,swarm 】监控目前是最好的解决方案,传统的监控系统zabbix,nagios支持较差
CNCF下项目,社区对比其他工具要活跃
使用go语言开发,对并发支持较好,同时Prometheus相关组件基本都可以直接下载解压运行,配置简单,相比其他监控系统配置要简单
自带高性能TSDB(时序数据库),同时可以通过PromQL对数据进行查询
监控展示功能
- 主机监控: CPU、内存、网络、主机信息汇总
- MySQL :mysql服务器状态信息、主从复制状态
- blackboxexporter :HTTP、ICMP、TCP-Port
- HTTP应用监控
- alertmanger实时报警
架构介绍
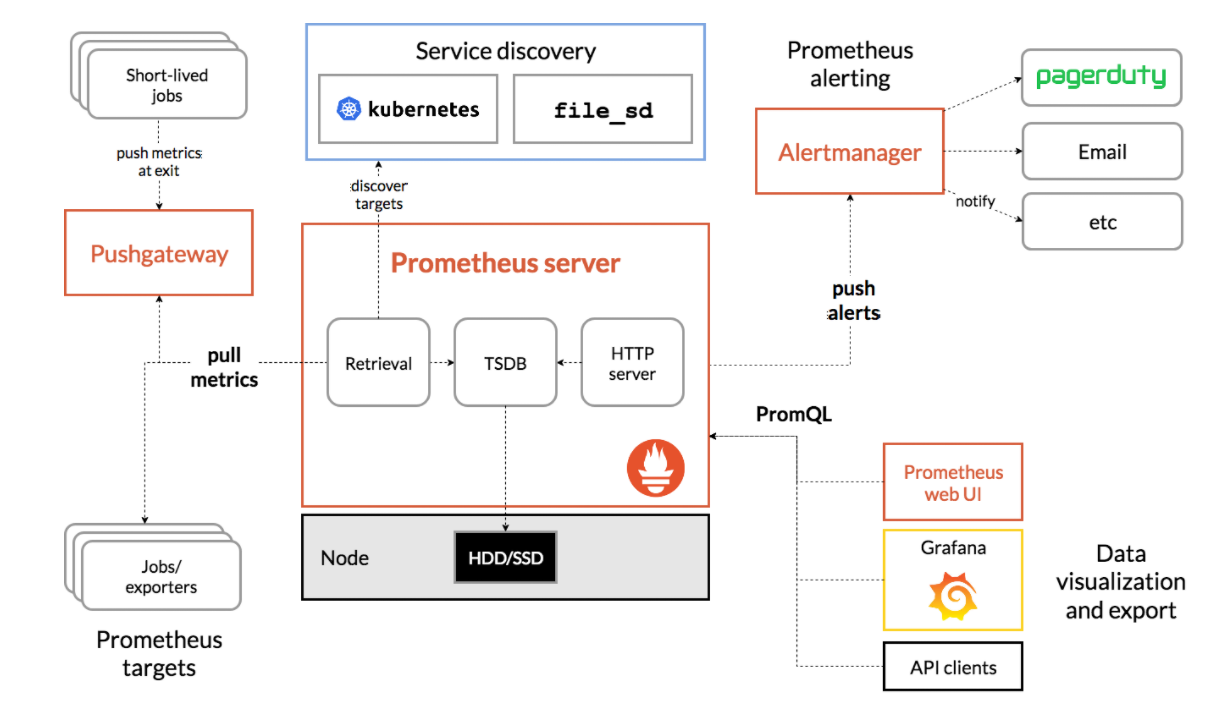
架构说明
-
数据采集端:采集监控目标的数据并展示为http://IP:port/metrics的形式
- 常用的exporter
- 自定义脚本,pushgateway
-
Prometheus:拉取监控数据,存储采集的监控数据,提供查询语句和查询界面
- TSDB:时序数据库存储
- HTTP:默认9090端口界面提供查询
-
Service discovery: 服务发现,支持文件扫描,consul服务器发现
- 提供服务发现服务,对于容器集群或者经常发生变化的网络环境能提供快速的发现服务,实现动态配置
-
AlterManager:报警插件,提供各类型的报警推送
- 接受来自Prometheus端的报警信息,对报警信息进行分组,抑制等处理
- 支持推送 报警到email,微信,webhook等
-
Grafana: 通过promql查询语法+丰富的图表展示实时展示监控数据,实现数据可视化
- promql: 作为grafana查询的核心语句
- 同时支持报警,但是报警不支持引用变量,因此实际报警使用的是alertmanager组件
一、学习环境初始化
| 主机名 | IP地址 | 角色 |
|---|---|---|
| prome | 192.168.1.10 | Prometheus-server |
| node-1 | 192.168.1.11 | grafana consul mysql-master |
| node-2 | 192.168.1.12 | alertmanager mysql-slave |
| node-3 | 192.168.1.13 | pushgateway nginx blackbox_exporter |
- 配置国内yum源
wget http://mirrors.aliyun.com/repo/Centos-7.repo
wget http://mirrors.163.com/.help/CentOS7-Base-163.repo
yum clean all && yum clean metadata && yum clean dbcache && yum makecache && yum update
- 配置ntp同步,Prometheus基于TSDB存储数据,各节点之间时间要保持一致。
crontab -e
*/20 * * * * /usr/sbin/ntpdate cn.ntp.org.cn > /dev/null 2>&1
- 配置selinux、防火墙
# 关闭防火墙
systemctl stop firewalld.service
systemctl disable firewalld.service
# 关闭selinux
sed -i 's/enforcing/disabled/' /etc/selinux/config
setenforce 0
二、Linux下安装exporter
安装linux主机下的exporter,监控linux服务器的CPU,内存,网络状态等信息
#!/bin/bash
# 下载安装包
download_url="https://github.com/prometheus/node_exporter/releases/download/v1.1.2/node_exporter-1.1.2.linux-amd64.tar.gz"
if [ ! -e "node_exporter-1.1.2.linux-amd64.tar.gz" ];then
        wget ${download_url}
fi

# 解压安装
tar -xvf node_exporter-1.1.2.linux-amd64.tar.gz
rm -rf /usr/local/node_exporter*
mv node_exporter-1.1.2.linux-amd64/ /usr/local/
ln -sv /usr/local/node_exporter-1.1.2.linux-amd64 /usr/local/node_exporter

# 生成服务器管理脚本
cat <<EOF >/usr/lib/systemd/system/node_exporter.service
[Unit]
Description=node_exporter for linux server
Documentation=https://prometheus.io/
After=network-online.target

[Service]
Type=simple
User=root
Group=root
ExecStart=/usr/local/node_exporter/node_exporter
Restart=on-failure

[Install]
WantedBy=multi-user.target

EOF

# 服务管理
systemctl daemon-reload
systemctl enable node_exporter  --now
三、prometheus的安装配置
- 下载地址: github官方站点
wget https://github.com/prometheus/prometheus/releases/download/v2.28.1/prometheus-2.28.1.linux-amd64.tar.gz
- 解压并移动到安装路径下
tar -xvf prometheus-2.28.1.linux-amd64.tar.gz
mv prometheus-2.28.1.linux-amd64 /usr/local/
ln -sv /usr/local/prometheus-2.28.1.linux-amd64/ /usr/local/prometheus
- 生成启动脚本,/usr/lib/systemd/system/prometheus.service
cat >/usr/lib/systemd/system/prometheus.service<<EOF
[Unit]
Description=Prometheus server daemon
After=network.target

[Service]
Type=simple
User=root
Group=root
ExecStart=/usr/local/prometheus/prometheus     \
--config.file=/usr/local/prometheus/prometheus.yml     \
--storage.tsdb.path=/usr/local/prometheus/data    \
--storage.tsdb.retention=30d     \
--web.console.templates=/usr/local/prometheus/consoles     \
--web.console.libraries=/usr/local/prometheus/console_libraries     \
--web.external-url=http://192.168.1.10:9090      \
--web.enable-admin-api \
--web.listen-address=0.0.0.0:9090
Restart=on-failure
ExecReload=/bin/kill -HUP $MAINPID

[Install]
WantedBy=multi-user.target
EOF
- 启动服务,并配置开机启动
systemctl daemon-reload
systemctl enable prometheus.service  --now
配置说明
- 各项配置说明
- –config.file=/usr/local/prometheus/prometheus.yml:指定Prometheus的配置文件
- –storage.tsdb.path=“/usr/local/prometheus/data”: 监控数据存储路径
- –storage.tsdb.retention=30d : 最长只保留30天
- –web.console.templates=“/usr/local/prometheus/consoles”: 控制台模板路径位置
- –web.console.libraries=“/usr/local/prometheus/console_libraries” : 控制台库路径
- –web.external-url =http://192.168.1.10:9090: Prometheus外部连接地址
- –web.listen-address=0.0.0.0:9090 : 监听的地址和端口
[root@prome ~]# /usr/local/prometheus/prometheus --help
usage: prometheus [<flags>]

The Prometheus monitoring server

Flags:
  -h, --help                     Show context-sensitive help (also try --help-long and --help-man).
      --version                  Show application version.
      --config.file="prometheus.yml"
                                 Prometheus configuration file path.
      --web.listen-address="0.0.0.0:9090"
                                 Address to listen on for UI, API, and telemetry.
将上述手动安装命令串接到脚本中作为自动安装脚本,可重复使用。
#!/bin/bash
# 下载
download_url="https://github.com/prometheus/prometheus/releases/download/v2.28.1/prometheus-2.28.1.linux-amd64.tar.gz"
if [ ! -e "prometheus-2.28.1.linux-amd64.tar.gz" ];then
        wget ${download_url}
fi

# 解压并安装
rm -rf ./prometheus-2.28.1.linux-amd64
tar -xvf prometheus-2.28.1.linux-amd64.tar.gz
rm /usr/local/prometheus* -rf
mv prometheus-2.28.1.linux-amd64 /usr/local/
ln -sv /usr/local/prometheus-2.28.1.linux-amd64/ /usr/local/prometheus

# 安装服务脚本
ip=`ip a|grep 'inet '|grep -v '127.0.0.1'|awk  '{print $2}'|awk -F '/' '{print $1}'`
cat <<EOF >/usr/lib/systemd/system/prometheus.service
[Unit]
Description=Prometheus server daemon
After=network.target

[Service]
Type=simple
User=root
Group=root
ExecStart=/usr/local/prometheus/prometheus \
    --config.file=/usr/local/prometheus/prometheus.yml \
    --storage.tsdb.path="/usr/local/prometheus/data" \
    --storage.tsdb.retention=30d \
    --web.console.templates="/usr/local/prometheus/consoles" \
    --web.console.libraries="/usr/local/prometheus/console_libraries" \
    --web.external-url=http://${ip}:9090  \
    --web.listen-address=0.0.0.0:9090
Restart=on-failure
EOF

systemctl daemon-reload
systemctl enable prometheus.service  --now
检查配置文件是否有语法错误:
/usr/local/prometheus/promtool check config /usr/local/prometheus/prometheus.yml
四、接入prometheus配置
1、静态写入prometheus.yml
Prometheus支持yml和json,yml通过缩进控制key-value关系,-代表列表元素。yml可以和json相互转换,通过转换我们可以更容易理解yml的语法。
[root@prome ~]# grep -vE "^#|^ *# |^$" /usr/local/prometheus/prometheus.yml
#全局配置
global:
  scrape_interval:     15s # 15s刷新一次数据,默认1min
  evaluation_interval: 15s # 15s刷新一次规则
#报警接入配置
alerting:
  alertmanagers:
  - static_configs:
    - targets:
#规则加载,根据global.evaluation_interval刷新
rule_files:
#任务节点配置
scrape_configs:
  - job_name: 'prometheus'
    static_configs:
    - targets: ['localhost:9090']
prometheus.yml 新增 如下配置
  - job_name: 'first job'
    static_configs:
    - targets:
        - '192.168.1.10:9100'
      labels:
        cluster: prometheus
        role: prometheus-server
        team: ezdevops
[root@prome ~]# systemctl restart prometheus.service
http://192.168.1.10:9090

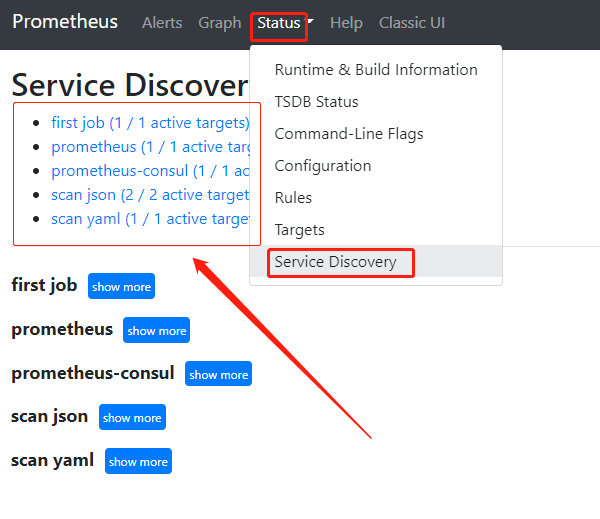
2、文件扫描:yaml&json
Prometheus可扫描通配符指定的文件内容,一旦文件内容发生变化时能实时感知并加载配置。
yaml
- 配置扫描yaml任务到prometheus.yaml内
[root@prome ~]# mkdir -p /etc/prometheus/nodes/
[root@prome ~]# vim /usr/local/prometheus/prometheus.yml
...
  - job_name:  'scan yaml'
    scrape_interval: 15s      #默认,可以不写
    scrape_timeout: 10s       #默认,可以不写
    metrics_path: /metrics    #默认,可以不写
    file_sd_configs:
      - files:
        - /etc/prometheus/nodes/*.yaml     #扫描路径
        refresh_interval: 5s
- /etc/prometheus/nodes/目录下的yaml配置
[root@prome ~]# vim /etc/prometheus/nodes/altermanager.yaml
- targets:
  - 192.168.1.12:9100
  labels:
    team: ezdevops
    role: prometheus-altermanager
    cluster: prometheus
json
- 配置扫描json任务,到prometheus.yaml内
[root@prome ~]# vim /usr/local/prometheus/prometheus.yml
...
  - job_name:  'scan json'
    scrape_interval: 15s
    scrape_timeout: 10s
    metrics_path: /metrics
    file_sd_configs:
      - files:
        - /etc/prometheus/nodes/*.json
        refresh_interval: 5s
- /etc/prometheus/nodes/目录下的 *.json配置
[root@prome ~]# vim /etc/prometheus/nodes/grafna.json
[
  {
    "targets": [ "192.168.1.11:9100" ],
    "labels": {
      "cluster": "prometheus",
      "role": "prometheus-grafna",
      "team": "ezdevops"
    }
  }
]
[root@prome ~]# systemctl restart prometheus.service

[root@prome ~]# vim /etc/prometheus/nodes/pushgateway.json
[
  {
    "targets": [ "192.168.1.13:9100" ],
    "labels": {
      "cluster": "prometheus",
      "role": "pushgateway",
      "team": "ezdevops"
    }
  }
]
3、consul动态发现
文件扫描可以轻松完成服务的动态发现,但是有一定的局限性。相比静态文件扫描,consul提供HTTP接口的服务发现,我们可以通过代码控制接入consul实现动态服务发现。
consul安装配置
[root@node1 ~]# unzip consul_1.10.1_linux_amd64.zip
[root@node1 ~]# mv consul /usr/local/bin
[root@node1 ~]# sudo mkdir -p /var/lib/consul /etc/consul.d
[root@node1 ~]# sudo chmod -R 775 /var/lib/consul /etc/consul.d
[root@node1 ~]# cat <<EOF >/etc/systemd/system/consul.service
[Unit]
Description=Consul Service Discovery Agent
Documentation=https://www.consul.io/
After=network-online.target
Wants=network-online.target

[Service]
Type=simple
User=root
Group=root
ExecStart=/usr/local/bin/consul agent -server -ui \
        -bootstrap-expect=1 \
        -data-dir=/var/lib/consul \
        -node=consul \
        -bind=192.168.1.11 \
        -client=0.0.0.0 \
        -config-dir=/etc/consul.d
#我的虚拟机有多个网卡,不固定ip会报错
Restart=on-failure

[Install]
WantedBy=multi-user.target
EOF
[root@node1 ~]# systemctl daemon-reload
[root@node1 ~]# systemctl enable consul --now
访问页面 http://192.168.1.11:8500/

prometheus接入consul
将consul加入到Prometheus.yaml中。
[root@prome ~]# vim /usr/local/prometheus/prometheus.yml
...
  - job_name:  'prometheus-consul'
    consul_sd_configs:
       - server: 192.168.1.11:8500
[root@prome ~]# systemctl restart  prometheus.service
提交注册consul
consul搭建完成后可通过shell脚本提交注册数据到consul服务器,Prometheus就能取到我们提交的数据。
curl -X PUT -d '{
  "id": "node-1-exporter",
  "name": "node-1-exporter",
  "address": "192.168.1.11",
  "port": 9100,
  "tags": ["grafana"],
        "Meta": {
                "role": "grafana",
                "team": "ezdevops",
                "cluster": "prometheus"
        },
  "checks": [{"http": "http://192.168.1.11:9100/metrics", "interval": "5s"}]
}' http://192.168.1.11:8500/v1/agent/service/register

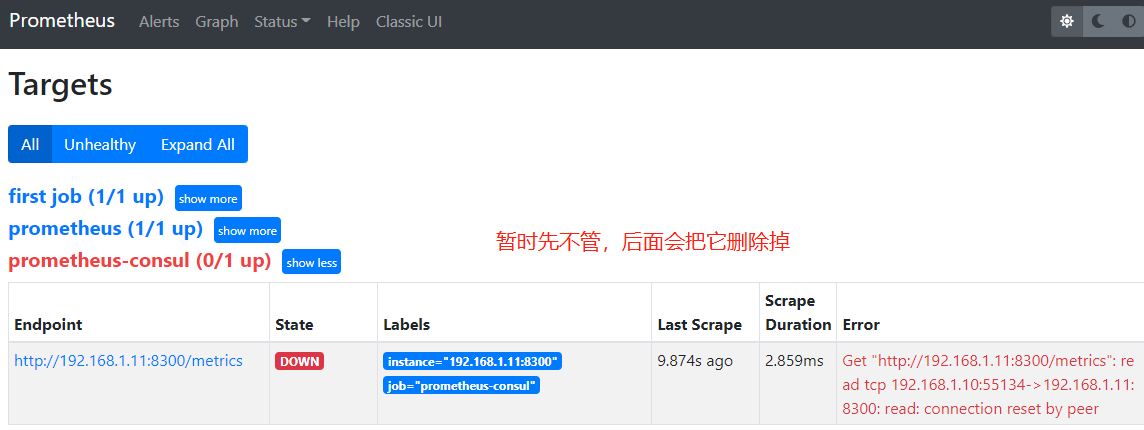
删除实例
curl --request PUT http://192.168.1.11:8500/v1/agent/service/deregister/node-1-exporter
删除上面不需要的endpoint
[root@prome ~]# vim /usr/local/prometheus/prometheus.yml
...
  - job_name:  'prometheus-consul'
...
    relabel_configs:
      - source_labels: [__address__]
        regex: 192.168.1.11:8300
        action: drop
[root@prome ~]# systemctl restart  prometheus.service

consul标签的处理
通过consul服务器发现的instance需要做标签的重新处理才能满足我们的要求。
  - job_name: 'consul-scan'
    consul_sd_configs:
    - server: '192.168.1.11:8500'
    relabel_configs:
      - source_labels: [__meta_consul_tags]
        regex: .*node.*
        action: keep
      - regex: __meta_consul_service_metadata_(.+)
        action: labelmap
      - source_labels: [__meta_consul_node]
        action: replace
        target_label: my_label
        regex: (.*con.*)
4、consul标签管理
对于类似consul服务器发现的一些标签我们都要做一定的处理使其满足我们的需求,标签处理我们成为relabel,以下介绍relabel提供的各种方法。
replace:          # 正则匹配源标签的值用来替换目标标签;如果有replacement,使用replacement替换目标标签;
labelmap:         # 正则匹配所有标签名; 将匹配的标签的值复制到由replacement提供的标签名

# 标签保留或移除
labeldrop:         正则匹配所有标签名;匹配则移除标签;
labelkeep:         正则匹配所有标签名;不匹配的标签会被移除;

# 监控目标管理
keep:             如果正则没有匹配到源标签,删除targets
drop:             正则匹配到源标签,删除targets
标签管理下的一些默认值
regex is (.*),
replacement is $1,
separator is ;
,and action is replace
drop删除
  - job_name:  'consul'
    consul_sd_configs:
       - server: 192.168.1.11:8500
    relabel_configs:
      - source_labels: [__address__]
        regex: 192.168.1.11:8300    #删除label对应匹配的值的target
        action: drop
keep保留
  - job_name:  'consul'
    consul_sd_configs:
       - server: 192.168.1.11:8500
    relabel_configs:
      - source_labels: [__address__]
        regex: 192.168.1.11:8300
        action: keep
labeldrop 清理指定标签
      - source_labels: [__meta_consul_node]
        action: replace
        target_label: node_name
      - action: labelmap
        regex: __meta_consul_(.+)
      - regex: tag.*
        action: labeldrop
      - regex: dc.*
        action: labeldrop
labelmap复制
- 值复制给(.+)正则匹配的内容,
__meta_consul_service_address=“192.168.1.11” ----> service_address=“192.168.1.11”
      - action: labelmap
        regex: __meta_consul_(.+)
replace替换
- 替换label名字,__meta_consul_tags=“,grafana,” ---->ezdevops_tags=“,grafana,”
      - source_labels: [__meta_consul_tags]
        action: replace
        target_label: ezdevops_tags


 1123
1123


 被折叠的 条评论
为什么被折叠?
被折叠的 条评论
为什么被折叠?
 到【灌水乐园】发言


