


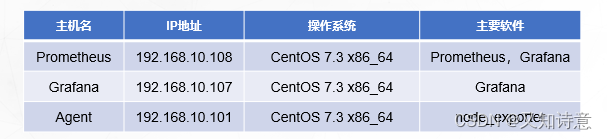
部署 Prometheus
Prometheus 的安装
在Prometheus服务器上
hostnamectl set-hostname prometheus
bash
sed -i 's/SELINUX=enforcing/SELINUX=disabled/' /etc/selinux/config
setenforce 0
systemctl stop firewalld
systemctl disable firewalld
上传包 prometheus-2.48.0.linux-amd64.tar.gz
tar zxvf prometheus-2.48.0.linux-amd64.tar.gz
mv prometheus-2.48.0.linux-amd64 /usr/local/prometheus
ln -s /usr/local/prometheus/prometheus /usr/local/bin
ln -s /usr/local/prometheus/promtool /usr/local/bin
prometheus --version
注册 Prometheus 的系统服务
vim /usr/lib/systemd/system/prometheus.service
[Unit]
Description=https://prometheus.io
[Service]
Restart=on-failure
ExecStart=/usr/local/prometheus/prometheus --config.file=/usr/local/prometheus/prometheus.yml --web.listen-address=:9090
[Install]
WantedBy=multi-user.target
systemctl daemon-reload
systemctl enable --now prometheus
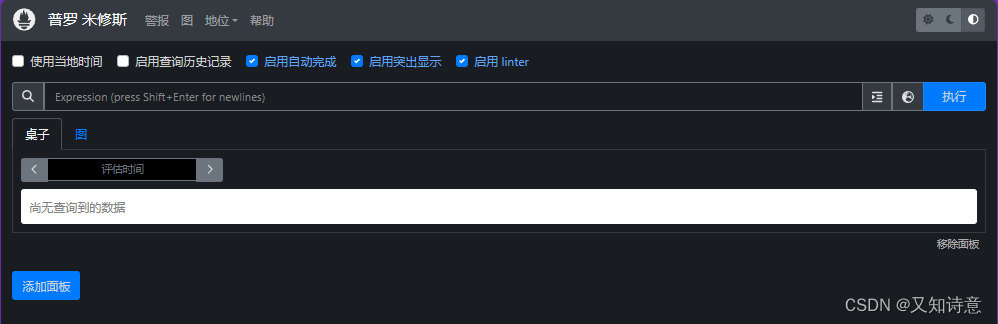
访问测试
访问Prometheus首页
http://192.168.10.30:9090
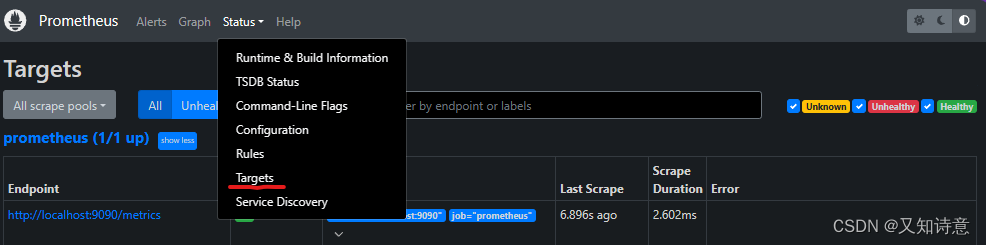
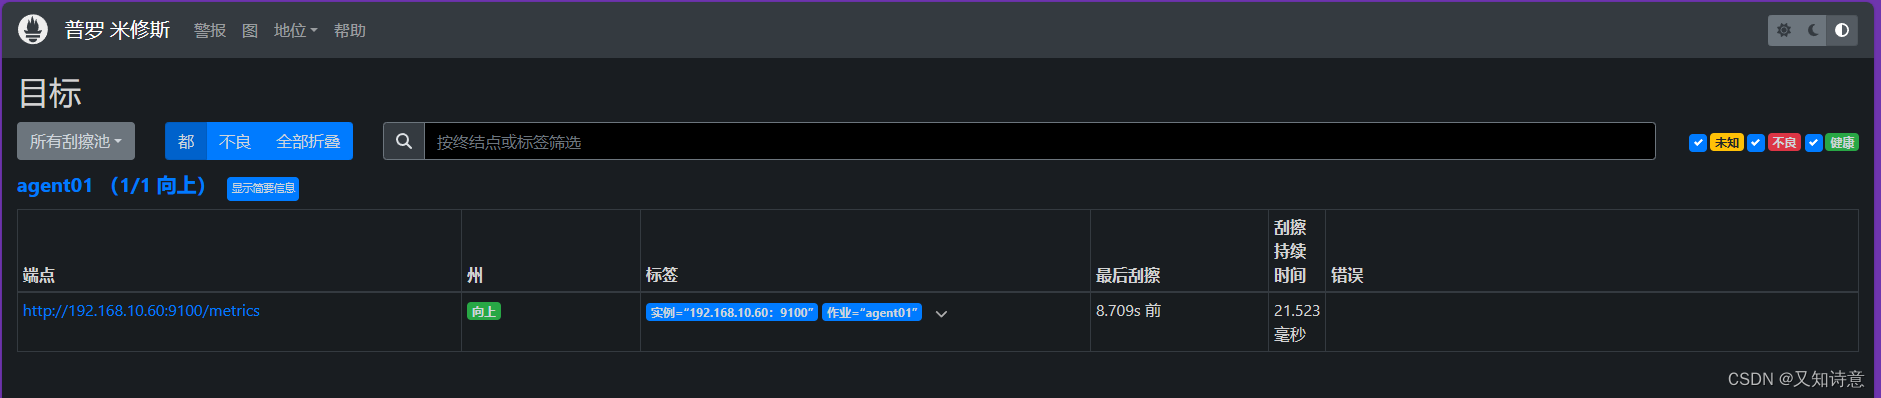
查看被监控端的状态
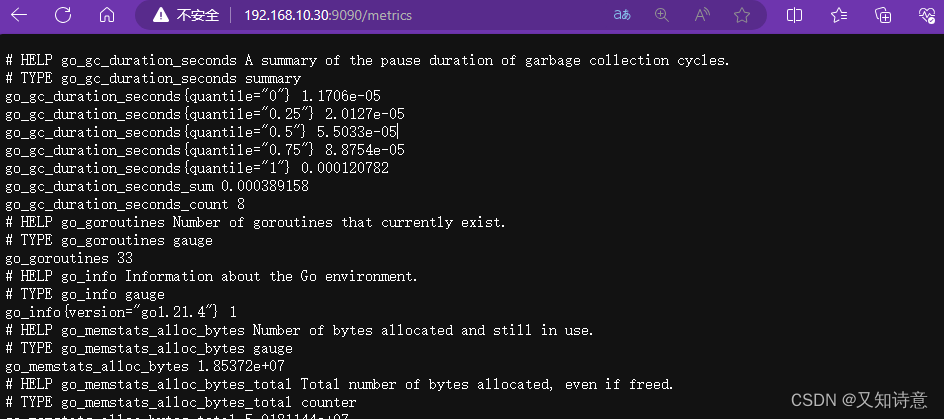
查看详细监控信息
http://192.168.10.30:9090/metrics
部署 node_exporter
在agent01
安装 node_exporter
hostnamectl set-hostname agent01
bash
sed -i 's/SELINUX=enforcing/SELINUX=disabled/' /etc/selinux/config
setenforce 0
systemctl stop firewalld
systemctl disable firewalld
传包node_exporter-1.7.0.linux-amd64.tar.gz
tar zxvf node_exporter-1.7.0.linux-amd64.tar.gz
mv node_exporter-1.7.0.linux-amd64 /usr/local/node_exporter
添加服务为系统服务
vim /usr/lib/systemd/system/node_exporter.service
[Unit]
Description=node_exporterAfter=network.target
[Service]
ExecStart=/usr/local/node_exporter/node_exporter
Restart=on-failure
[Install]
WantedBy=multi-user.target
systemctl daemon-reload
systemctl enable node_exporter
systemctl start node_exporter
netstat -anpt |grep 9100
备注:windows 主机的 exporter 程序监听的 9182 端口
在 Prometheus 服务端配置文件添加监控项
进入 Prometheus 配置文件添加 target
进入 Prometheus 安装目录下修改主配置文件
vim /usr/local/prometheus/prometheus.yml
- job_name: 'agent'
static_configs:
- targets: ['192.168.10.60:9100']
备注:
Linux 主机的 exporter 进程监听的是 TCP 9100 端口,windows 主机的 exporter 进程监听的 TCP9182 端口
systemctl restart prometheus.service
Grafana 的部署与应用
部署 Grafana
安装 Grafana
在Grafana上
hostnamectl set-hostname Grafana
bash
yum install -y grafana-enterprise-10.2.2-1.x86_64.rpm
systemctl start grafana-server
systemctl status grafana-server
systemctl enable grafana-server
sed -i 's/SELINUX=enforcing/SELINUX=disabled/' /etc/selinux/config
setenforce 0
systemctl stop firewalld
systemctl disable firewalld
http://192.168.10.40:3000/

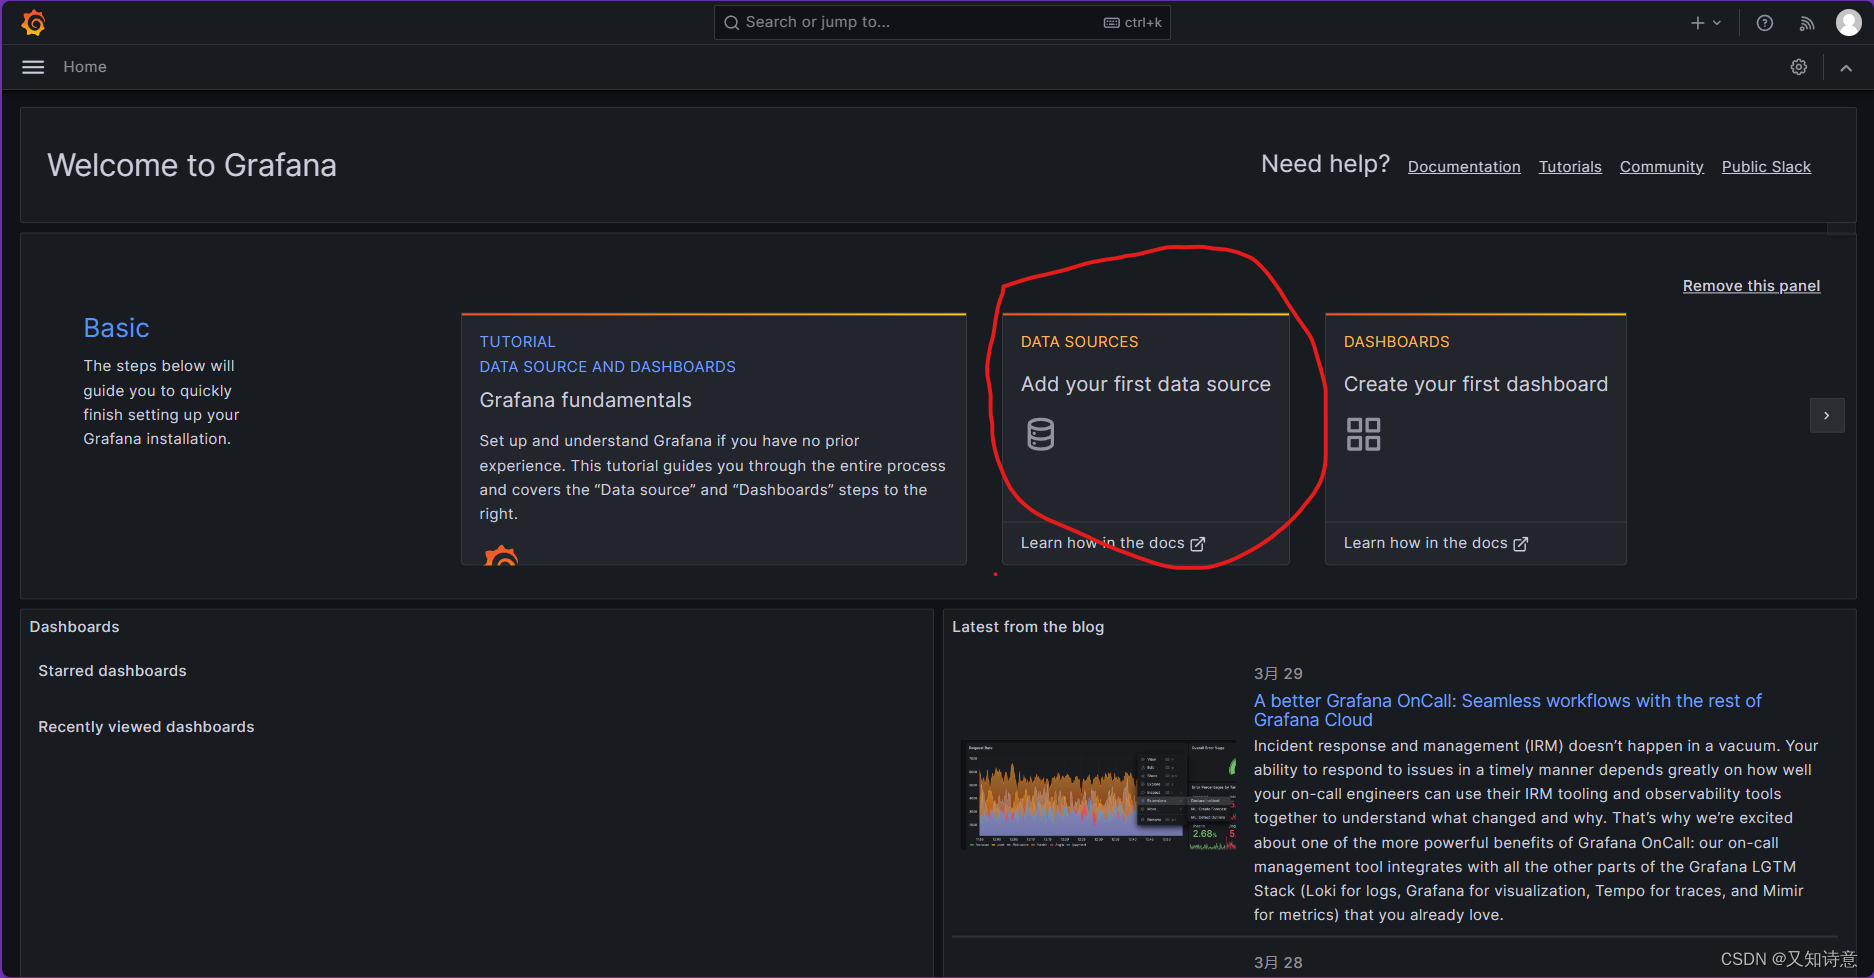
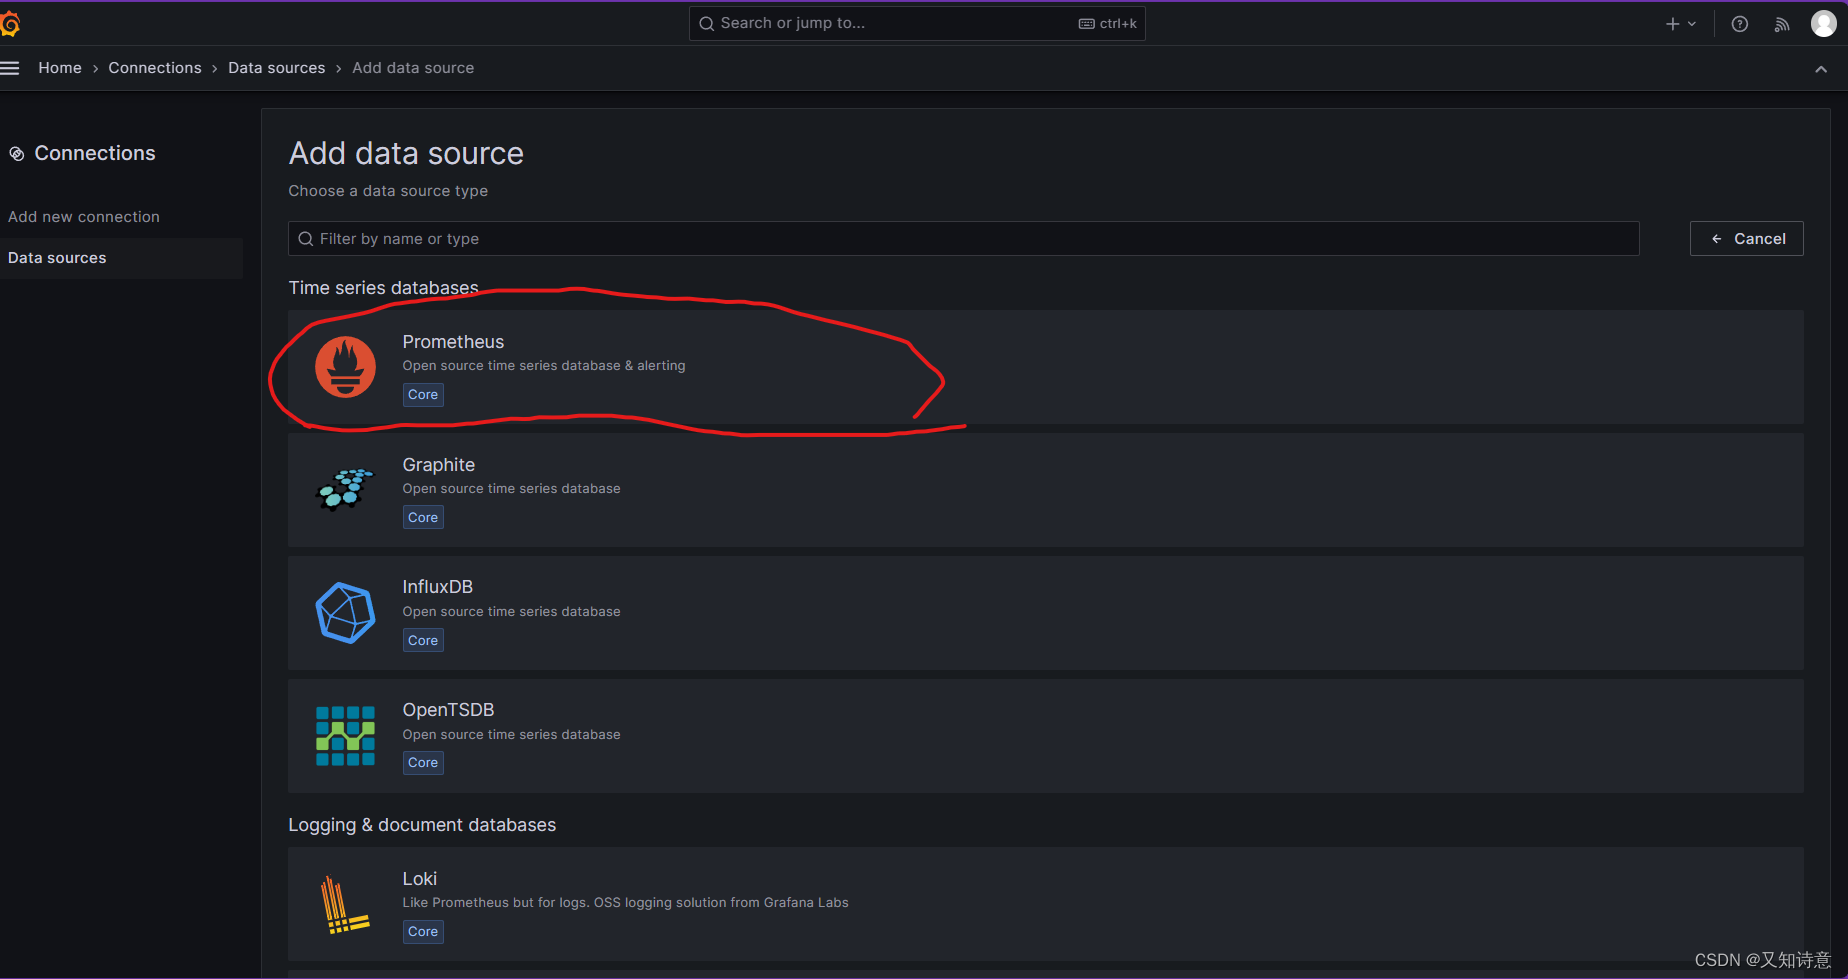
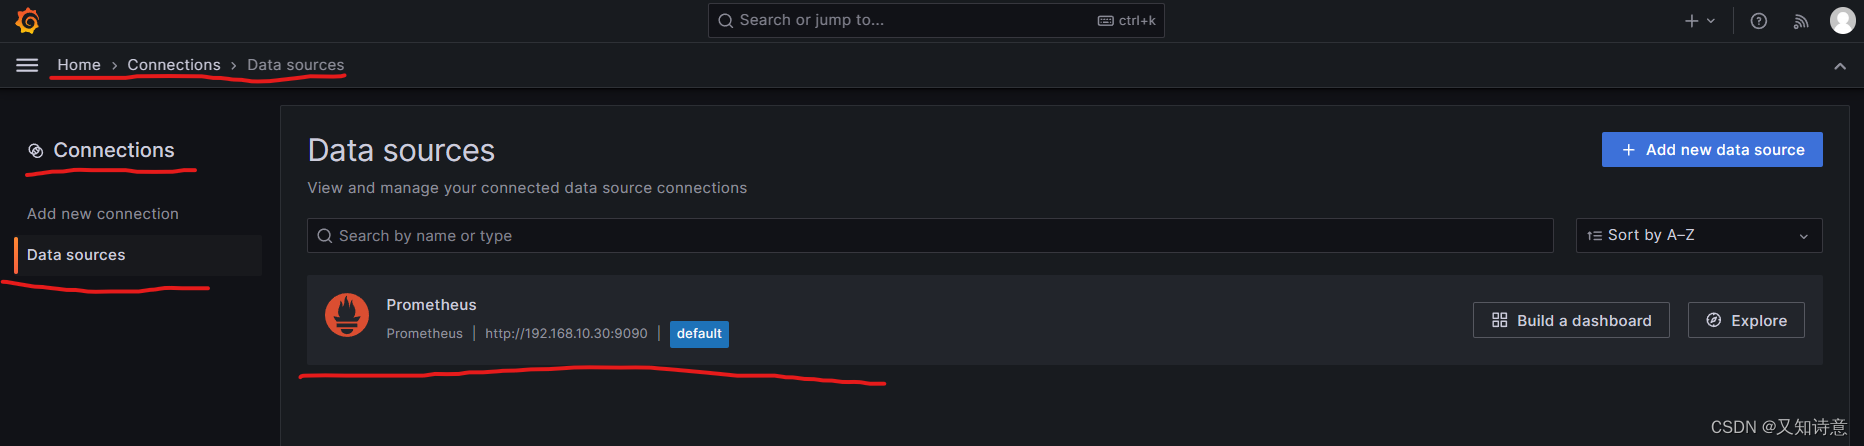
设置 Prometheus 为数据源
填写连接信息
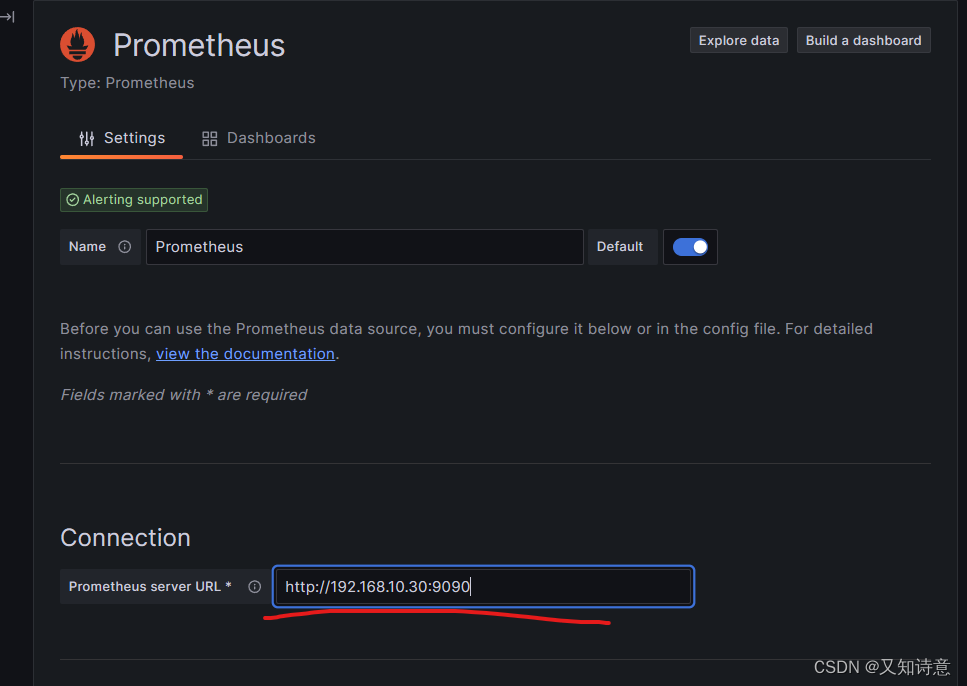
在页面底端点击保存并测试的按钮

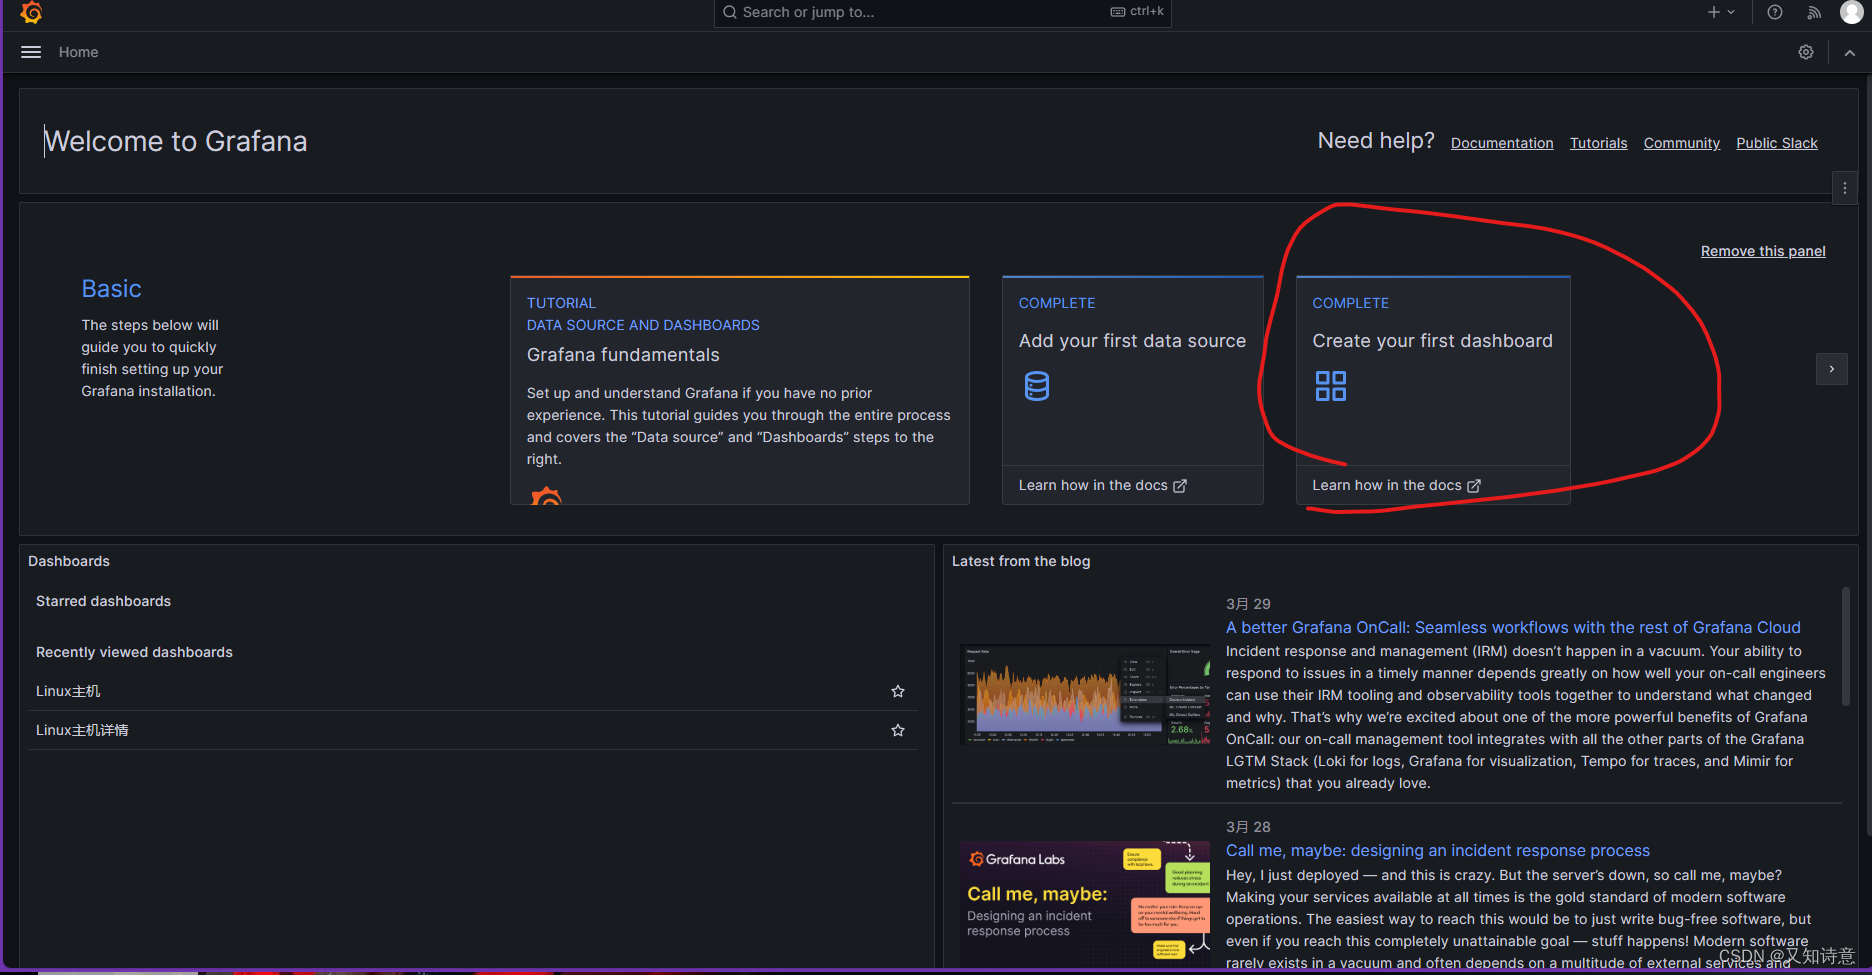
用导入模板的方法添加 Grafana 监控面板
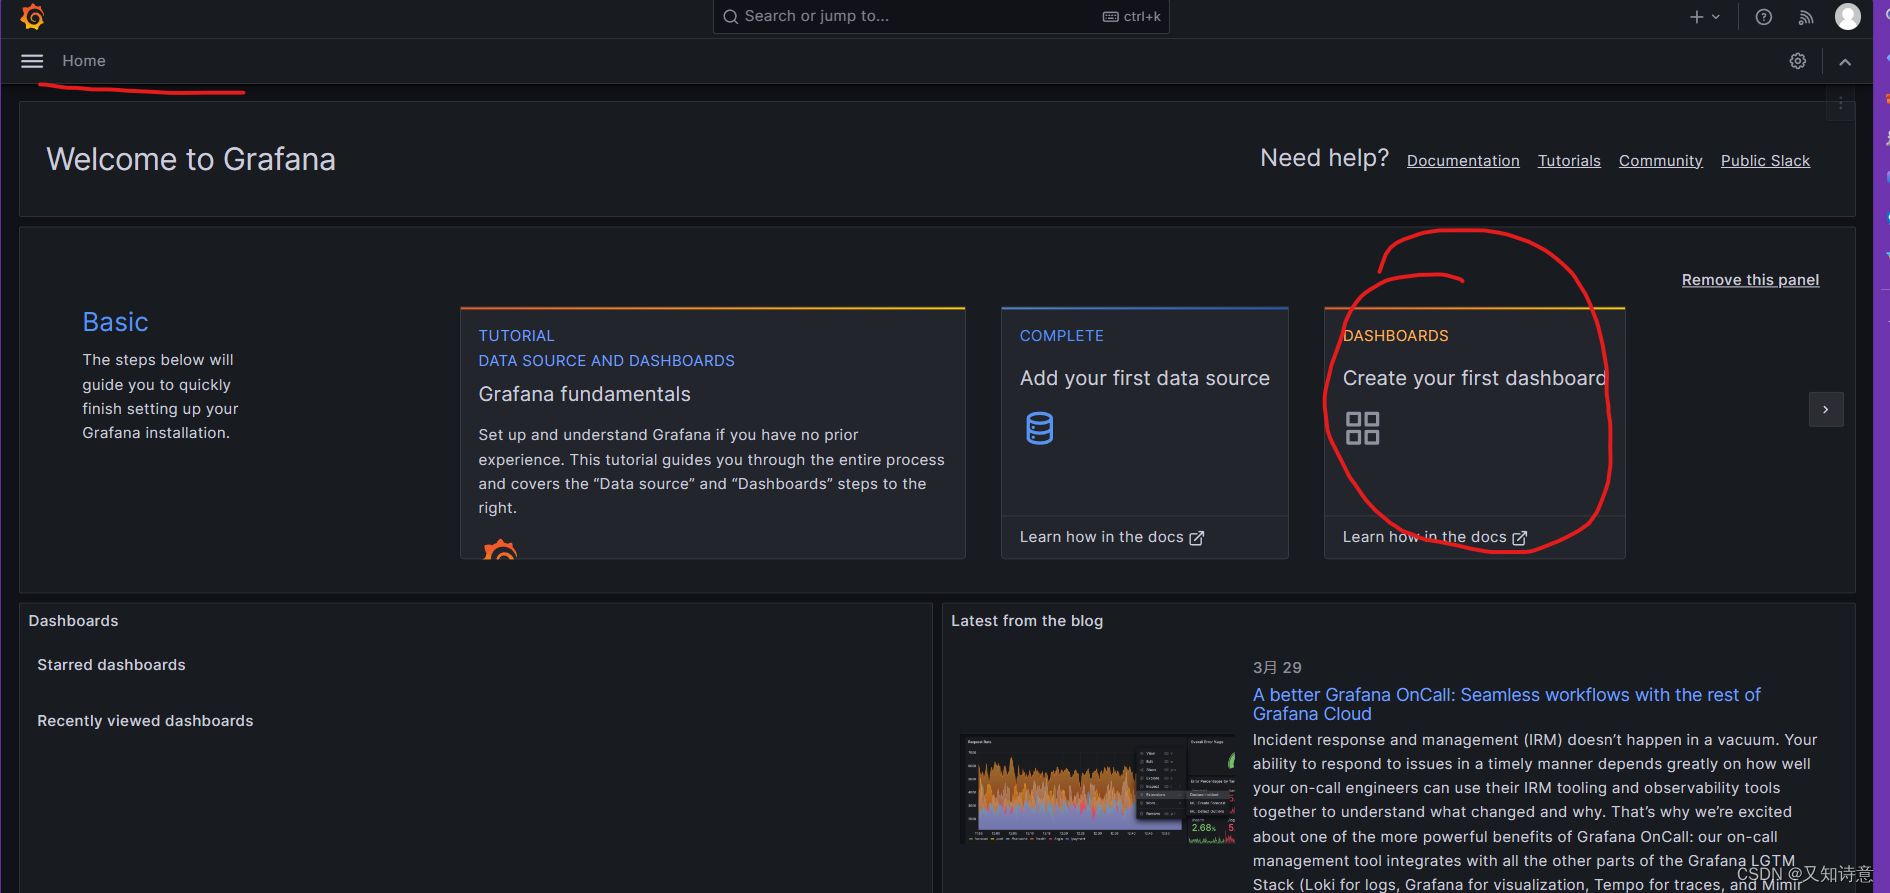
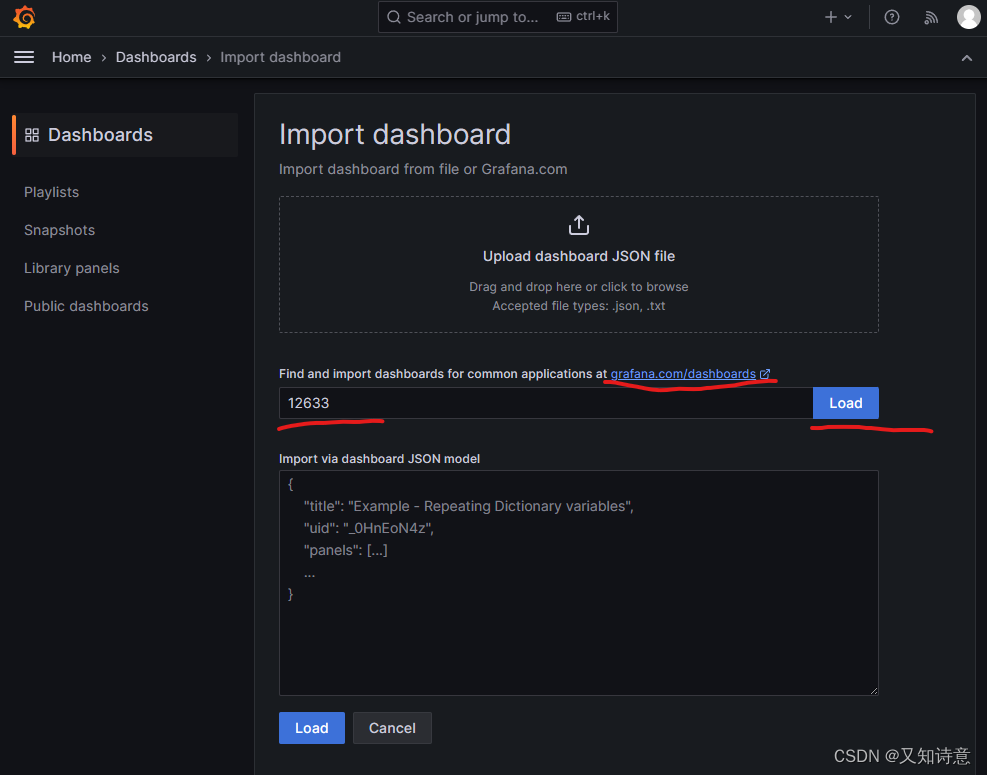
选择导入模板的方法

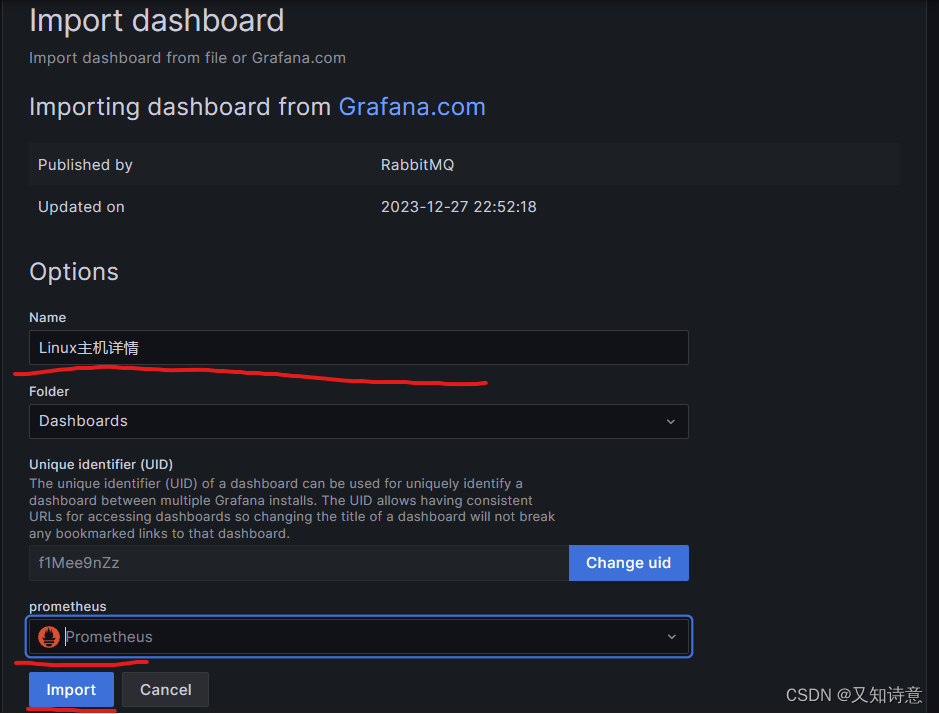
到官网选择模板复制模板id到id栏中
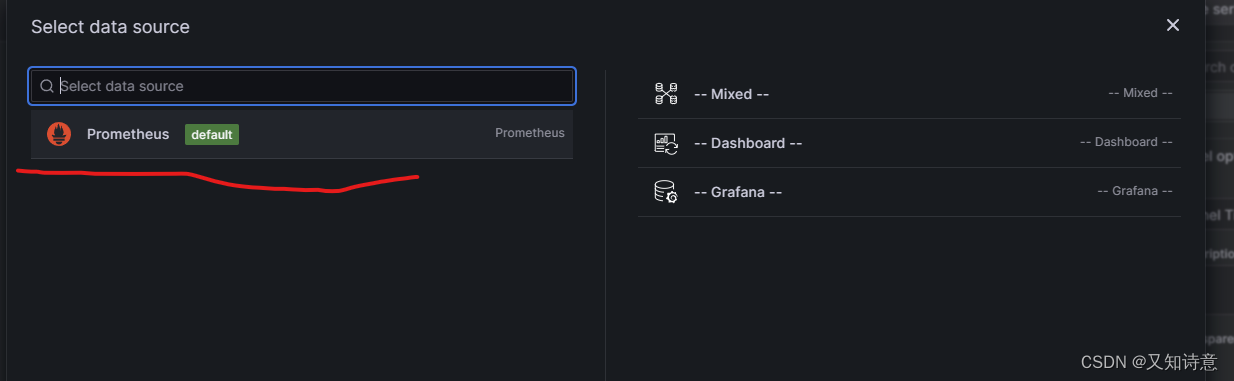
选择数据源
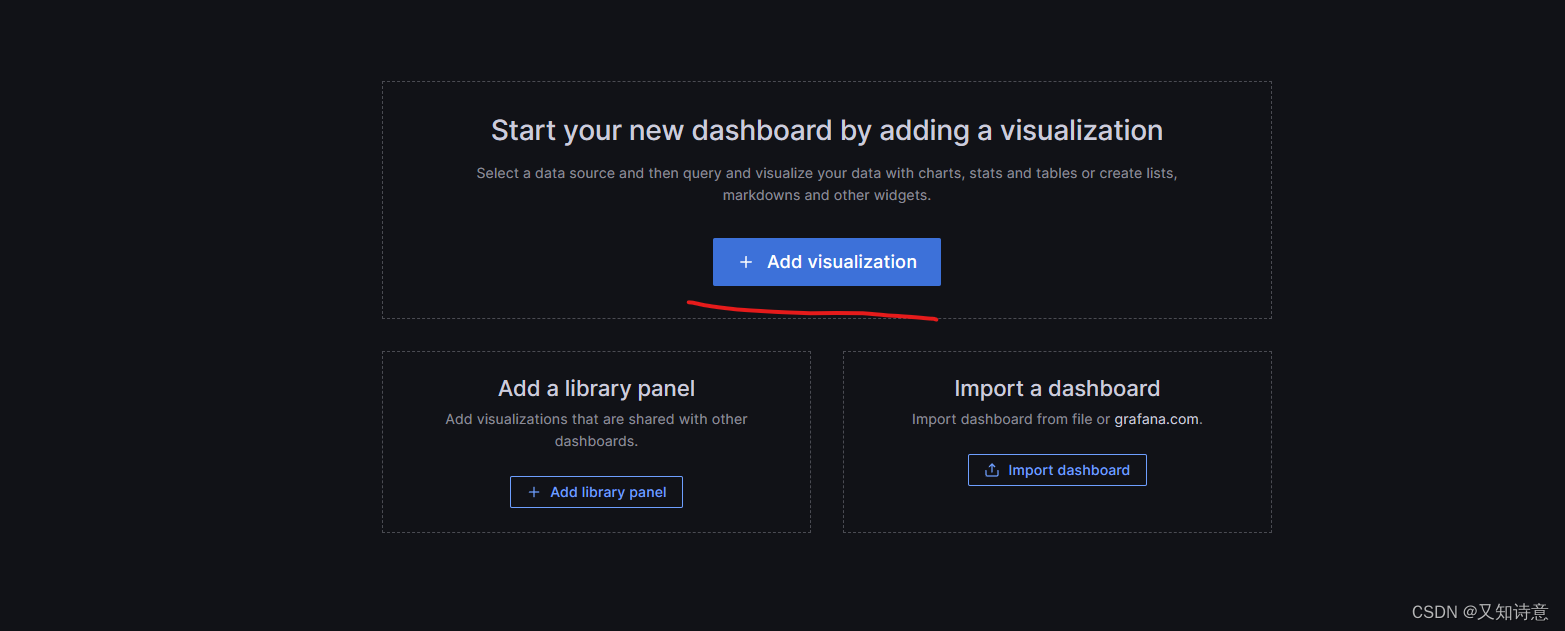
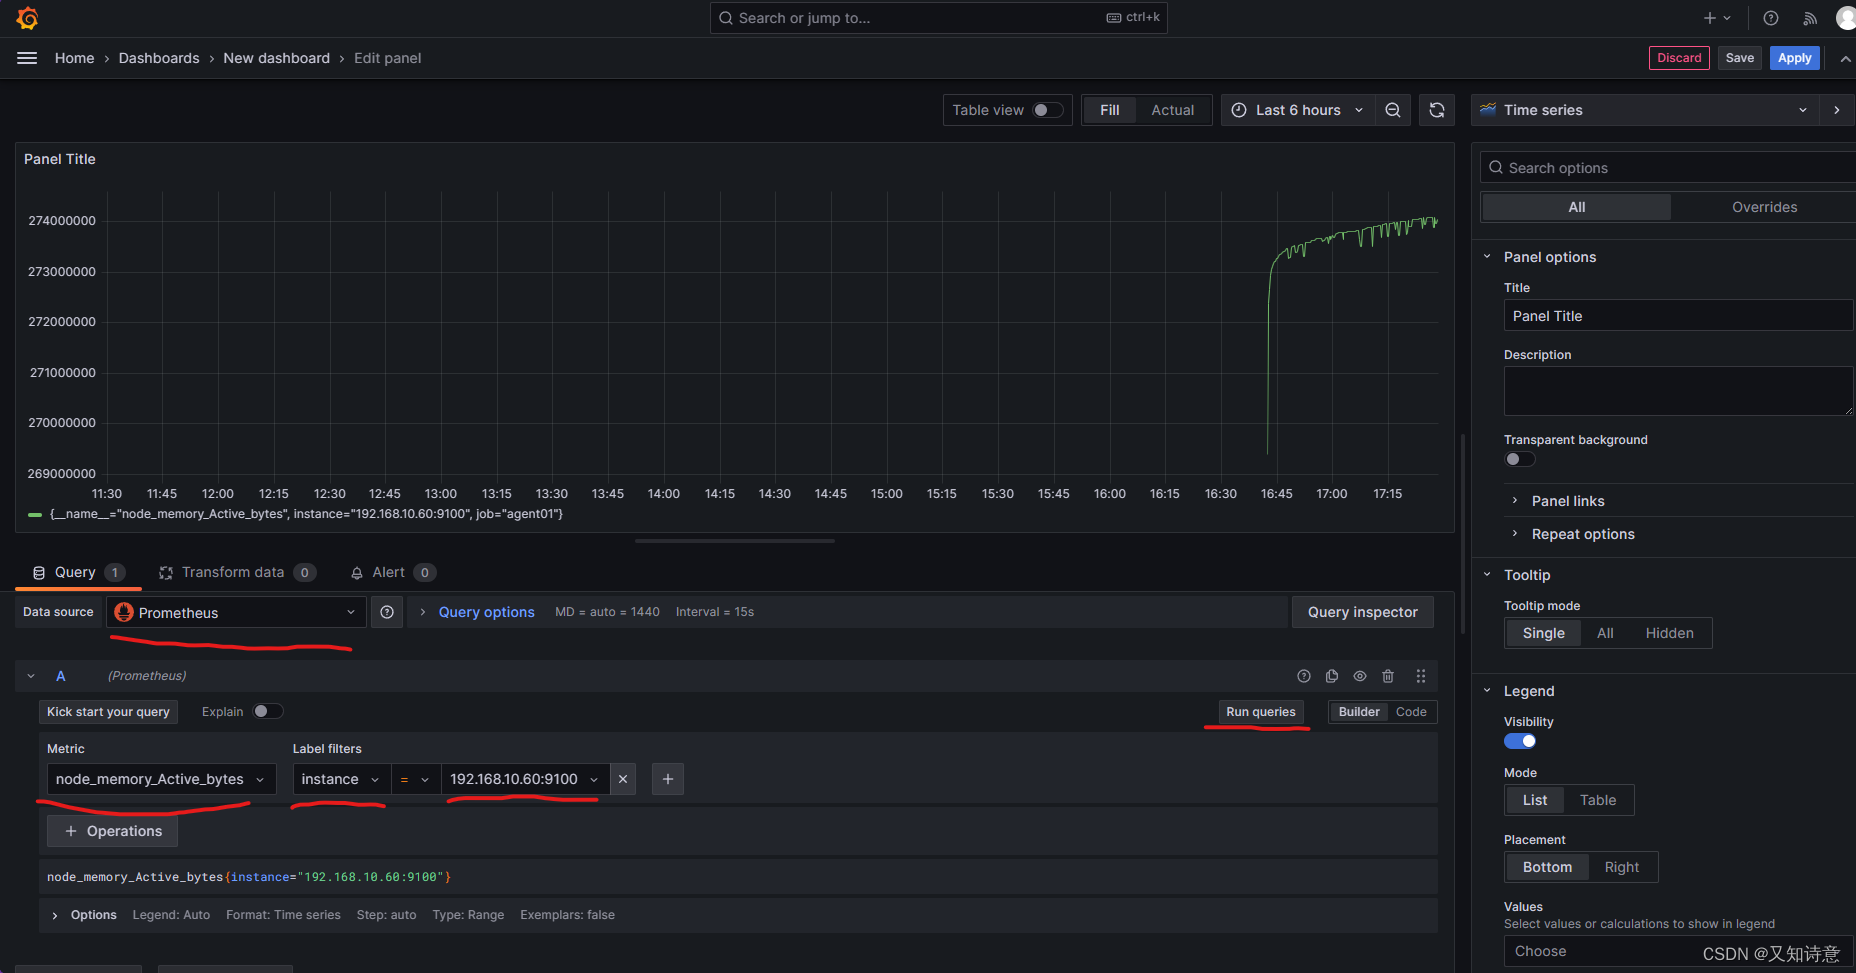
自定义 dashboard 监控面板
Prometheus 告警
安装告警组件 alertmanager
安装 alertmanager
传包 alertmanager-0.26.0.linux-amd64.tar.gz
tar zxvf alertmanager-0.26.0.linux-amd64.tar.gz
mv alertmanager-0.26.0.linux-amd64 /usr/local/alertmanager
添加 alertmanager 服务
vim /usr/lib/systemd/system/alertmanager.service
[Unit]
Description=alertmanager project,
After=network.target
[Service]
Type=simple
ExecStart=/usr/local/alertmanager/alertmanager --config.file=/usr/local/alertmanager/alertmanager.yml
--storage.path=/usr/local/alertmanager --web.listen-address=0.0.0.0:9093Restart=on-failure
[Install]
WantedBy=multi-user.target
systemctl daemon-reloa
systemctl start alertmanager
systemctl enable alertmanager
访问 alertmanager 的 WEB 页面
http://192.168.10.40:9093
在prometheus上配置
vim /usr/local/prometheus/prometheus.yml
- 192.168.10.40:9093 # 13行
检查 Prometheus 配置文件的语法
promtool check config /usr/local/prometheus/prometheus.yml
systemctl restart prometheus
netstat -anpt | grep 9090
在装有alertmanager的上
vim /usr/local/alertmanager/alertmanager.yml
global:
resolve_timeout: 5m
smtp_smarthost: 'smtp.qq.com:25'
smtp_from: '3384128450@qq.com'
smtp_auth_username: '3384128450@qq.com'
smtp_auth_password: 'mabxkaxugsfzdcaa'
smtp_hello: 'qq.com'
smtp_require_tls: false
route:
group_by: ['alertname']
group_wait: 10s
group_interval: 5s
repeat_interval: 60s
receiver: 'email'
receivers:
- name: 'email'
webhook_configs:
- url: 'http://127.0.0.1:5001/'
inhibit_rules:
- source_match:
severity: 'critical'
target_match:
severity: 'warning'
equal: ['alertname', 'dev', 'instance']
systemctl restart alertmanager
netstat -tunlp | grep alert
配置Prometheus,添加告警规则(在Prometheus上)
mkdir /usr/local/prometheus/rules
vim /usr/local/prometheus/prometheus.yml
- /usr/local/prometheus/rules/*.rules #在16
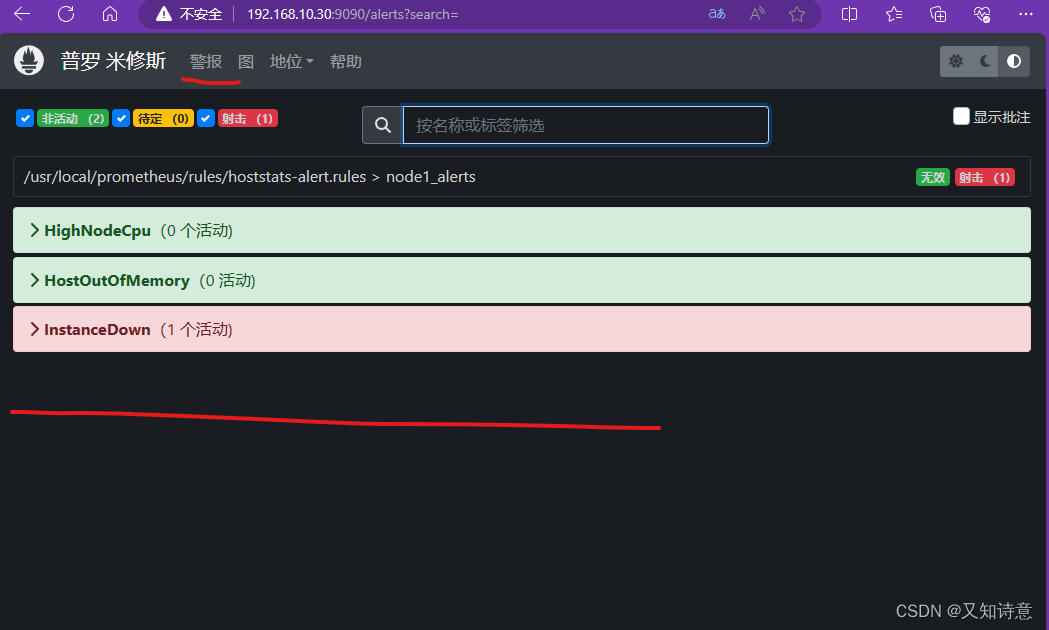
添加告警规则
vim /usr/local/prometheus/rules/hoststats-alert.rules
groups:- name: node1_alertsrules:- alert: HighNodeCpuexpr: instance:node_cpu:avg_rate1m > 10for: 1mlabels:severity: warningannotations:summary: Hgih Node CPU for 1 hourconsole: This is a Test- alert: HostOutOfMemoryexpr: node_memory_MemAvailable_bytes / node_memory_MemTotal_bytes * 100 < 10for: 2mlabels:severity: warnin
annotations:summary: Host out of memory (instance {{ $labels.instance }})description: "Node memory is filling up (< 10% left)\n VALUE = {{ $value }}\nLABELS = {{ $labels }}"- alert: InstanceDownexpr: up == 0for: 10slabels:severity: criticalannotations:summary: Host {{ $labels.instance }} of {{ $labels.job }} is Down!
systemctl restart prometheus


 241
241

 被折叠的 条评论
为什么被折叠?
被折叠的 条评论
为什么被折叠?
 到【灌水乐园】发言


