


使用函数有pcolor contourf
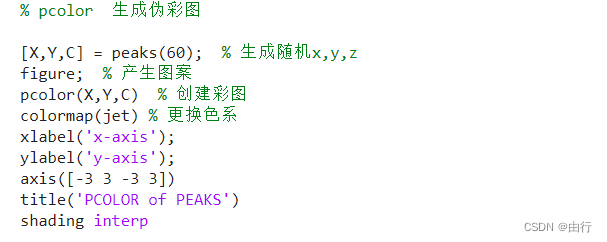
% pcolor 生成伪彩图
[X,Y,C] = peaks(60); % 生成随机x,y,z
figure; % 产生图案
pcolor(X,Y,C) % 创建彩图
colormap(jet) % 更换色系
xlabel('x-axis');
ylabel('y-axis');
axis([-3 3 -3 3])
title('PCOLOR of PEAKS')
shading interp
close
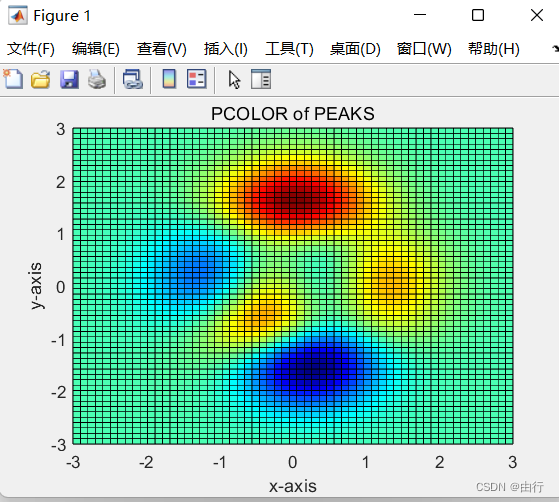
要是不想要网格线可以隐藏
![]()

% contourf 填充等值线
[X,Y,C] = peaks(60); % 生成随机x,y,z
figure;
NumContor = 15; % 设置
 最低0.47元/天 解锁文章


 1万+
1万+


 被折叠的 条评论
为什么被折叠?
被折叠的 条评论
为什么被折叠?
 到【灌水乐园】发言


