


一、使用echarts的好处和作用
ECharts 是一个强大的数据可视化库,主要用于在网页上创建丰富多彩的交互式图表和地图。一些 ECharts 的好处和作用包括:
好处:
-
丰富的图表类型:ECharts 提供了各种常见的图表类型,如折线图、柱状图、饼图、雷达图等,以及地图等特殊类型,能满足不同场景下的数据展示需求。
-
高度可定制性:用户可以通过配置选项来调整图表外观、交互方式等,实现个性化的定制化效果。
-
交互式:ECharts 支持丰富的交互功能,如数据筛选、数据缩放、图例切换等,让用户可以更直观地与数据进行互动。
-
跨平台兼容:ECharts 可以在不同的平台和设备上运行,并支持响应式设计,适配各种屏幕尺寸。
-
社区支持:ECharts 拥有庞大的开发者社区,提供了丰富的文档、示例和案例,方便用户学习和解决问题。
作用:
-
数据可视化:ECharts 可以帮助用户将复杂的数据通过图表展示出来,提升数据的可视化效果和理解性。
-
决策支持:通过直观的图表展示,可以帮助用户更快速地分析数据、发现规律,从而为决策提供支持。
-
数据监控:ECharts 可以实时更新数据并展示动态变化,适用于数据监控和实时数据展示的场景。
-
报告和演示:ECharts 可以生成美观的图表,适用于报告、演示等需要图形化展示数据的场景。
总的来说,ECharts 是一个功能强大的数据可视化库,能够帮助用户有效地展示和分析数据,提升用户对数据的理解和决策能力。
二、如何使用
1.首先,使用任何第三方的东西,首要的都是导入相关依赖。
上面这个是echart官网
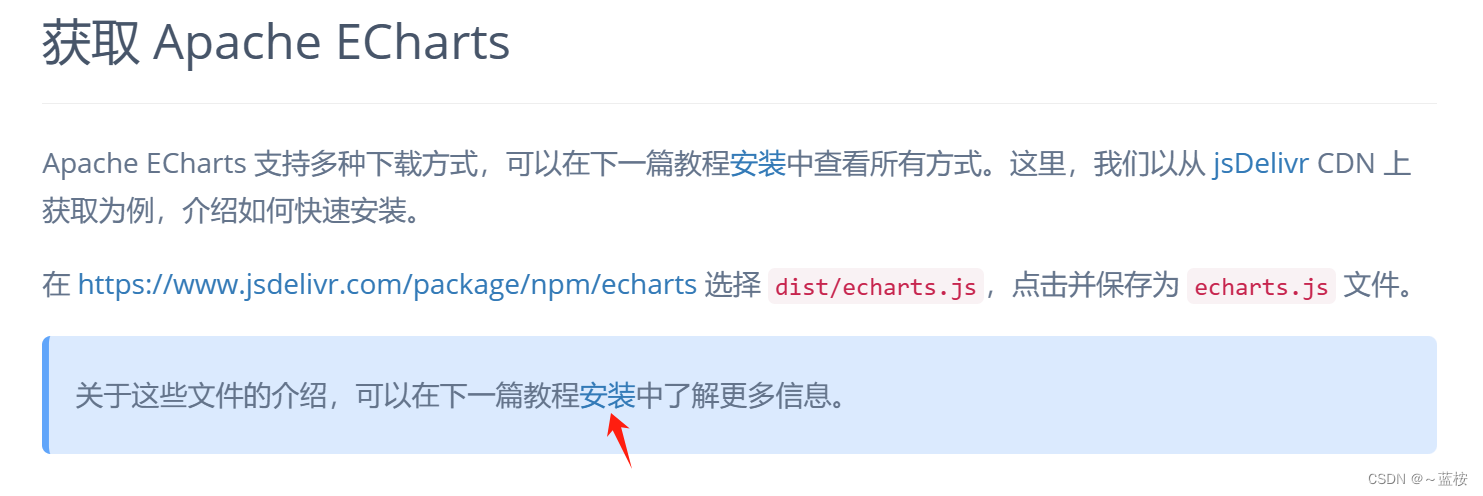
有多种安装方式,可以采用cdn的方式引入,或者使用npm包管理工具引入都可以,看你喜欢!
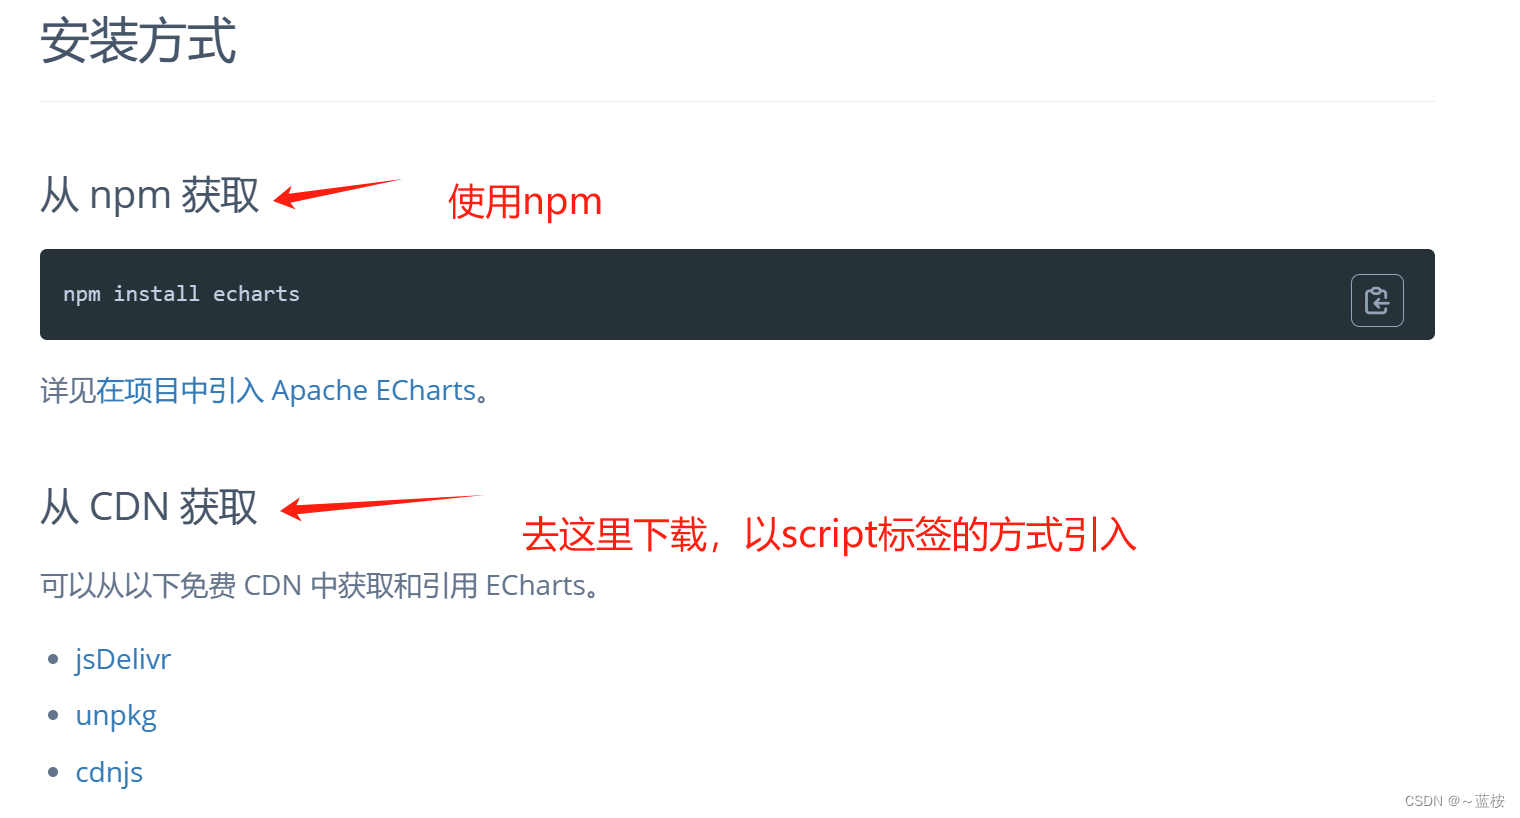
这里采用cdn的方式引入:

顺便准备一下jquery的js文件,可能echarts也是基于jq写的,俩者缺一不可!
复制链接去ctrl+s下载保存就行了!echarts - Libraries - cdnjs - The #1 free and open source CDN built to make life easier for developers
2.准备容器来放echarts展示的东西
<div id="chart1"></div>一般都使用id来指定,id具有唯一性,不容易造成容器混乱。
基础准备工作已就绪,接下来就是怎么配置使用!
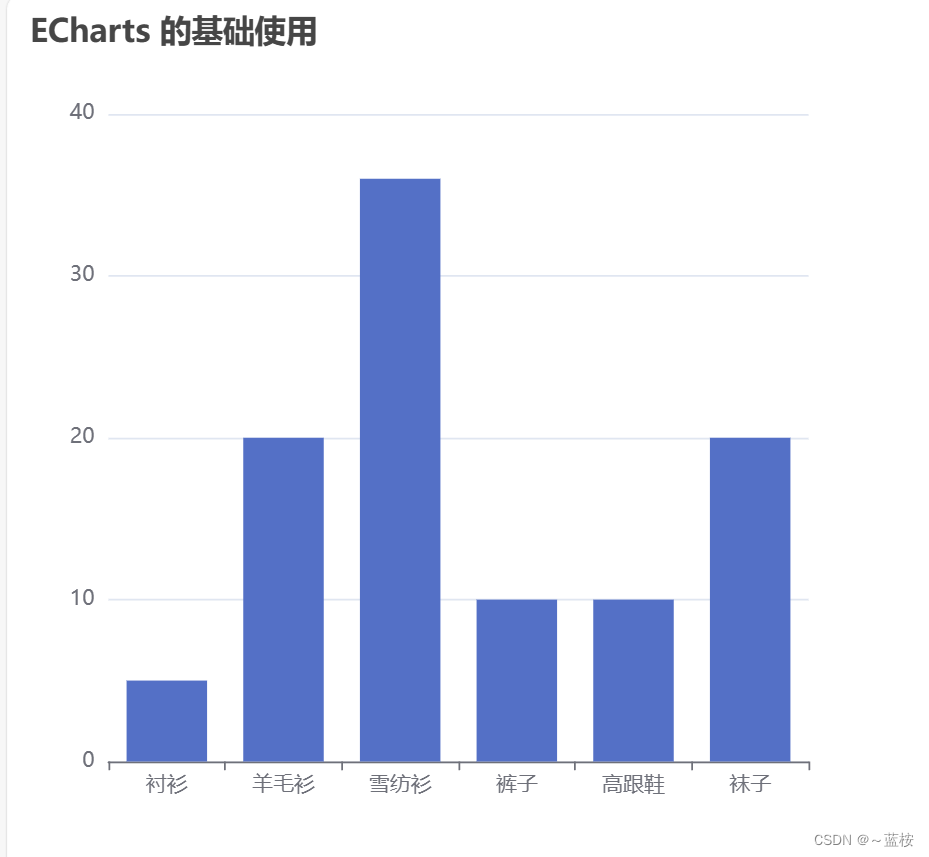
三、基础案例
我们先浅试一下官网的案例!
复制粘贴去体验一下就好了!
<script src="../js/echarts.min.js"></script>
  <script src="../js/jquery.min.js"></script>
<style>
#chart1,#chart2,#chart3 {
width: 500px;
height: 500px;
}
</style>
<body>
<!-- 基础案例 -->
<div id="chart1"></div>
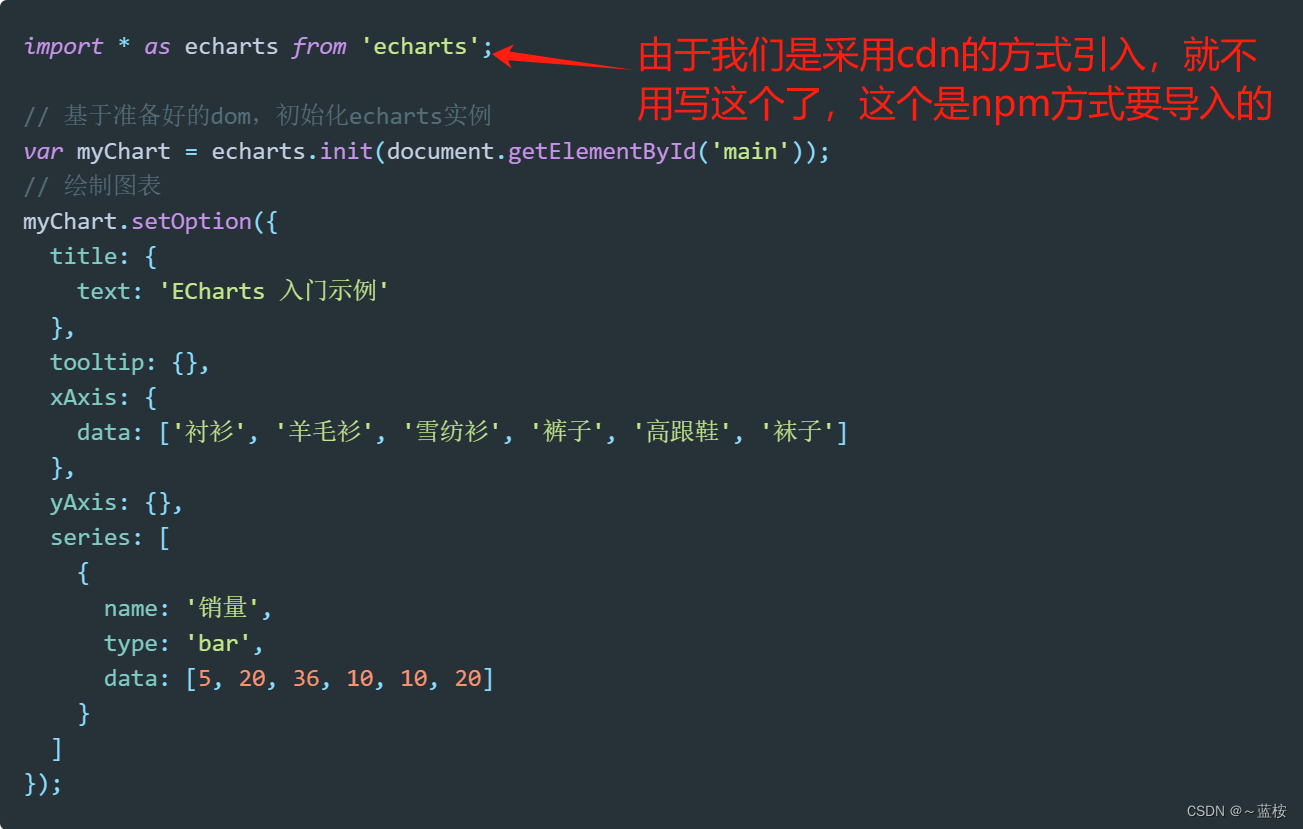
</body>// 第一种
// 基于准备好的dom,初始化echarts实例
var myChart = echarts.init(document.getElementById("chart1"));
// 绘制图表
myChart.setOption({
title: {
text: "ECharts 的基础使用",
},
tooltip: {},
xAxis: {
data: ["衬衫", "羊毛衫", "雪纺衫", "裤子", "高跟鞋", "袜子"],
},
yAxis: {},
series: [
{
name: "销量",
type: "bar",
data: [5, 20, 36, 10, 10, 20],
},
],
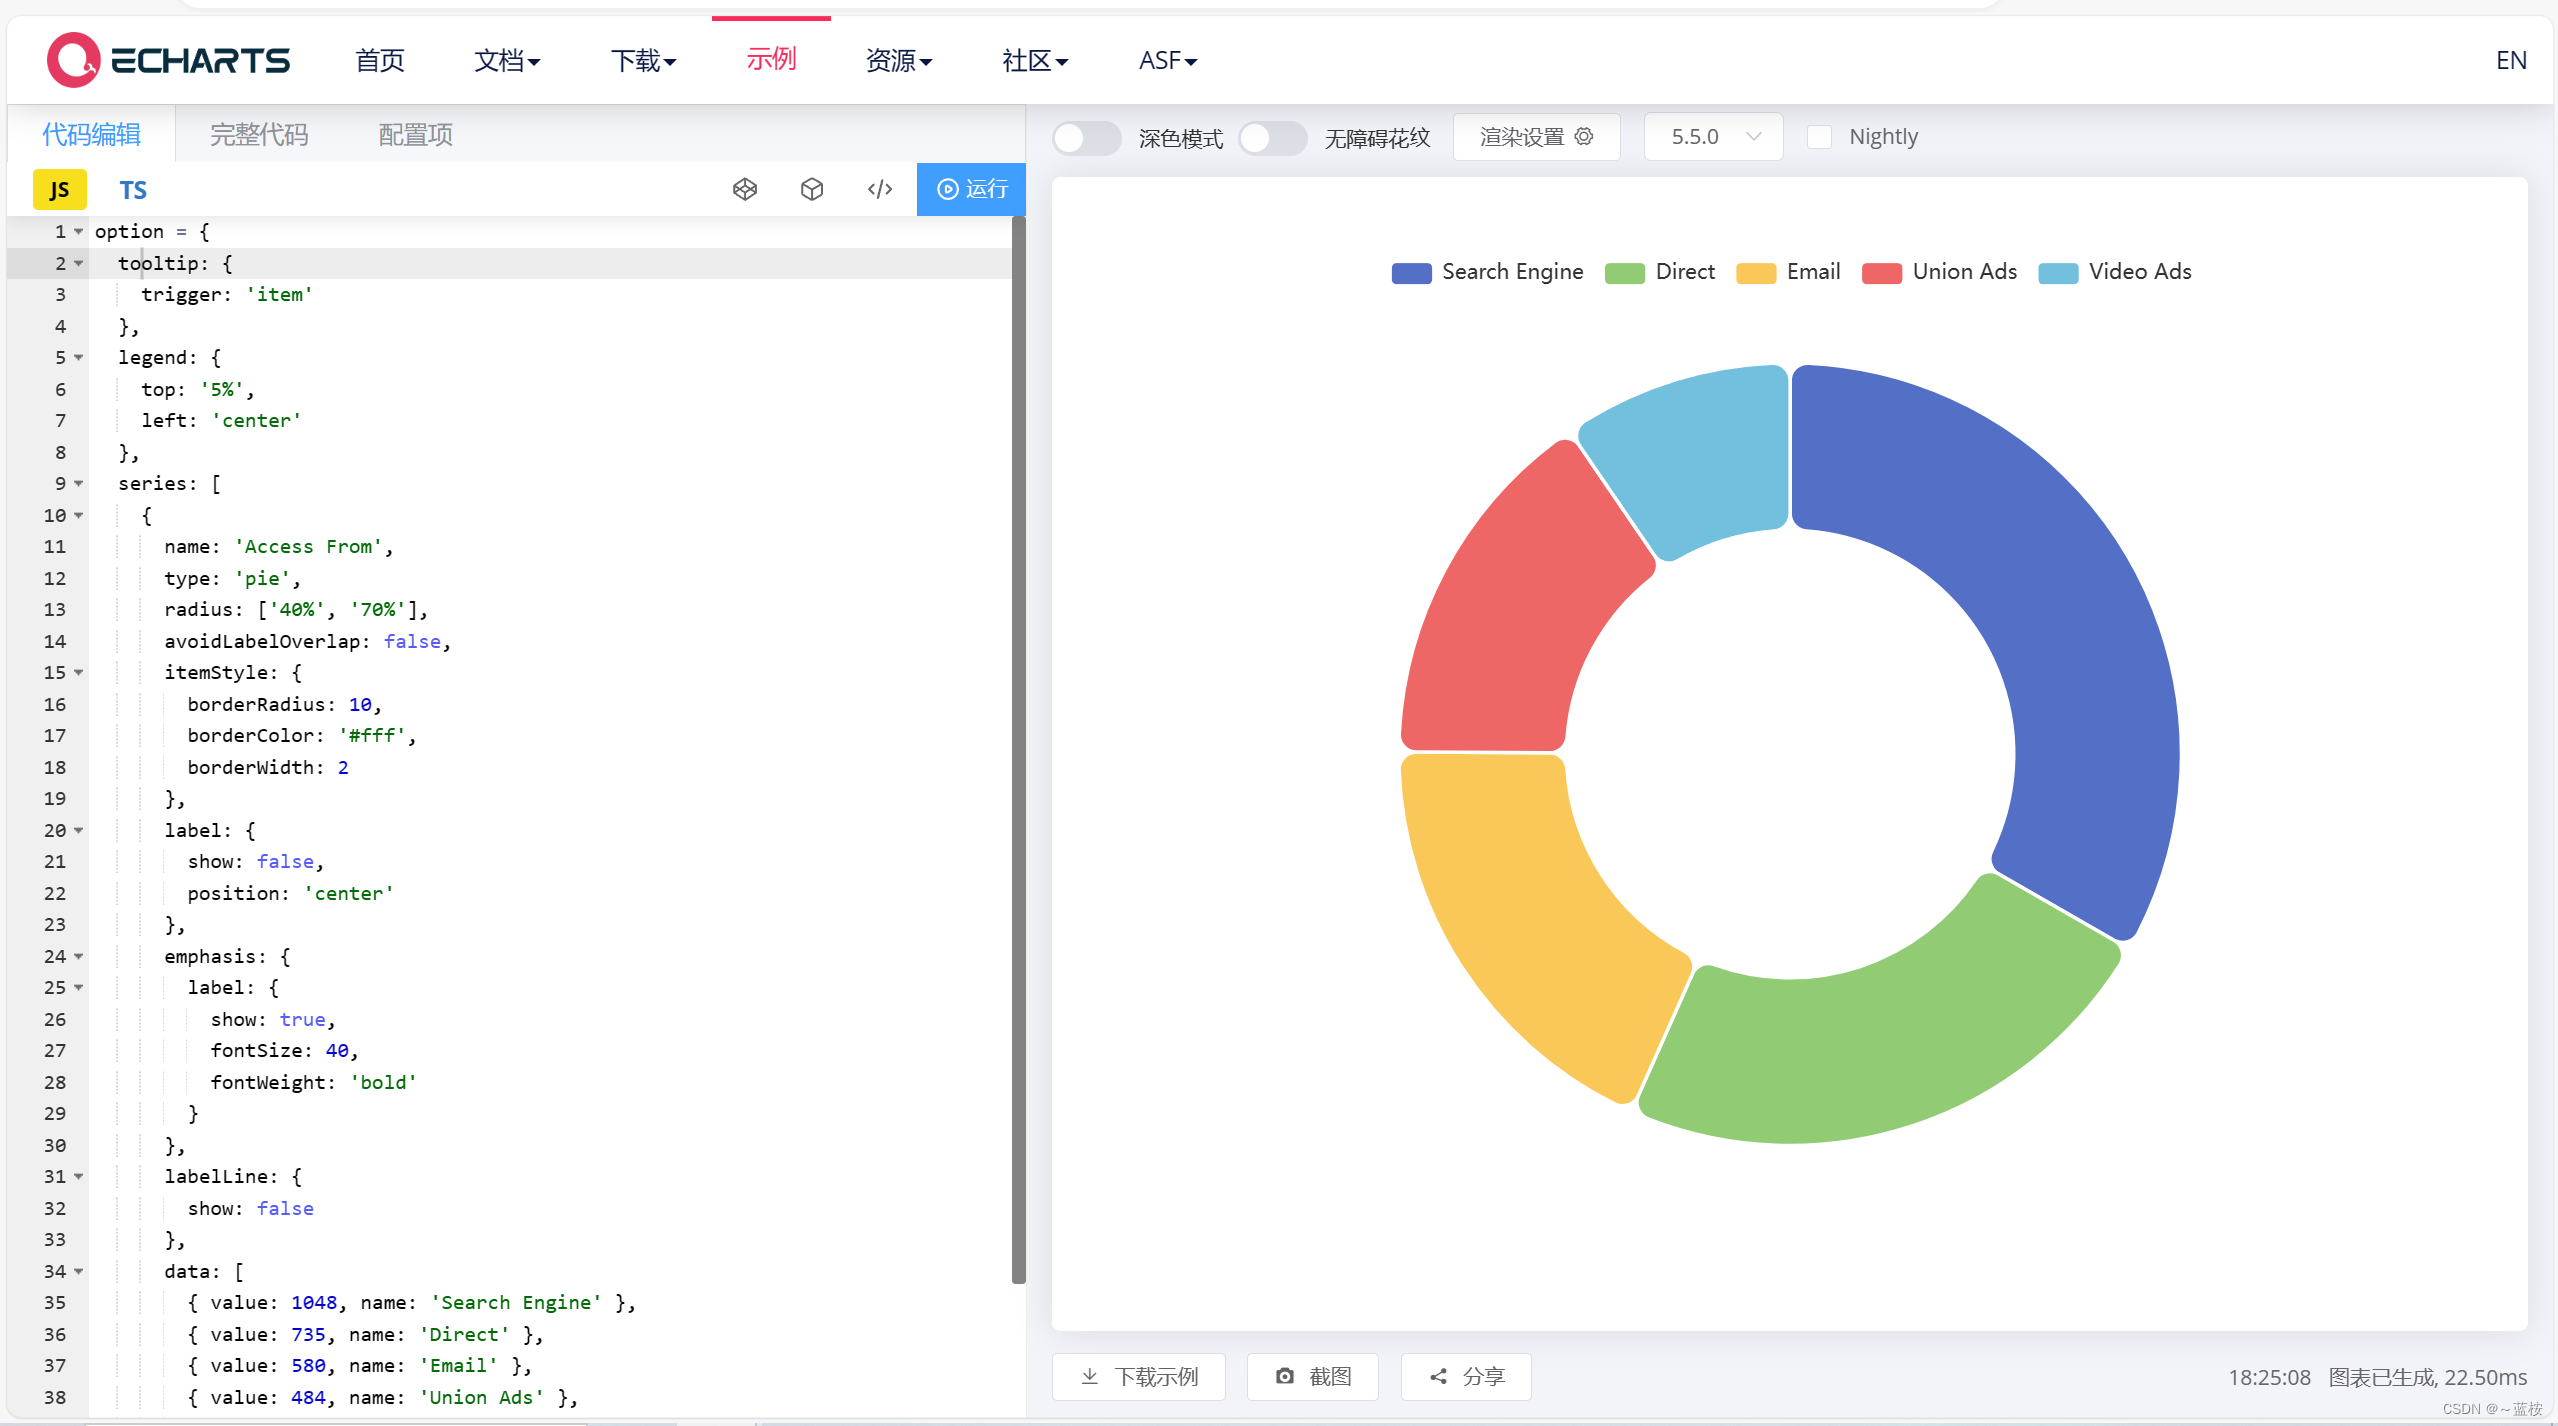
});四、更换option配置项案例
打卡官网示例,看需要使用哪个,这里随机挑一个做演示。

比如我看上了这个,左边有配置代码,也是复制粘贴的回事!全部复制过来。
<body>
<!-- 更换option配置项案例 -->
<div id="chart2"></div>
</body>// 第二种
// 基于准备好的dom,初始化echarts实例
var myEcharts2 = echarts.init(document.getElementById("chart2"));
// 绘制图表
var option = {
tooltip: {
trigger: "item",
},
legend: {
top: "5%",
left: "center",
},
series: [
{
name: "Access From",
type: "pie",
radius: ["40%", "70%"],
avoidLabelOverlap: false,
padAngle: 5,
itemStyle: {
borderRadius: 10,
},
label: {
show: false,
position: "center",
},
emphasis: {
label: {
show: true,
fontSize: 40,
fontWeight: "bold",
},
},
labelLine: {
show: false,
},
data: [
{ value: 1048, name: "Search Engine" },
{ value: 735, name: "Direct" },
{ value: 580, name: "Email" },
{ value: 484, name: "Union Ads" },
{ value: 300, name: "Video Ads" },
],
},
],
};
// 使用刚指定的配置项和数据显示图表。
myEcharts2.setOption(option);
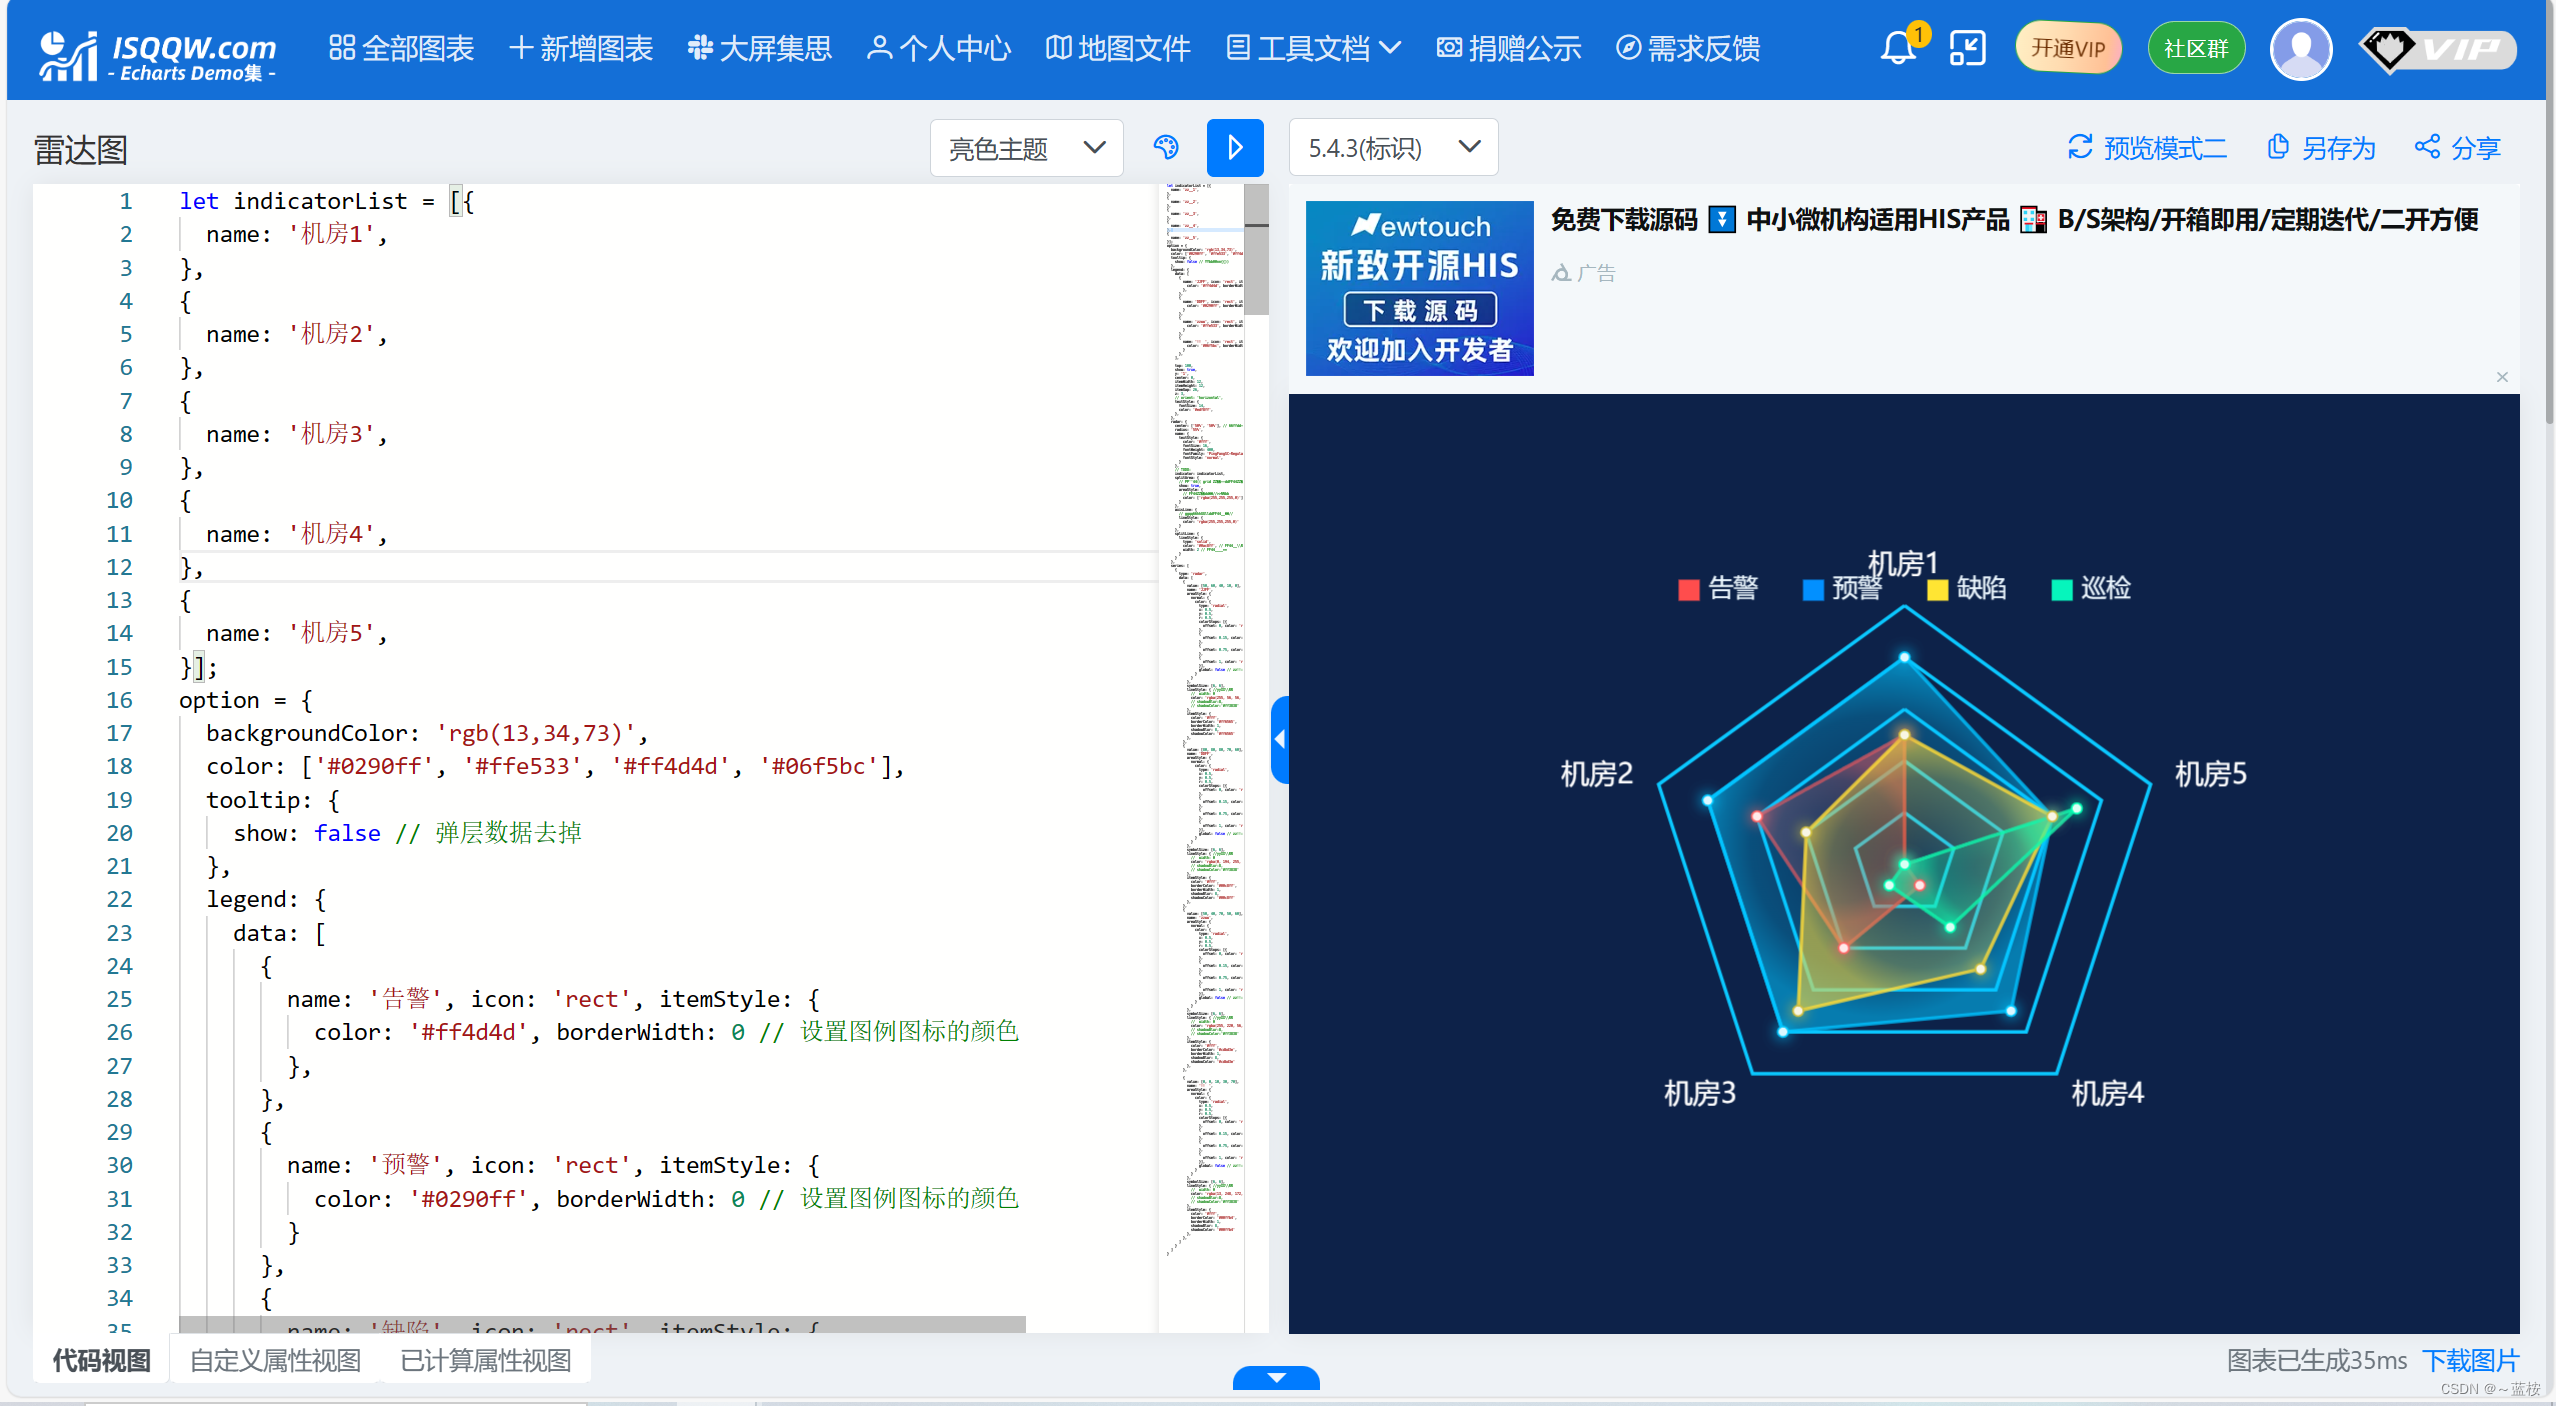
五、使用echart集的案例
有一个基于echarts的图表集网站,里面有更多的示例,比较丰富,更能满足需要。宝子网站。
首页 - ECharts图表集,ECharts demo集,echarts gallery社区,Make A Pie,分享你的可视化作品isqqw.com

挑 一个喜欢的,用得上的。

以这个做演示,点进去,也是复制代码的事情!
<body>
<!-- 使用echart集的案例 -->
<div id="chart3"></div>
</body>// 第三种
// 基于准备好的dom,初始化echarts实例
var myEcharts3 = echarts.init(document.getElementById("chart3"));
let indicatorList = [
{
name: "机房1",
},
{
name: "机房2",
},
{
name: "机房3",
},
{
name: "机房4",
},
{
name: "机房5",
},
];
var option2 = {
backgroundColor: "rgb(13,34,73)",
color: ["#0290ff", "#ffe533", "#ff4d4d", "#06f5bc"],
tooltip: {
show: false, // 弹层数据去掉
},
legend: {
data: [
{
name: "告警",
icon: "rect",
itemStyle: {
color: "#ff4d4d",
borderWidth: 0, // 设置图例图标的颜色
},
},
{
name: "预警",
icon: "rect",
itemStyle: {
color: "#0290ff",
borderWidth: 0, // 设置图例图标的颜色
},
},
{
name: "缺陷",
icon: "rect",
itemStyle: {
color: "#ffe533",
borderWidth: 0, // 设置图例图标的颜色
},
},
{
name: "巡检",
icon: "rect",
itemStyle: {
color: "#06f5bc",
borderWidth: 0, // 设置图例图标的颜色
},
},
],
top: 100,
show: true,
y: "1",
center: 0,
itemWidth: 12,
itemHeight: 12,
itemGap: 26,
z: 3,
// orient: 'horizontal',
textStyle: {
fontSize: 14,
color: "#edf8ff",
},
},
radar: {
center: ["50%", "50%"], // 外圆的位置
radius: "55%",
name: {
textStyle: {
color: "#fff",
fontSize: 16,
fontWeight: 400,
fontFamily: "PingFangSC-Regular,PingFang SC",
fontStyle: "normal",
},
},
// TODO:
indicator: indicatorList,
splitArea: {
// 坐标轴在 grid 区域中的分隔区域,默认不显示。
show: true,
areaStyle: {
// 分隔区域的样式设置。
color: ["rgba(255,255,255,0)"], // 分隔区域颜色。分隔区域会按数组中颜色的顺序依次循环设置颜色。默认是一个深浅的间隔色。
},
},
axisLine: {
// 指向外圈文本的分隔线样式
lineStyle: {
color: "rgba(255,255,255,0)",
},
},
splitLine: {
lineStyle: {
type: "solid",
color: "#0ac8ff", // 分隔线颜色
width: 2, // 分隔线线宽
},
},
},
series: [
{
type: "radar",
data: [
{
value: [50, 60, 40, 10, 0],
name: "告警",
areaStyle: {
normal: {
color: {
type: "radial",
x: 0.5,
y: 0.5,
r: 0.5,
colorStops: [
{
offset: 0,
color: "rgba(255, 56, 56, 0.14)", // 0% 处的颜色
},
{
offset: 0.15,
color: "rgba(255, 56, 56, 0.14)", // 100% 处的颜色
},
{
offset: 0.75,
color: "rgba(255, 56, 56, 0.4)", // 100% 处的颜色
},
{
offset: 1,
color: "rgba(255, 56, 56, 0.8)", // 100% 处的颜色
},
],
global: false, // 缺省为 false
},
},
},
symbolSize: [6, 6],
lineStyle: {
//边缘颜色
// width: 0
color: "rgba(255, 56, 56, 0.8)",
// shadowBlur:8,
// shadowColor:'#ff3838'
},
itemStyle: {
color: "#fff",
borderColor: "#ff6565",
borderWidth: 1,
shadowBlur: 8,
shadowColor: "#ff6565",
},
},
{
value: [80, 80, 80, 70, 60],
name: "预警",
areaStyle: {
normal: {
color: {
type: "radial",
x: 0.5,
y: 0.5,
r: 0.5,
colorStops: [
{
offset: 0,
color: "rgba(0,194,255, 0.14)", // 0% 处的颜色
},
{
offset: 0.15,
color: "rgba(0,194,255, 0.14)", // 100% 处的颜色
},
{
offset: 0.75,
color: "rgba(0,194,255, 0.4)", // 100% 处的颜色
},
{
offset: 1,
color: "rgba(0,194,255, 0.8)", // 100% 处的颜色
},
],
global: false, // 缺省为 false
},
},
},
symbolSize: [6, 6],
lineStyle: {
//边缘颜色
// width: 0
color: "rgba(0, 194, 255, 0.8)",
// shadowBlur:8,
// shadowColor:'#ff3838'
},
itemStyle: {
color: "#fff",
borderColor: "#00c8ff",
borderWidth: 1,
shadowBlur: 8,
shadowColor: "#00c8ff",
},
},
{
value: [50, 40, 70, 50, 60],
name: "缺陷",
areaStyle: {
normal: {
color: {
type: "radial",
x: 0.5,
y: 0.5,
r: 0.5,
colorStops: [
{
offset: 0,
color: "rgba(255, 220, 56, 0.14)", // 0% 处的颜色
},
{
offset: 0.15,
color: "rgba(255, 220, 56, 0.14)", // 100% 处的颜色
},
{
offset: 0.75,
color: "rgba(255, 220, 56, 0.4)", // 100% 处的颜色
},
{
offset: 1,
color: "rgba(255, 220, 56, 0.8)", // 100% 处的颜色
},
],
global: false, // 缺省为 false
},
},
},
symbolSize: [6, 6],
lineStyle: {
//边缘颜色
// width: 0
color: "rgba(255, 220, 56, 0.8)",
// shadowBlur:8,
// shadowColor:'#ff3838'
},
itemStyle: {
color: "#fff",
borderColor: "#cdbd3e",
borderWidth: 1,
shadowBlur: 8,
shadowColor: "#cdbd3e",
},
},
{
value: [0, 0, 10, 30, 70],
name: "巡检",
areaStyle: {
normal: {
color: {
type: "radial",
x: 0.5,
y: 0.5,
r: 0.5,
colorStops: [
{
offset: 0,
color: "rgba(13, 248, 172, 0.14)", // 0% 处的颜色
},
{
offset: 0.15,
color: "rgba(13, 248, 172, 0.14)", // 100% 处的颜色
},
{
offset: 0.75,
color: "rgba(13, 248, 172, 0.4)", // 100% 处的颜色
},
{
offset: 1,
color: "rgba(13, 248, 172, 0.8)", // 100% 处的颜色
},
],
global: false, // 缺省为 false
},
},
},
symbolSize: [6, 6],
lineStyle: {
//边缘颜色
// width: 0
color: "rgba(13, 248, 172, 0.8)",
// shadowBlur:8,
// shadowColor:'#ff3838'
},
itemStyle: {
color: "#fff",
borderColor: "#00ffb4",
borderWidth: 1,
shadowBlur: 8,
shadowColor: "#00ffb4",
},
},
],
},
],
};
// 使用刚指定的配置项和数据显示图表。
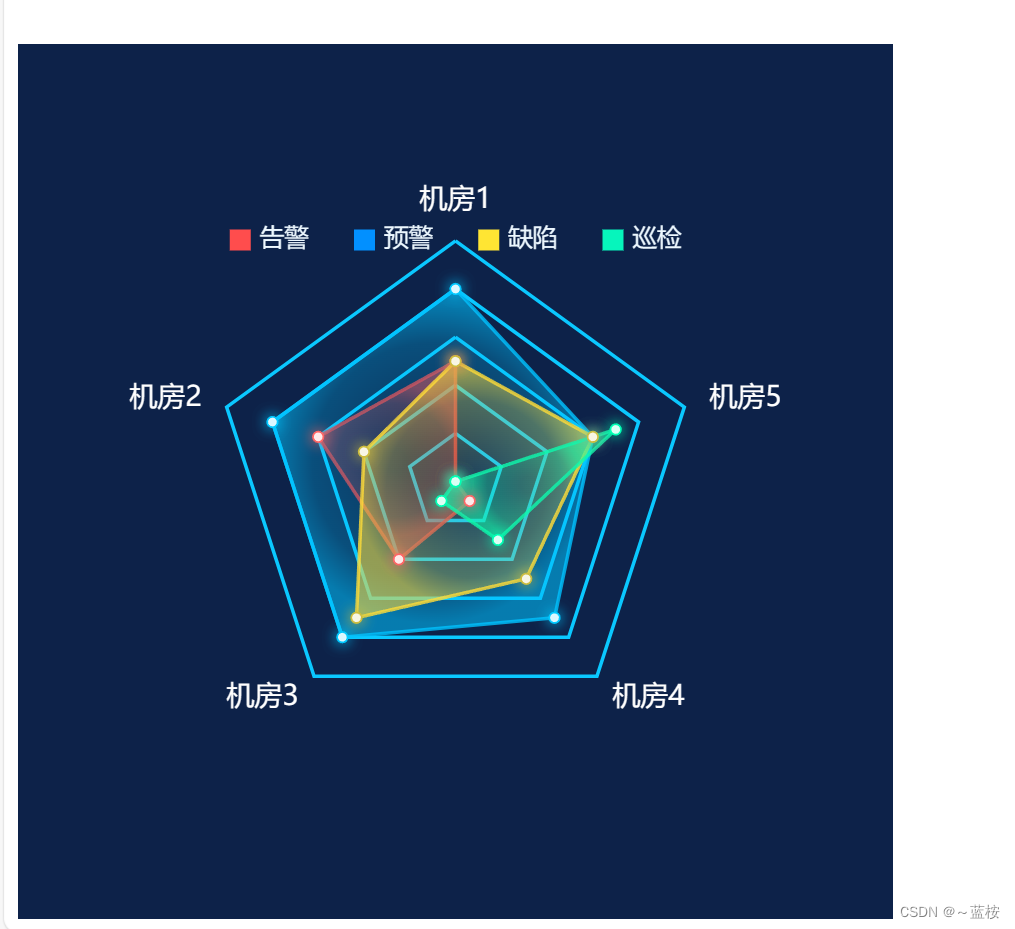
myEcharts3.setOption(option2);实现的样子:

六、自定义配置
如何使用人家的不满足,需要自定义一些样式信息和展示的信息,就要参考官方文档进行修改。

Documentation - Apache ECharts
还可以在这里直接改代码看效果。

七、demo全部代码
<!DOCTYPE html>
<html lang="en">
<head>
<meta charset="UTF-8" />
<meta name="viewport" content="width=device-width, initial-scale=1.0" />
<title>Document</title>
</head>
<script src="../js/echarts.min.js"></script>
<script src="../js/jquery.min.js"></script>
<style>
#chart1,
#chart2,
#chart3 {
width: 500px;
height: 500px;
}
</style>
<body>
<!-- 基础案例 -->
<div id="chart1"></div>
<!-- 更换option配置项案例 -->
<div id="chart2"></div>
<!-- 使用echart集的案例 -->
<div id="chart3"></div>
</body>
</html>
<script>
// 第一种
  // 基于准备好的dom,初始化echarts实例
  var myChart = echarts.init(document.getElementById("chart1"));
  // 绘制图表
  myChart.setOption({
    title: {
      text: "ECharts 的基础使用",
    },
    tooltip: {},
    xAxis: {
      data: ["衬衫", "羊毛衫", "雪纺衫", "裤子", "高跟鞋", "袜子"],
    },
    yAxis: {},
    series: [
      {
        name: "销量",
        type: "bar",
        data: [5, 20, 36, 10, 10, 20],
      },
    ],
  });
//   第二种
  // 基于准备好的dom,初始化echarts实例
  var myEcharts2 = echarts.init(document.getElementById("chart2"));
  // 绘制图表
  var option = {
    tooltip: {
      trigger: "item",
    },
    legend: {
      top: "5%",
      left: "center",
    },
    series: [
      {
        name: "Access From",
        type: "pie",
        radius: ["40%", "70%"],
        avoidLabelOverlap: false,
        padAngle: 5,
        itemStyle: {
          borderRadius: 10,
        },
        label: {
          show: false,
          position: "center",
        },
        emphasis: {
          label: {
            show: true,
            fontSize: 40,
            fontWeight: "bold",
          },
        },
        labelLine: {
          show: false,
        },
        data: [
          { value: 1048, name: "Search Engine" },
          { value: 735, name: "Direct" },
          { value: 580, name: "Email" },
          { value: 484, name: "Union Ads" },
          { value: 300, name: "Video Ads" },
        ],
      },
    ],
  };

  // 使用刚指定的配置项和数据显示图表。
  myEcharts2.setOption(option);
//   第三种
  // 基于准备好的dom,初始化echarts实例
  var myEcharts3 = echarts.init(document.getElementById("chart3"));

  let indicatorList = [
    {
      name: "机房1",
    },
    {
      name: "机房2",
    },
    {
      name: "机房3",
    },
    {
      name: "机房4",
    },
    {
      name: "机房5",
    },
  ];
  var option2 = {
    backgroundColor: "rgb(13,34,73)",
    color: ["#0290ff", "#ffe533", "#ff4d4d", "#06f5bc"],
    tooltip: {
      show: false, // 弹层数据去掉
    },
    legend: {
      data: [
        {
          name: "告警",
          icon: "rect",
          itemStyle: {
            color: "#ff4d4d",
            borderWidth: 0, // 设置图例图标的颜色
          },
        },
        {
          name: "预警",
          icon: "rect",
          itemStyle: {
            color: "#0290ff",
            borderWidth: 0, // 设置图例图标的颜色
          },
        },
        {
          name: "缺陷",
          icon: "rect",
          itemStyle: {
            color: "#ffe533",
            borderWidth: 0, // 设置图例图标的颜色
          },
        },
        {
          name: "巡检",
          icon: "rect",
          itemStyle: {
            color: "#06f5bc",
            borderWidth: 0, // 设置图例图标的颜色
          },
        },
      ],

      top: 100,
      show: true,
      y: "1",
      center: 0,
      itemWidth: 12,
      itemHeight: 12,
      itemGap: 26,
      z: 3,
      // orient: 'horizontal',
      textStyle: {
        fontSize: 14,
        color: "#edf8ff",
      },
    },
    radar: {
      center: ["50%", "50%"], // 外圆的位置
      radius: "55%",
      name: {
        textStyle: {
          color: "#fff",
          fontSize: 16,
          fontWeight: 400,
          fontFamily: "PingFangSC-Regular,PingFang SC",
          fontStyle: "normal",
        },
      },
      // TODO:
      indicator: indicatorList,
      splitArea: {
        // 坐标轴在 grid 区域中的分隔区域,默认不显示。
        show: true,
        areaStyle: {
          // 分隔区域的样式设置。
          color: ["rgba(255,255,255,0)"], // 分隔区域颜色。分隔区域会按数组中颜色的顺序依次循环设置颜色。默认是一个深浅的间隔色。
        },
      },
      axisLine: {
        // 指向外圈文本的分隔线样式
        lineStyle: {
          color: "rgba(255,255,255,0)",
        },
      },
      splitLine: {
        lineStyle: {
          type: "solid",
          color: "#0ac8ff", // 分隔线颜色
          width: 2, // 分隔线线宽
        },
      },
    },
    series: [
      {
        type: "radar",
        data: [
          {
            value: [50, 60, 40, 10, 0],
            name: "告警",
            areaStyle: {
              normal: {
                color: {
                  type: "radial",
                  x: 0.5,
                  y: 0.5,
                  r: 0.5,
                  colorStops: [
                    {
                      offset: 0,
                      color: "rgba(255, 56, 56, 0.14)", // 0% 处的颜色
                    },
                    {
                      offset: 0.15,
                      color: "rgba(255, 56, 56, 0.14)", // 100% 处的颜色
                    },
                    {
                      offset: 0.75,
                      color: "rgba(255, 56, 56, 0.4)", // 100% 处的颜色
                    },
                    {
                      offset: 1,
                      color: "rgba(255, 56, 56, 0.8)", // 100% 处的颜色
                    },
                  ],
                  global: false, // 缺省为 false
                },
              },
            },
            symbolSize: [6, 6],
            lineStyle: {
              //边缘颜色
              //  width: 0
              color: "rgba(255, 56, 56, 0.8)",
              // shadowBlur:8,
              // shadowColor:'#ff3838'
            },
            itemStyle: {
              color: "#fff",
              borderColor: "#ff6565",
              borderWidth: 1,
              shadowBlur: 8,
              shadowColor: "#ff6565",
            },
          },
          {
            value: [80, 80, 80, 70, 60],
            name: "预警",
            areaStyle: {
              normal: {
                color: {
                  type: "radial",
                  x: 0.5,
                  y: 0.5,
                  r: 0.5,
                  colorStops: [
                    {
                      offset: 0,
                      color: "rgba(0,194,255, 0.14)", // 0% 处的颜色
                    },
                    {
                      offset: 0.15,
                      color: "rgba(0,194,255, 0.14)", // 100% 处的颜色
                    },
                    {
                      offset: 0.75,
                      color: "rgba(0,194,255, 0.4)", // 100% 处的颜色
                    },
                    {
                      offset: 1,
                      color: "rgba(0,194,255, 0.8)", // 100% 处的颜色
                    },
                  ],
                  global: false, // 缺省为 false
                },
              },
            },
            symbolSize: [6, 6],
            lineStyle: {
              //边缘颜色
              //  width: 0
              color: "rgba(0, 194, 255, 0.8)",
              // shadowBlur:8,
              // shadowColor:'#ff3838'
            },
            itemStyle: {
              color: "#fff",
              borderColor: "#00c8ff",
              borderWidth: 1,
              shadowBlur: 8,
              shadowColor: "#00c8ff",
            },
          },
          {
            value: [50, 40, 70, 50, 60],
            name: "缺陷",
            areaStyle: {
              normal: {
                color: {
                  type: "radial",
                  x: 0.5,
                  y: 0.5,
                  r: 0.5,
                  colorStops: [
                    {
                      offset: 0,
                      color: "rgba(255, 220, 56, 0.14)", // 0% 处的颜色
                    },
                    {
                      offset: 0.15,
                      color: "rgba(255, 220, 56, 0.14)", // 100% 处的颜色
                    },
                    {
                      offset: 0.75,
                      color: "rgba(255, 220, 56, 0.4)", // 100% 处的颜色
                    },
                    {
                      offset: 1,
                      color: "rgba(255, 220, 56, 0.8)", // 100% 处的颜色
                    },
                  ],
                  global: false, // 缺省为 false
                },
              },
            },
            symbolSize: [6, 6],
            lineStyle: {
              //边缘颜色
              //  width: 0
              color: "rgba(255, 220, 56, 0.8)",
              // shadowBlur:8,
              // shadowColor:'#ff3838'
            },
            itemStyle: {
              color: "#fff",
              borderColor: "#cdbd3e",
              borderWidth: 1,
              shadowBlur: 8,
              shadowColor: "#cdbd3e",
            },
          },

          {
            value: [0, 0, 10, 30, 70],
            name: "巡检",
            areaStyle: {
              normal: {
                color: {
                  type: "radial",
                  x: 0.5,
                  y: 0.5,
                  r: 0.5,
                  colorStops: [
                    {
                      offset: 0,
                      color: "rgba(13, 248, 172, 0.14)", // 0% 处的颜色
                    },
                    {
                      offset: 0.15,
                      color: "rgba(13, 248, 172, 0.14)", // 100% 处的颜色
                    },
                    {
                      offset: 0.75,
                      color: "rgba(13, 248, 172, 0.4)", // 100% 处的颜色
                    },
                    {
                      offset: 1,
                      color: "rgba(13, 248, 172, 0.8)", // 100% 处的颜色
                    },
                  ],
                  global: false, // 缺省为 false
                },
              },
            },
            symbolSize: [6, 6],
            lineStyle: {
              //边缘颜色
              //  width: 0
              color: "rgba(13, 248, 172, 0.8)",
              // shadowBlur:8,
              // shadowColor:'#ff3838'
            },
            itemStyle: {
              color: "#fff",
              borderColor: "#00ffb4",
              borderWidth: 1,
              shadowBlur: 8,
              shadowColor: "#00ffb4",
            },
          },
        ],
      },
    ],
  };

  // 使用刚指定的配置项和数据显示图表。
  myEcharts3.setOption(option2);
</script>
以上就是使用过程!


 575
575


 被折叠的 条评论
为什么被折叠?
被折叠的 条评论
为什么被折叠?
 到【灌水乐园】发言


