


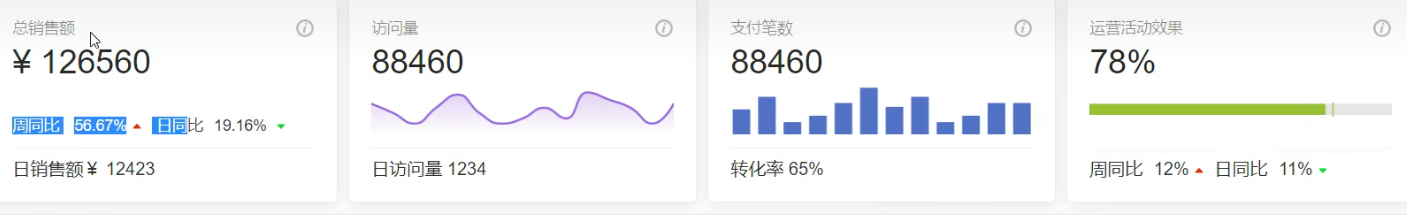
Card模块搭建
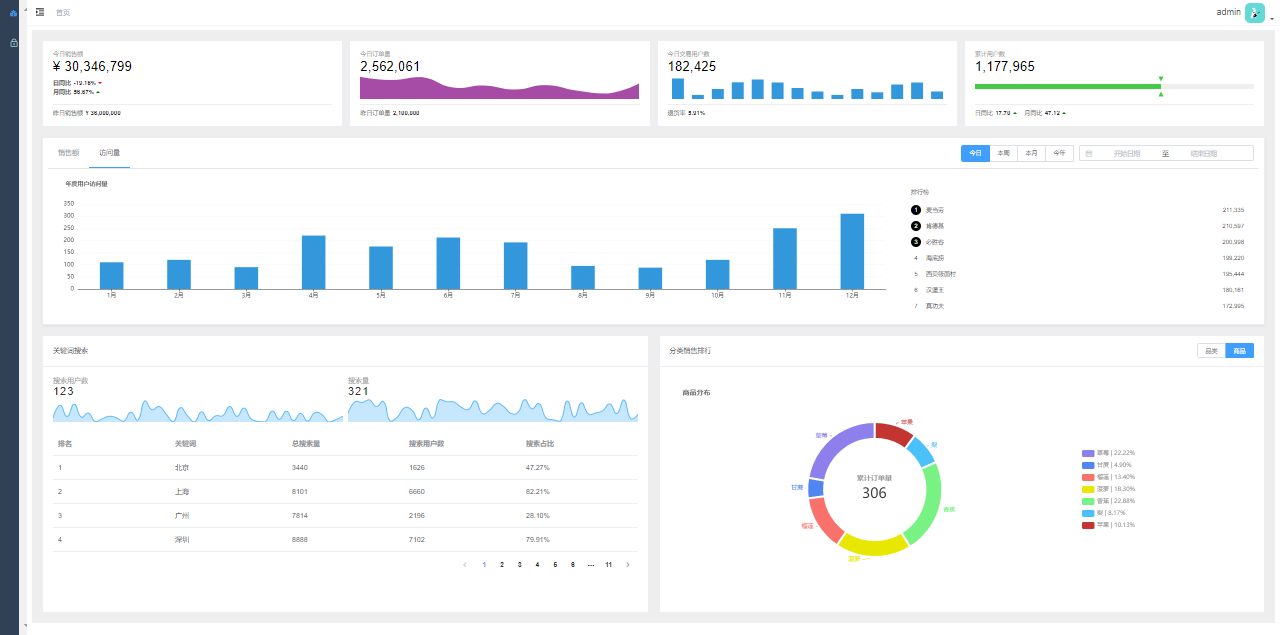
制作这种效果的界面
首先完成Card静态界面的搭建
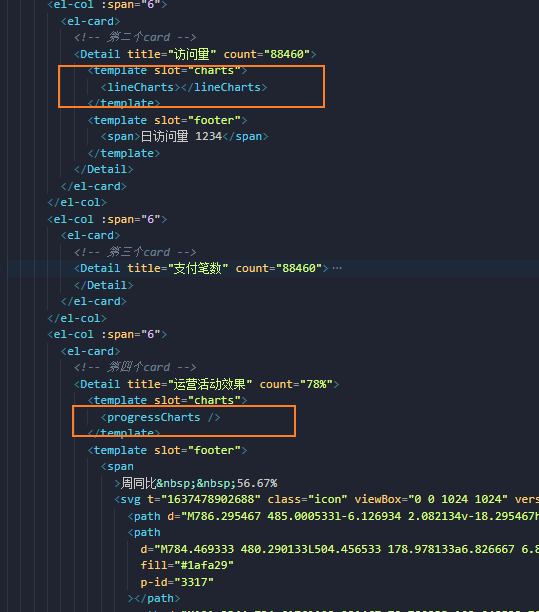
静态搭建完成后然后通过插槽的方式将数据显示出来
先写静态界面
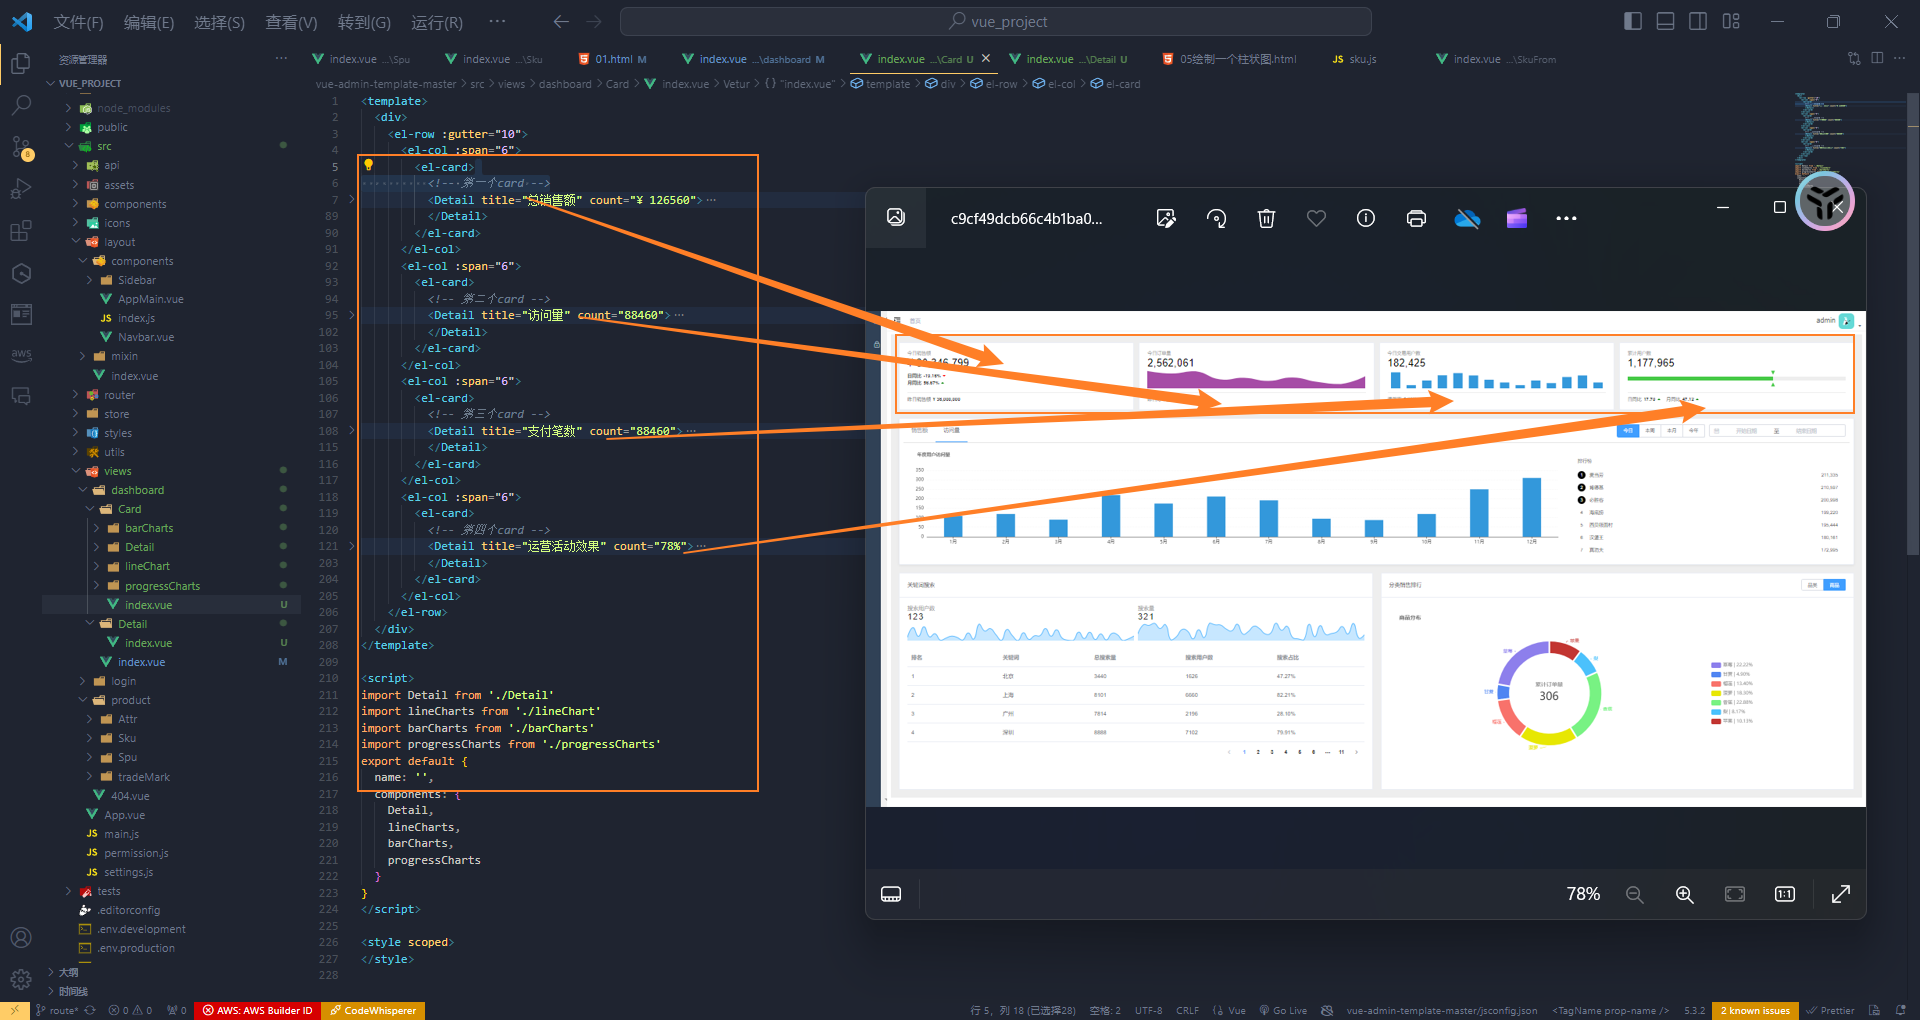
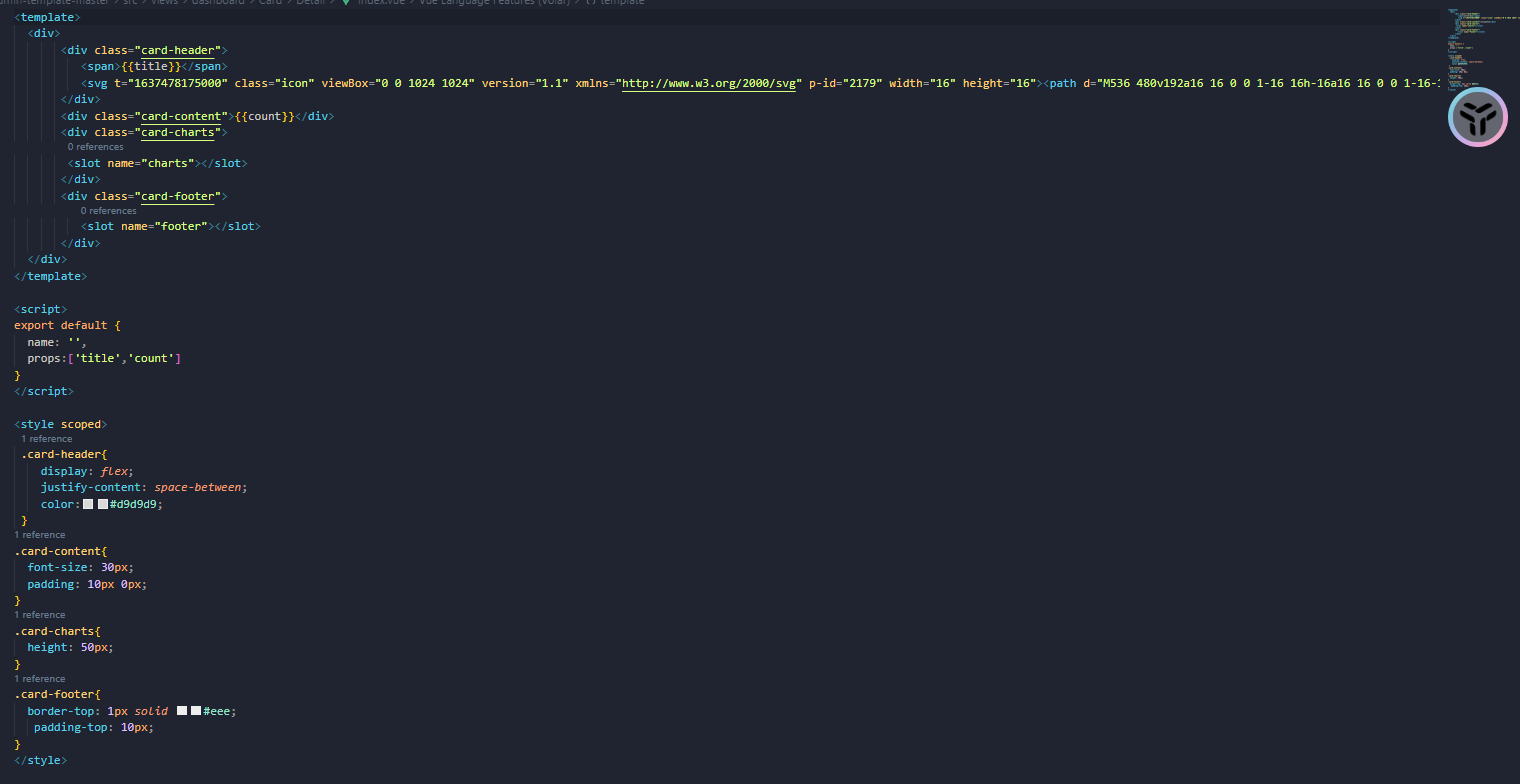
子组件,插槽的模样是这样的,而图表封装到新的组件当中。然后通过插槽的方式插入
<template>
<div>
<div class="card-header">
<span>{{title}}</span>
<svg t="1637478175000" class="icon" viewBox="0 0 1024 1024" version="1.1" xmlns="http://www.w3.org/2000/svg" p-id="2179" width="16" height="16"><path d="M536 480v192a16 16 0 0 1-16 16h-16a16 16 0 0 1-16-16V480a16 16 0 0 1 16-16h16a16 16 0 0 1 16 16z m-32-128h16a16 16 0 0 1 16 16v32a16 16 0 0 1-16 16h-16a16 16 0 0 1-16-16v-32a16 16 0 0 1 16-16z m8 448c159.056 0 288-128.944 288-288s-128.944-288-288-288-288 128.944-288 288 128.944 288 288 288z m0 48c-185.568 0-336-150.432-336-336s150.432-336 336-336 336 150.432 336 336-150.432 336-336 336z" p-id="2180" fill="#8a8a8a"></path></svg>
</div>
<div class="card-content">{{count}}</div>
<div class="card-charts">
<slot name="charts"></slot>
</div>
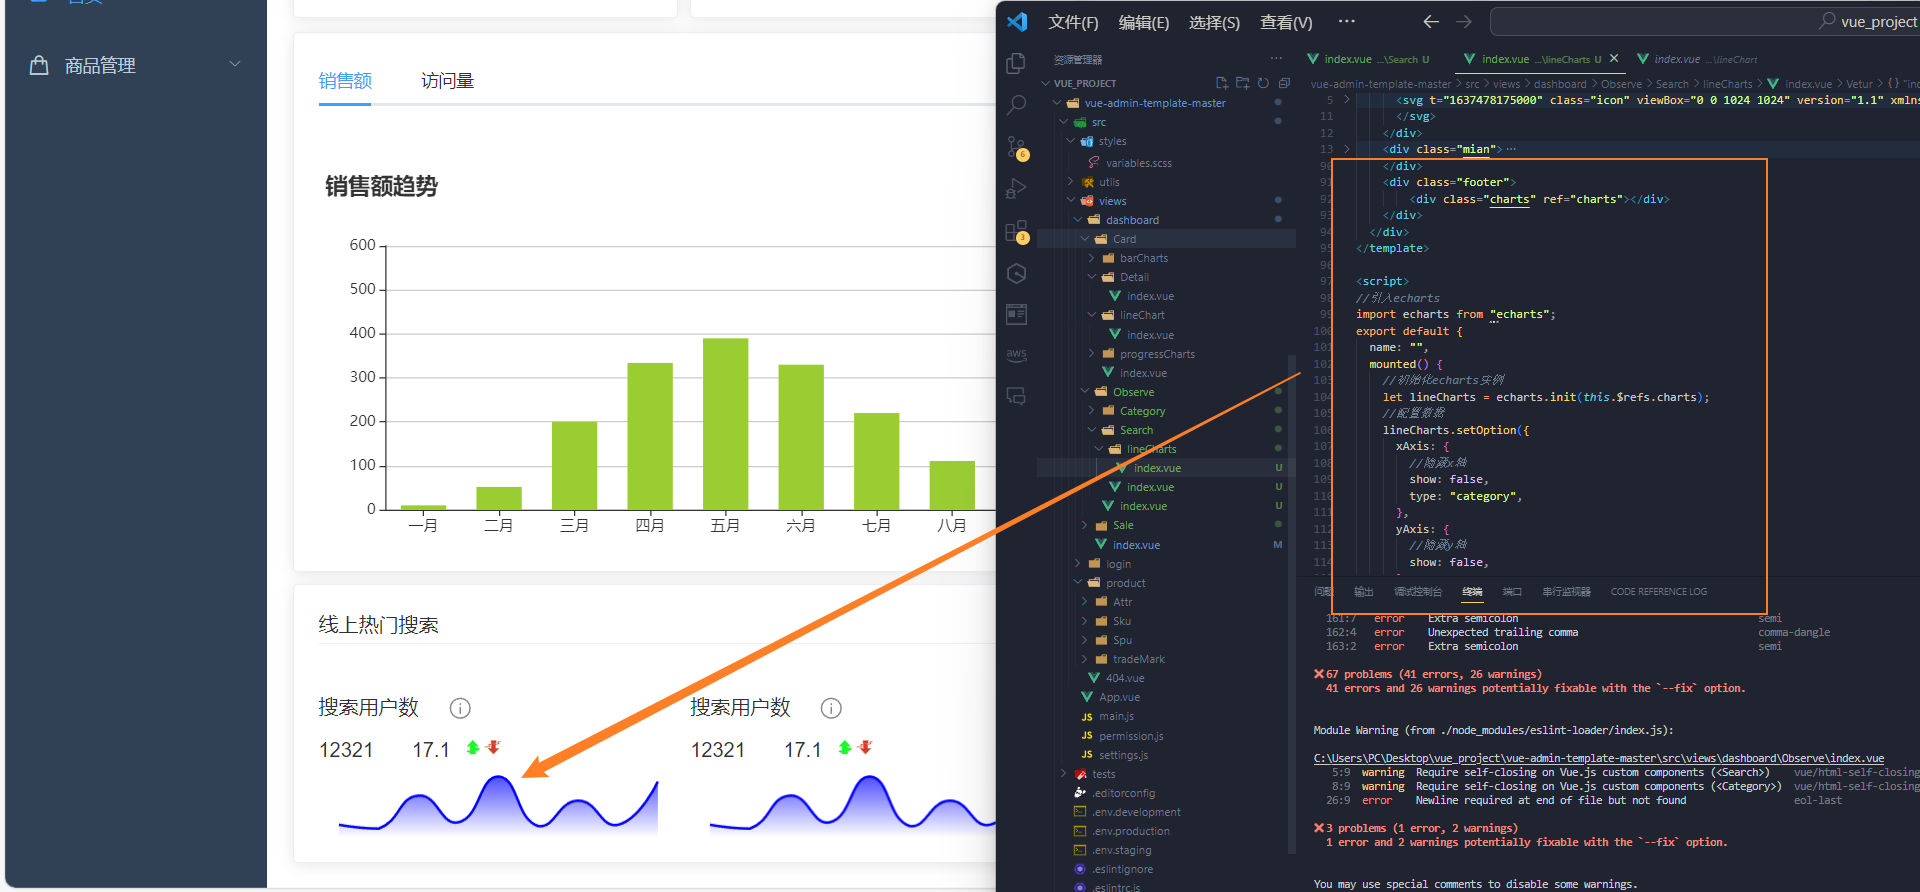
<div class="card-footer">
<slot name="footer"></slot>
</div>
</div>
</template>
<script>
export default {
name: '',
props:['title','count']
}
</script>
<style scoped>
.card-header{
display: flex;
justify-content: space-between;
color:#d9d9d9;
}
.card-content{
font-size: 30px;
padding: 10px 0px;
}
.card-charts{
height: 50px;
}
.card-footer{
border-top: 1px solid #eee;
padding-top: 10px;
}
</style>
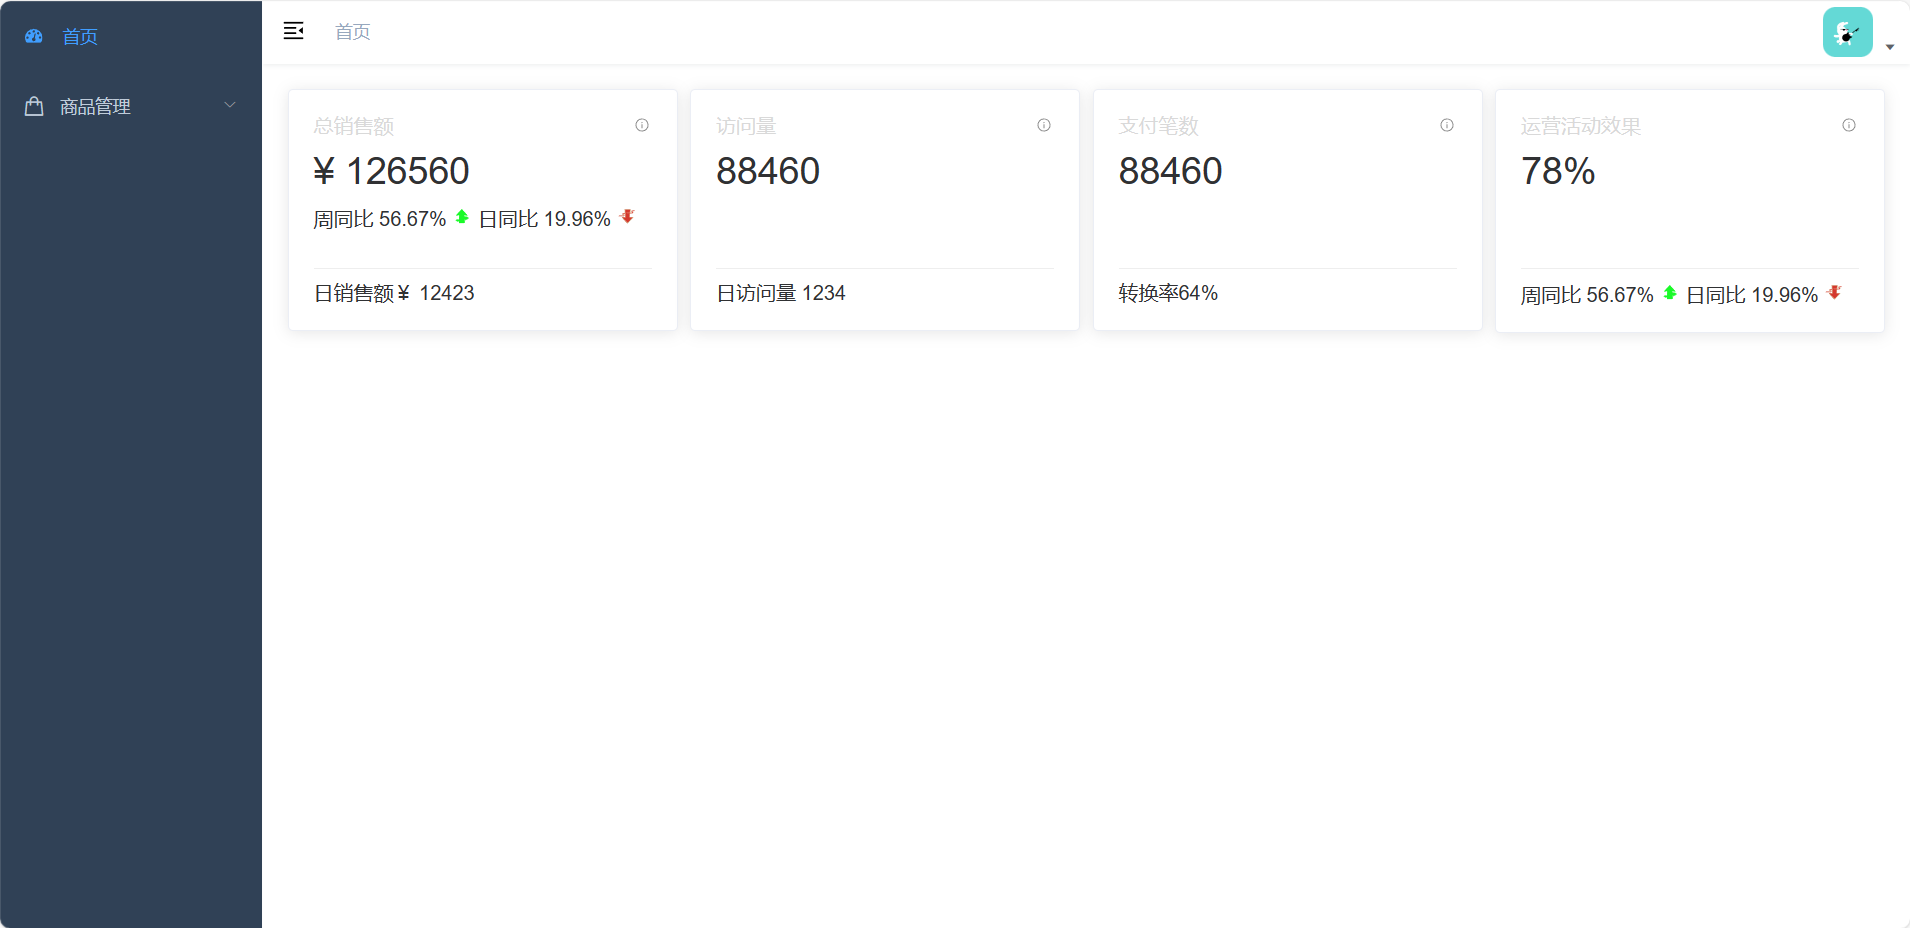
类似这种效果。中间空出来的部分用来放图表
echarts需要下载在导包
npm install --save echarts@4.8.0这里以折线图为例子说明echarts的使用
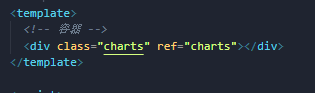
1.需要有一个容器来放这个折线。我们将这些图表分离出来,每张图表对应一个组件
2.引入echarts
这里要注意vue页面中,如果是V5.0之前的版本,引入的方式:
import echarts from 'echarts'如果是V5.0之后的版本,页面中的引入方式
import * as echarts from 'echarts'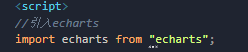
3.进行配置,这里现在mounted这个生命周期里(主要容器先有,才用通过ref的方式拿到容器的demo),然后进行setOption的配置
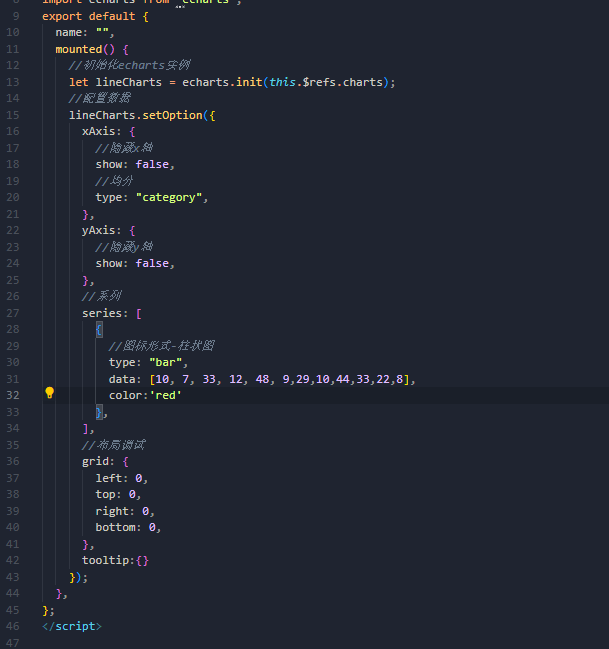
配置项的参数参考文档Documentation - Apache ECharts
完整代码如下
<template>
  <!-- 容器 -->
  <div class="charts" ref="charts"></div>
</template>

<script>
//引入echarts
import echarts from "echarts";
export default {
  name: "",
  mounted() {
    //初始化echarts实例
    let lineCharts = echarts.init(this.$refs.charts);
    //配置数据
    lineCharts.setOption({
      xAxis: {
        //隐藏x轴
        show: false,
        //均分
        type: "category",
      },
      yAxis: {
        //隐藏y轴
        show: false,
      },
      //系列
      series: [
        {
          //图标形式-柱状图
          type: "bar",
          data: [10, 7, 33, 12, 48, 9,29,10,44,33,22,8],
          color:'red'
        },
      ],
      //布局调试
      grid: {
        left: 0,
        top: 0,
        right: 0,
        bottom: 0,
      },
      tooltip:{}
    });
  },
};
</script>

<style scoped>
.charts {
  width: 100%;
  height: 100%;
}
</style>
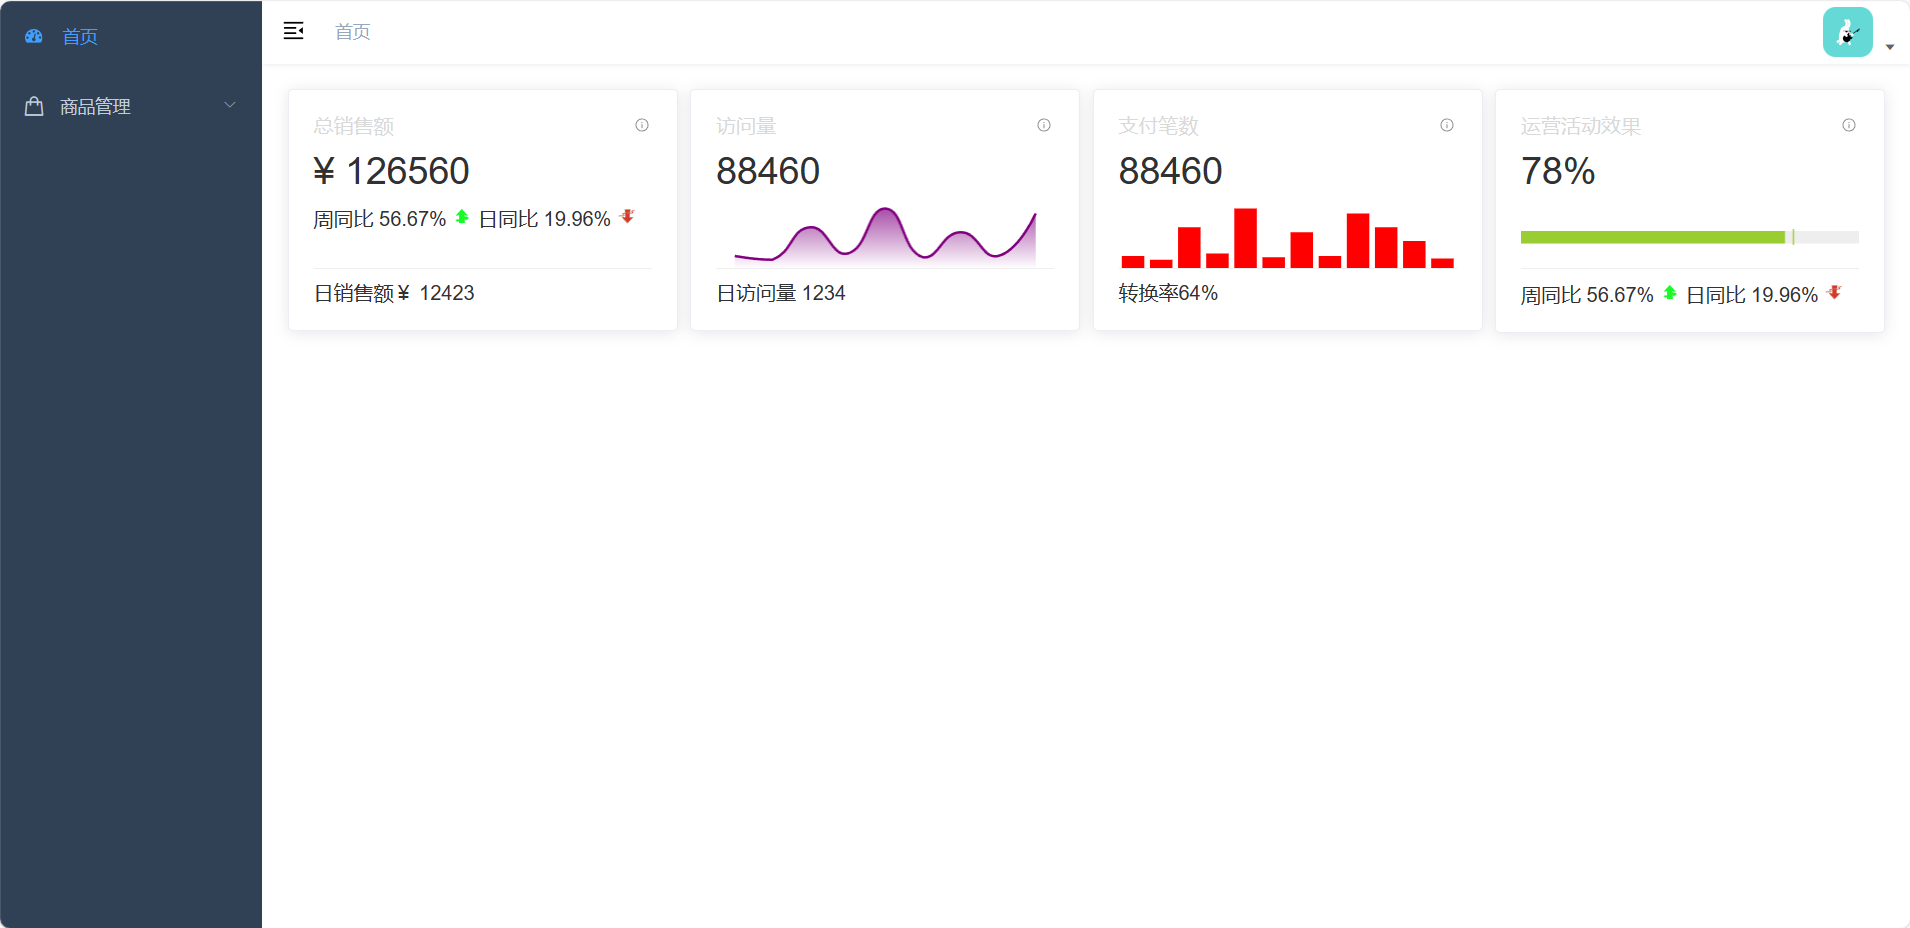
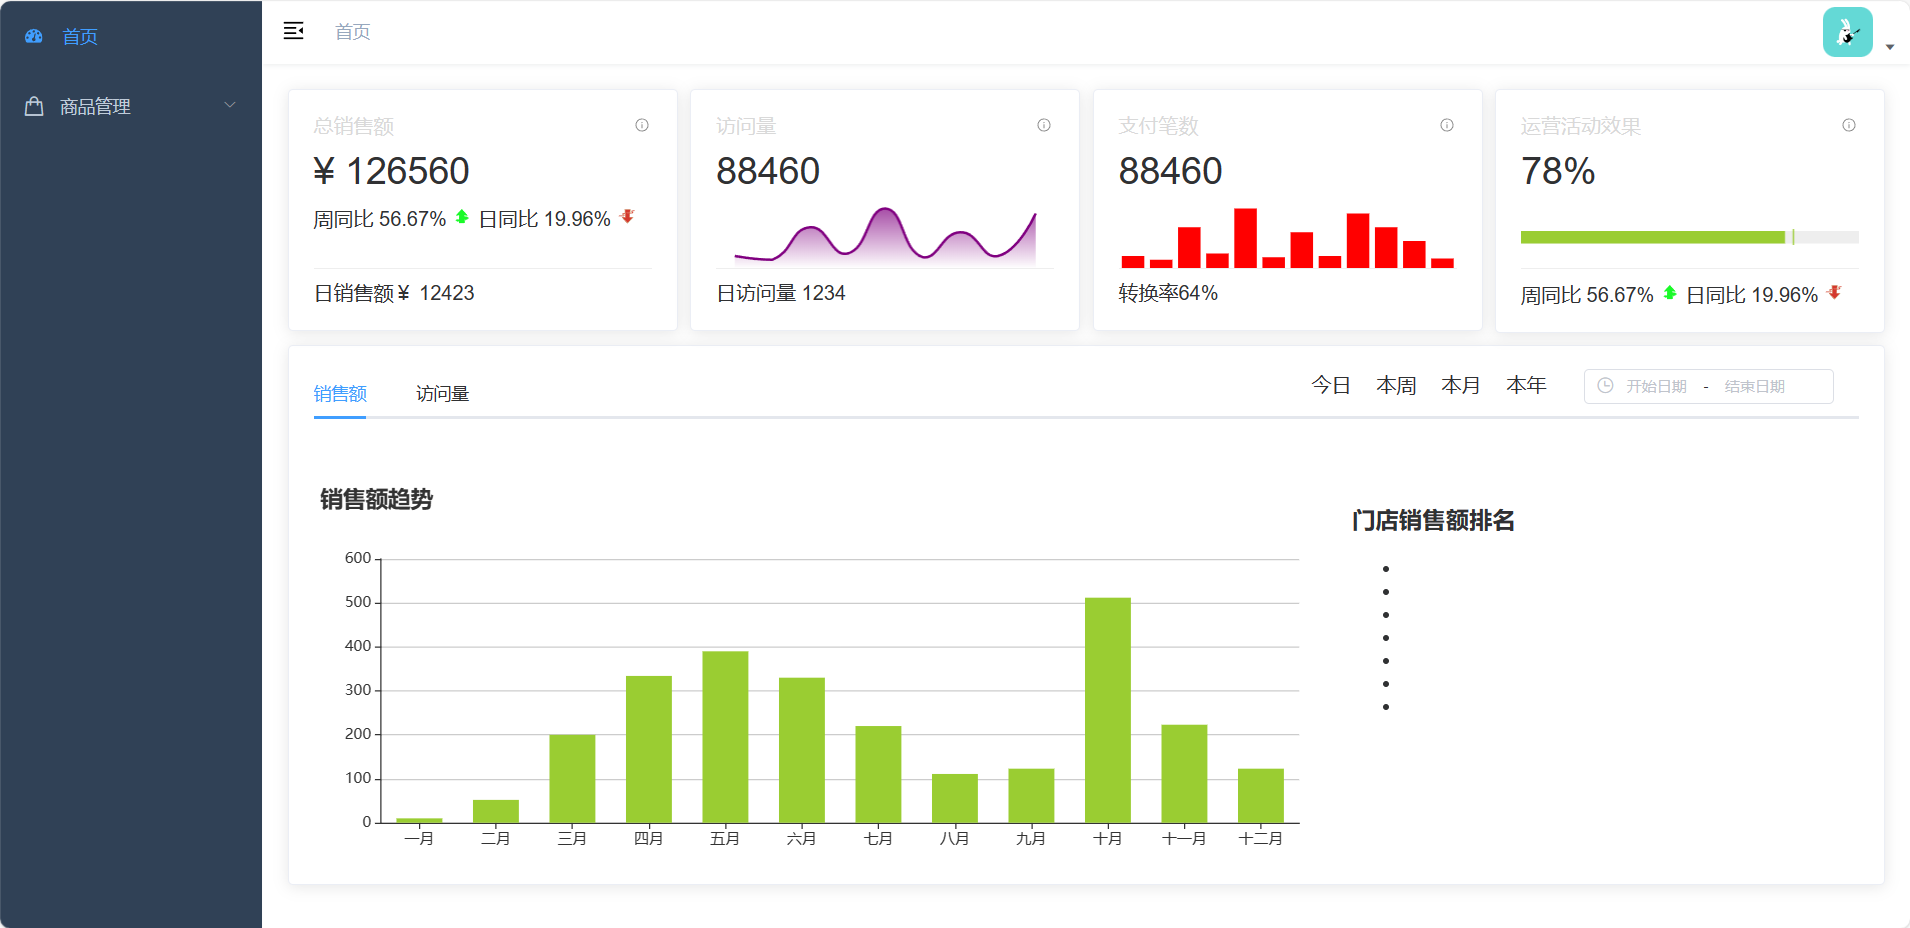
其他图表实现方式类似折线(注意的一点最后进度条是通过柱状图的方式实现),完整效果如下
sale模块搭建
sale静态搭建
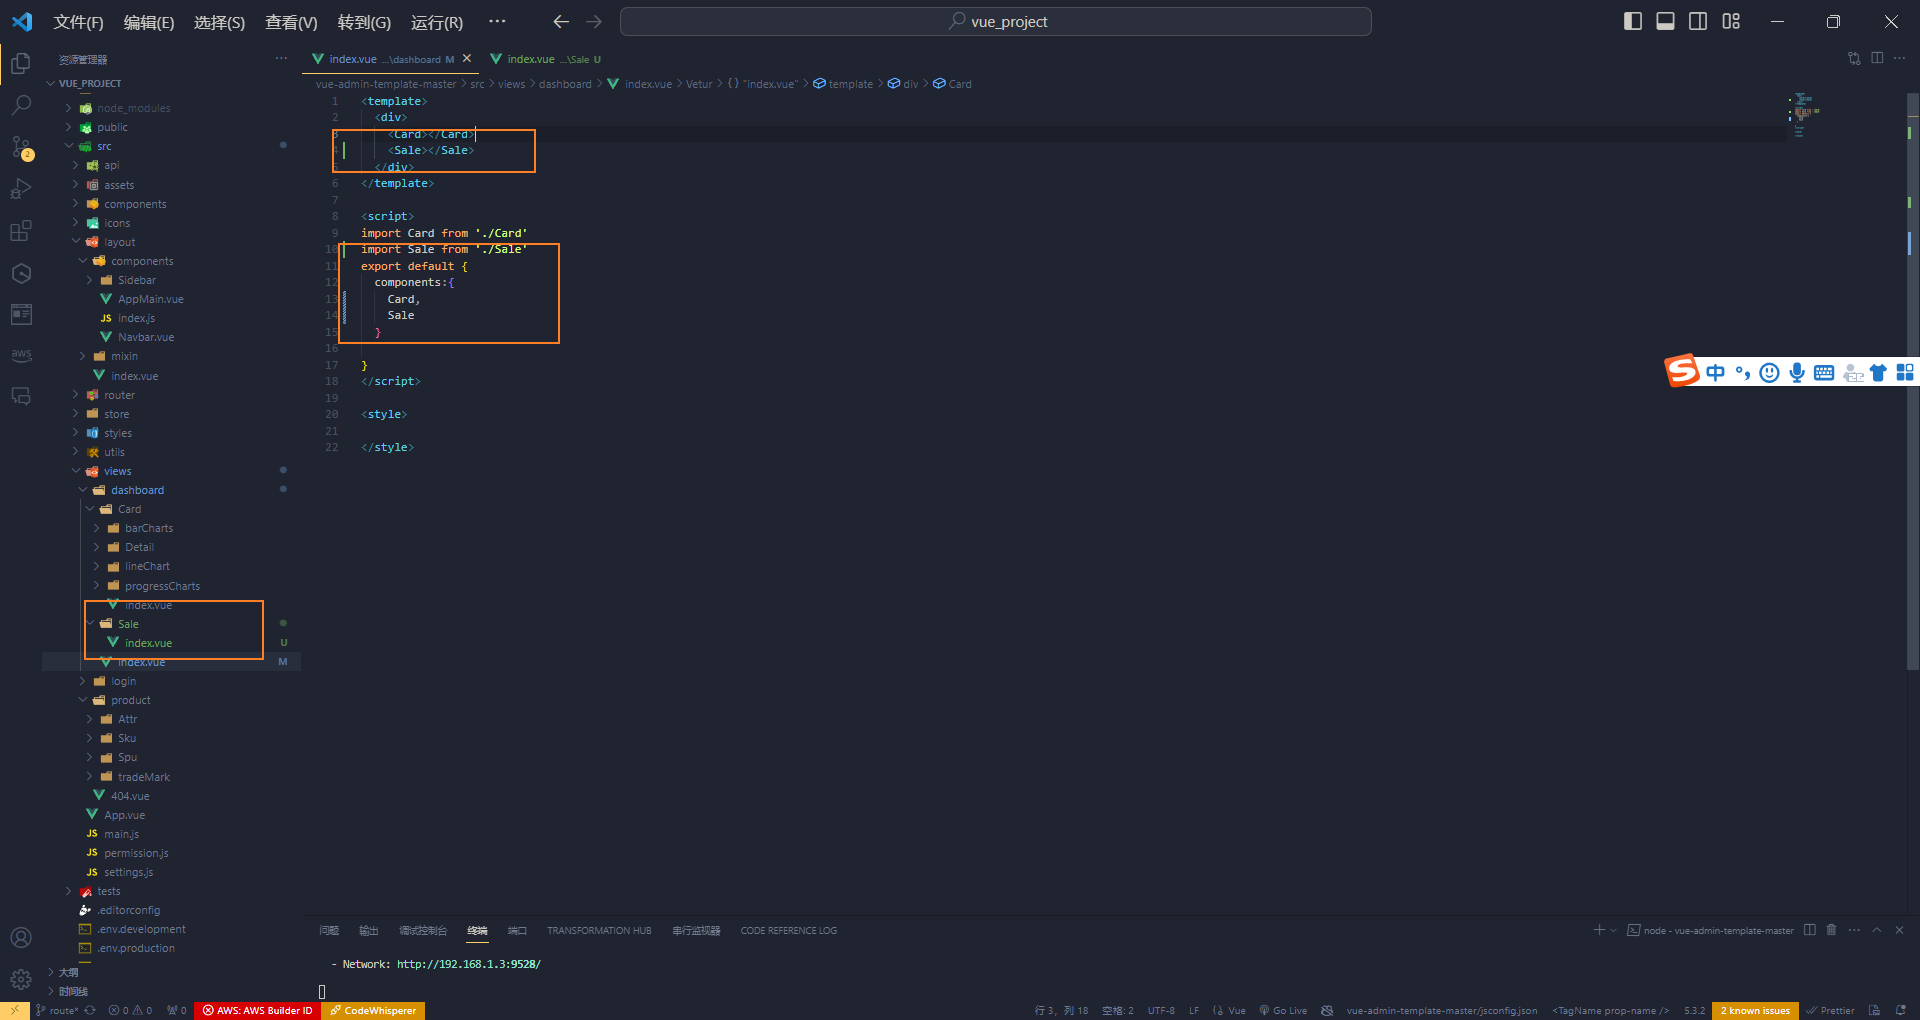
在文件中,引入注册并使用这个sale组件
书写sale组件内部逻辑
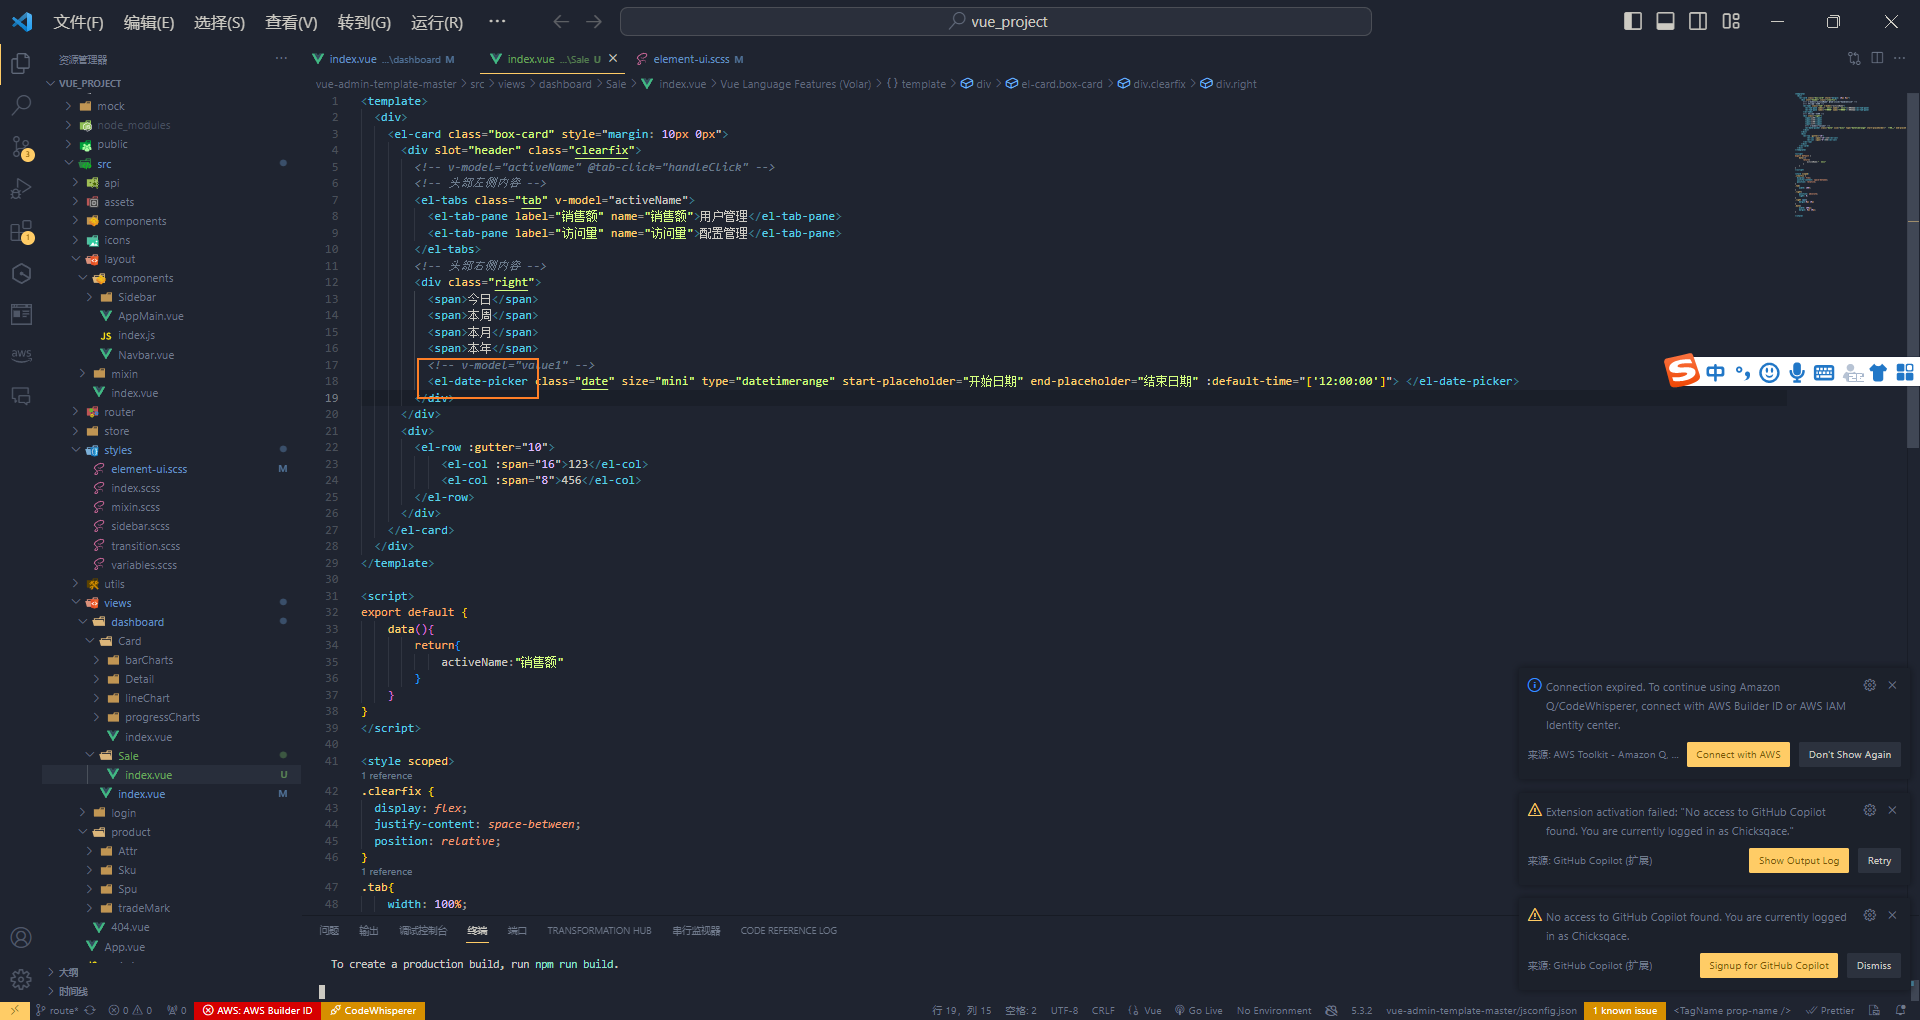
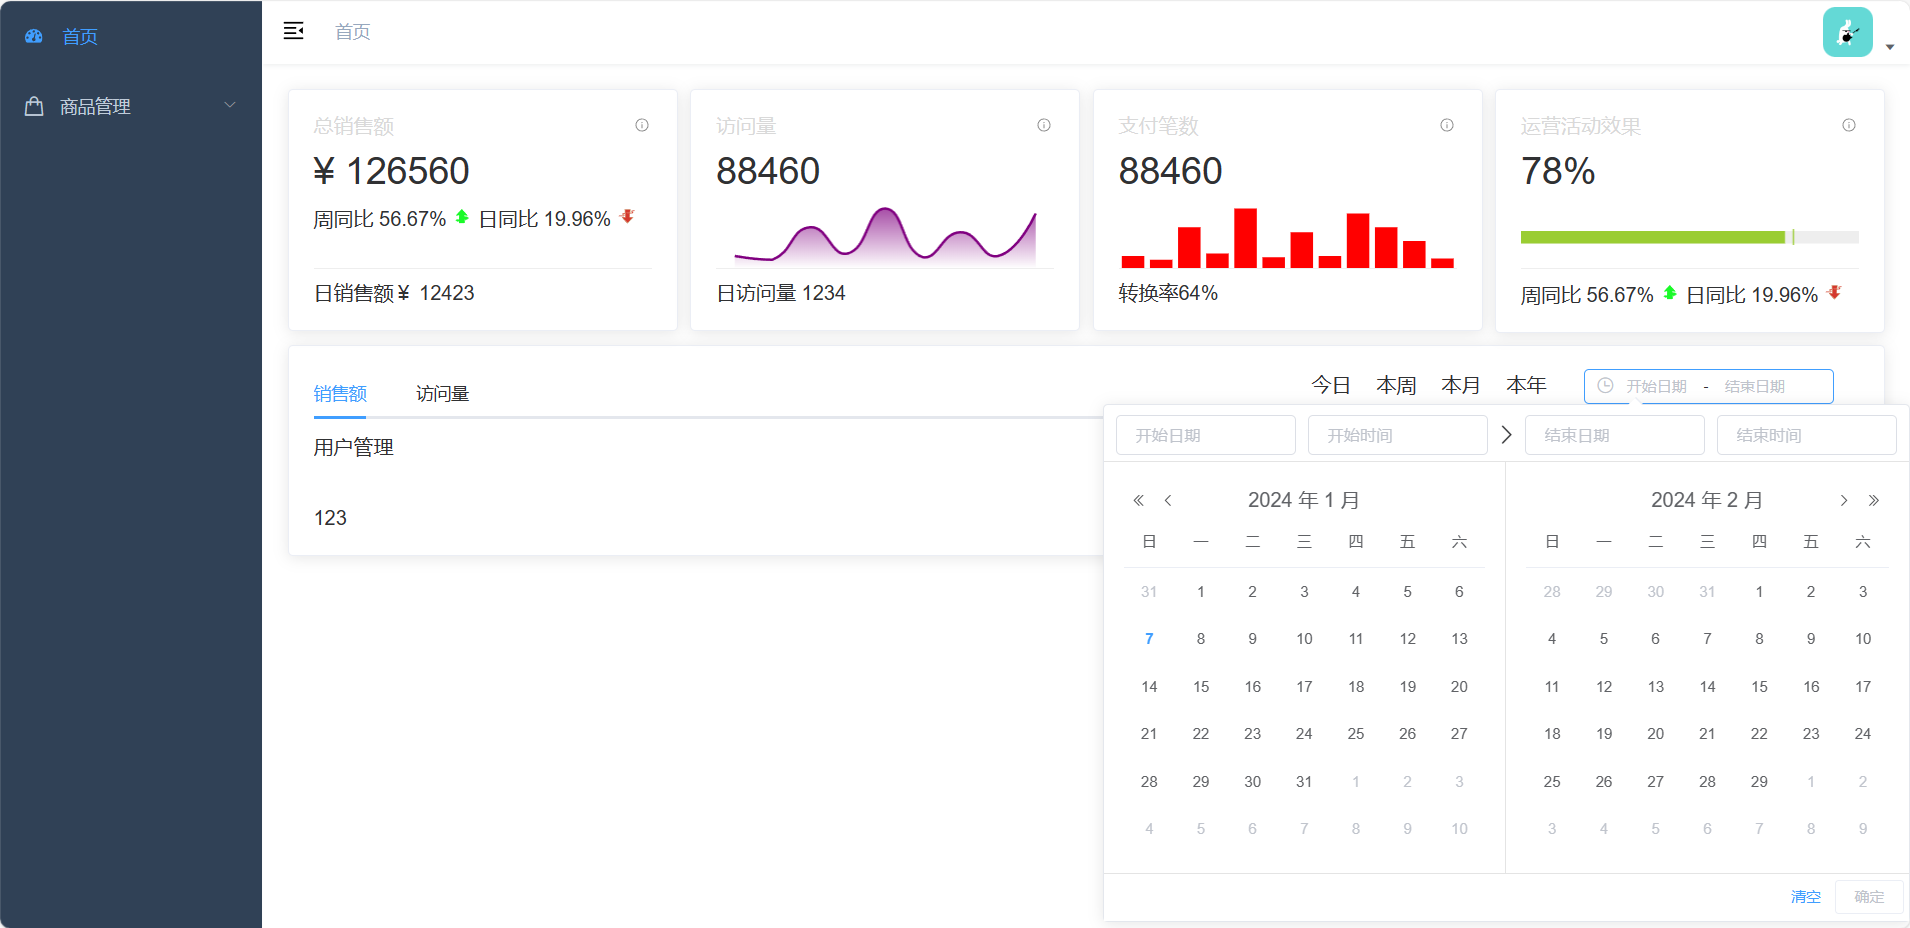
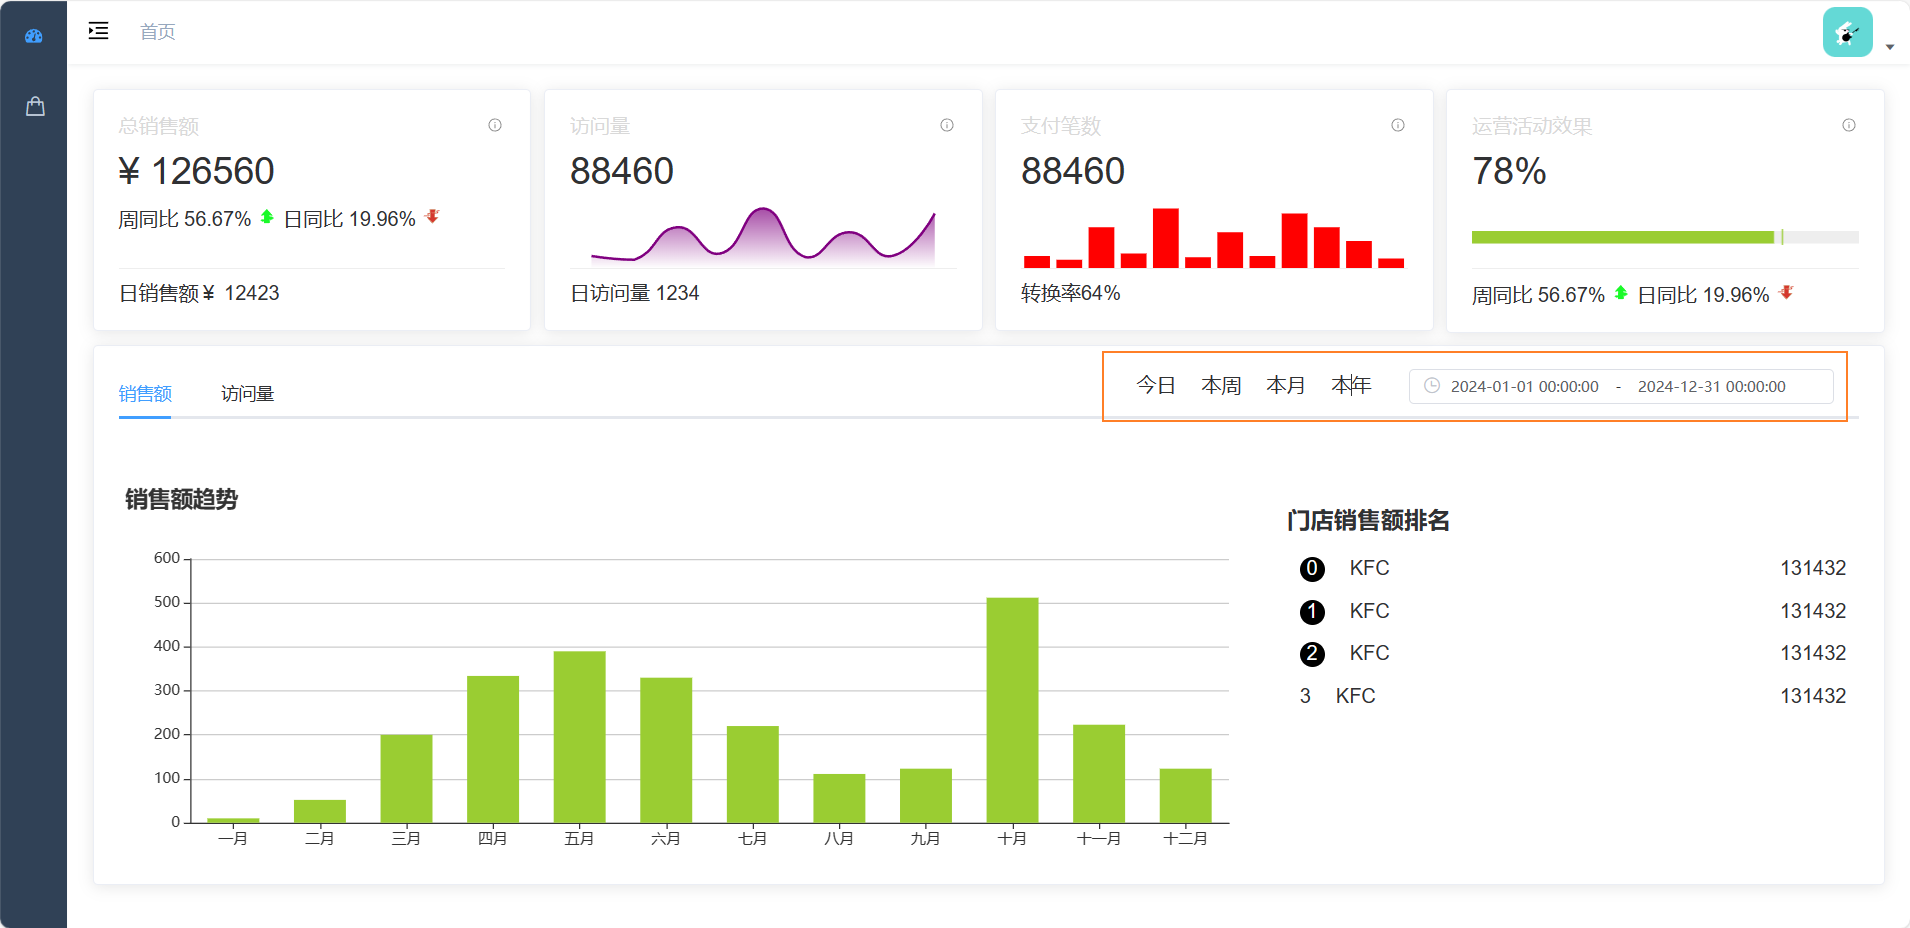
这里用到了一个日期组件之前没有用过,其他参考之前用过
<el-date-picker class="date" size="mini" type="datetimerange" start-placeholder="开始日期" end-placeholder="结束日期" :default-time="['12:00:00']"> </el-date-picker>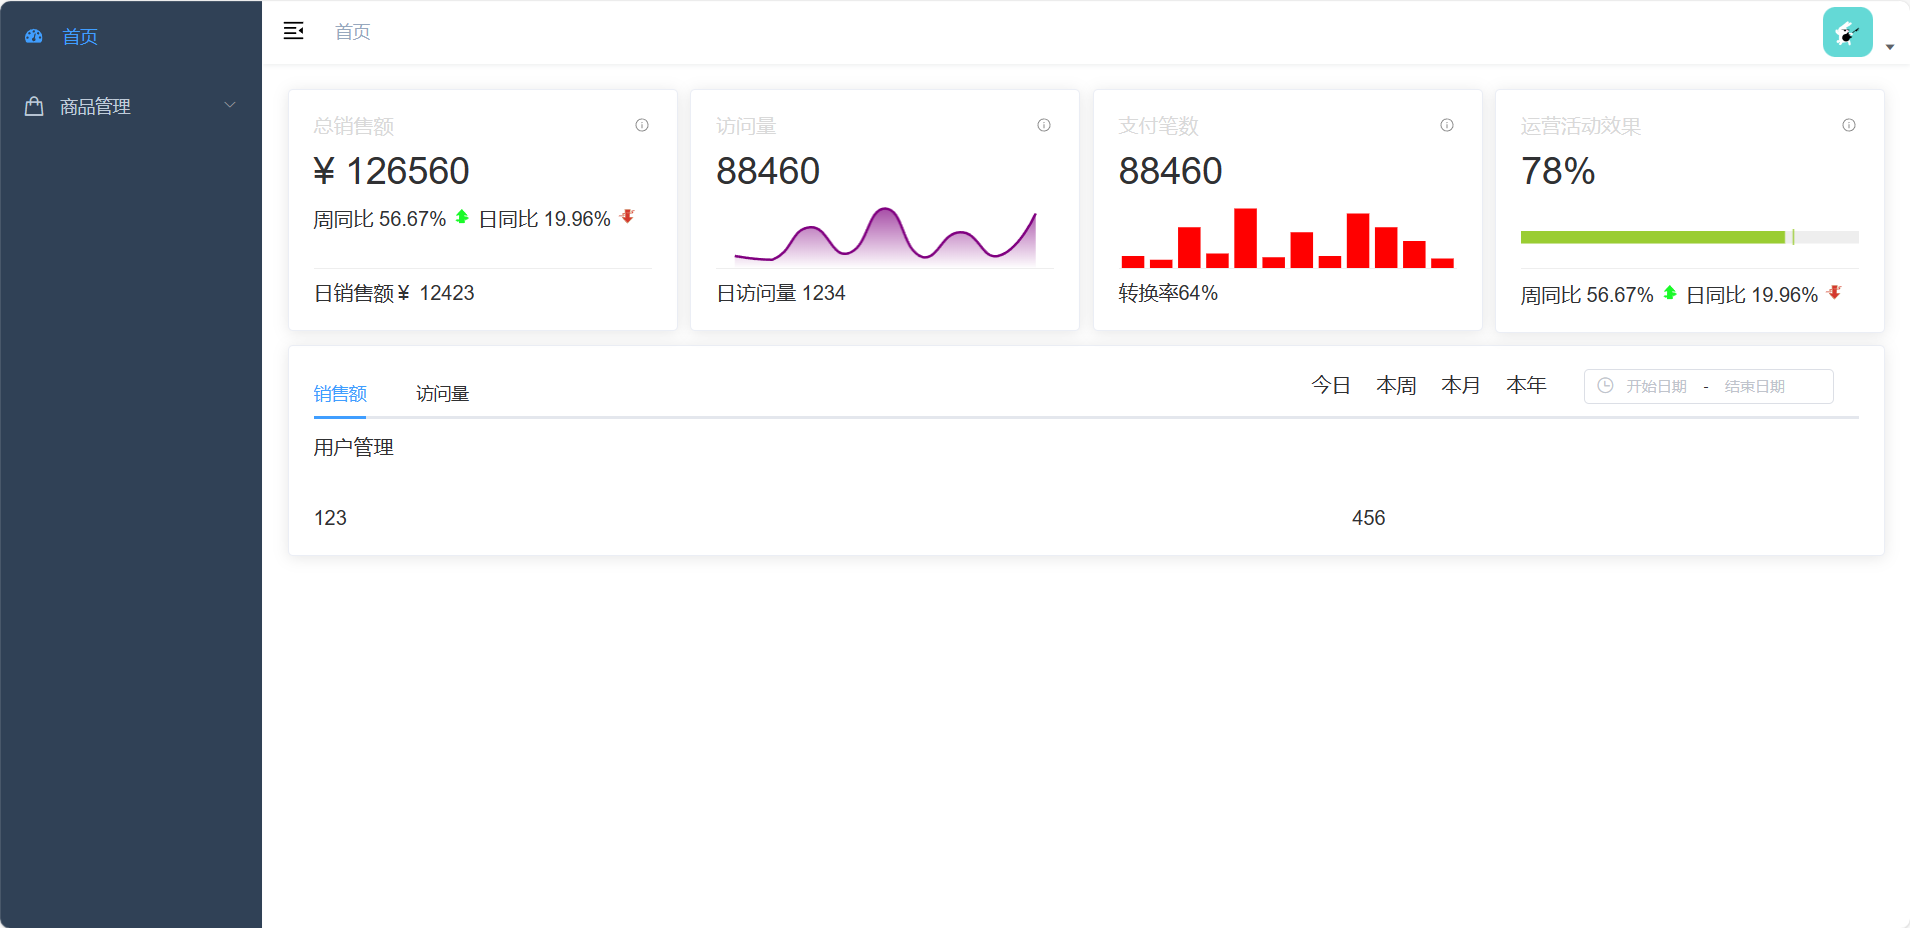
然后完成销售额与访问量静态组件
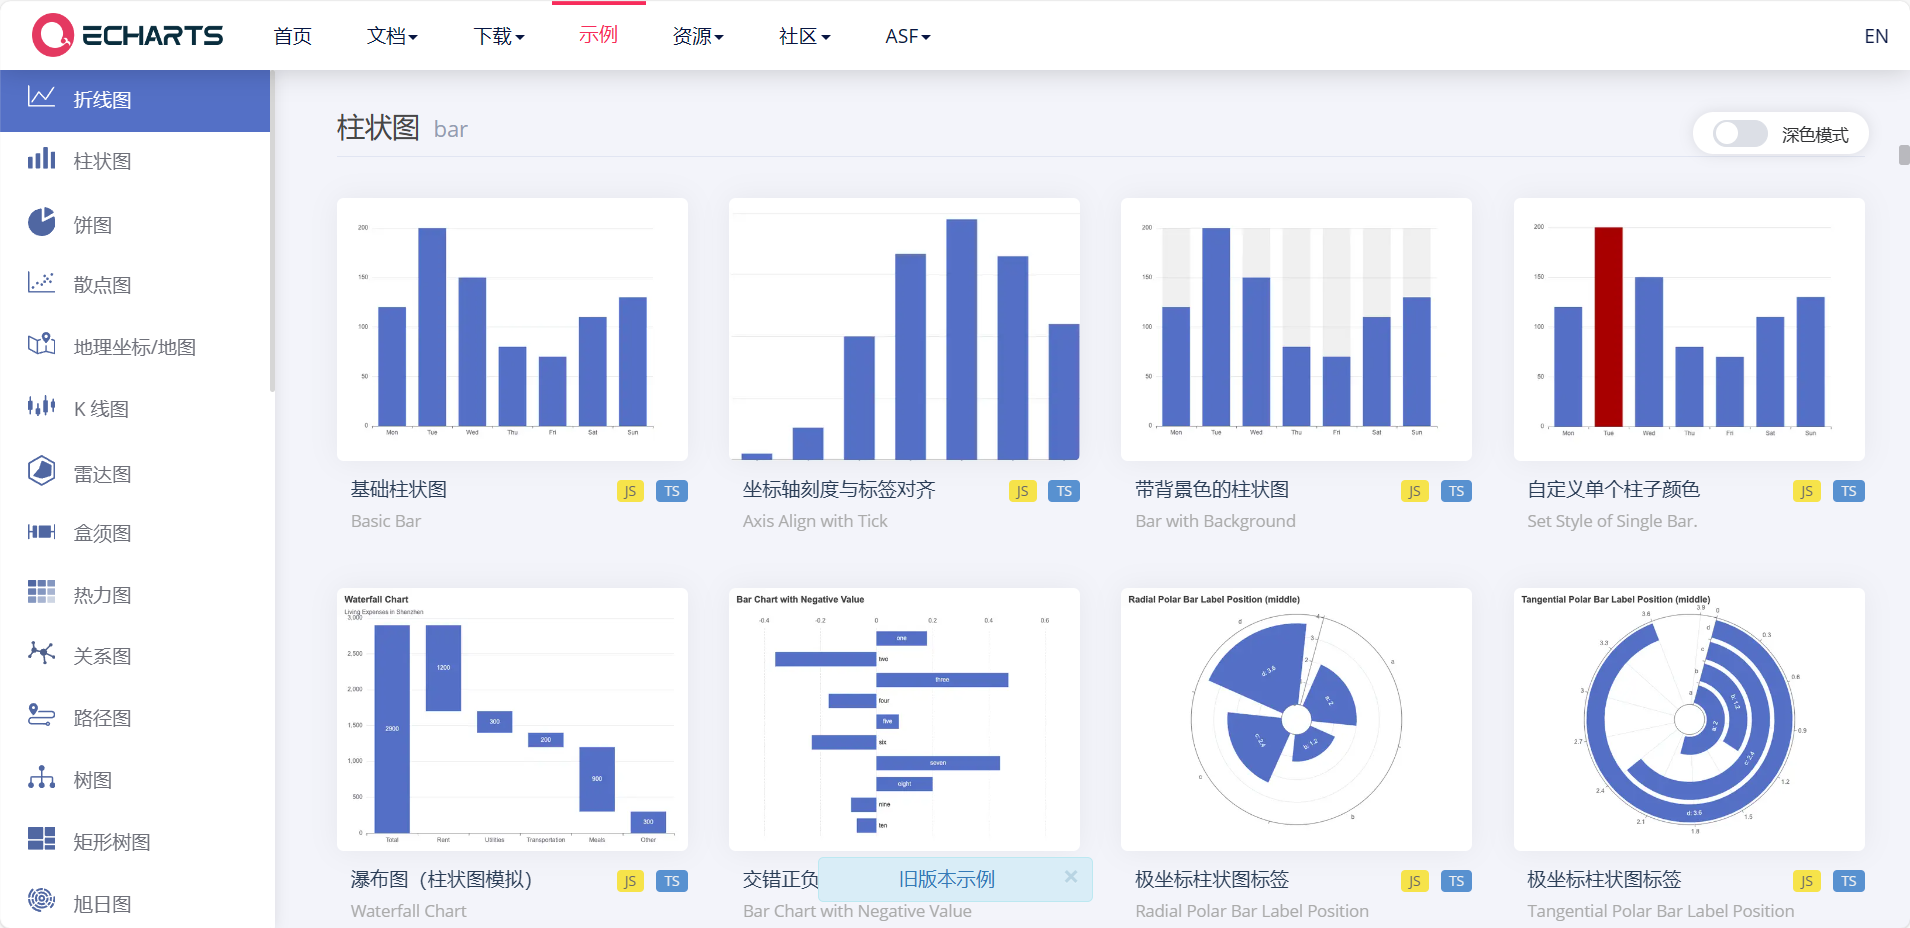 先到示例找类似效果 然后复制它的配置项到页面中
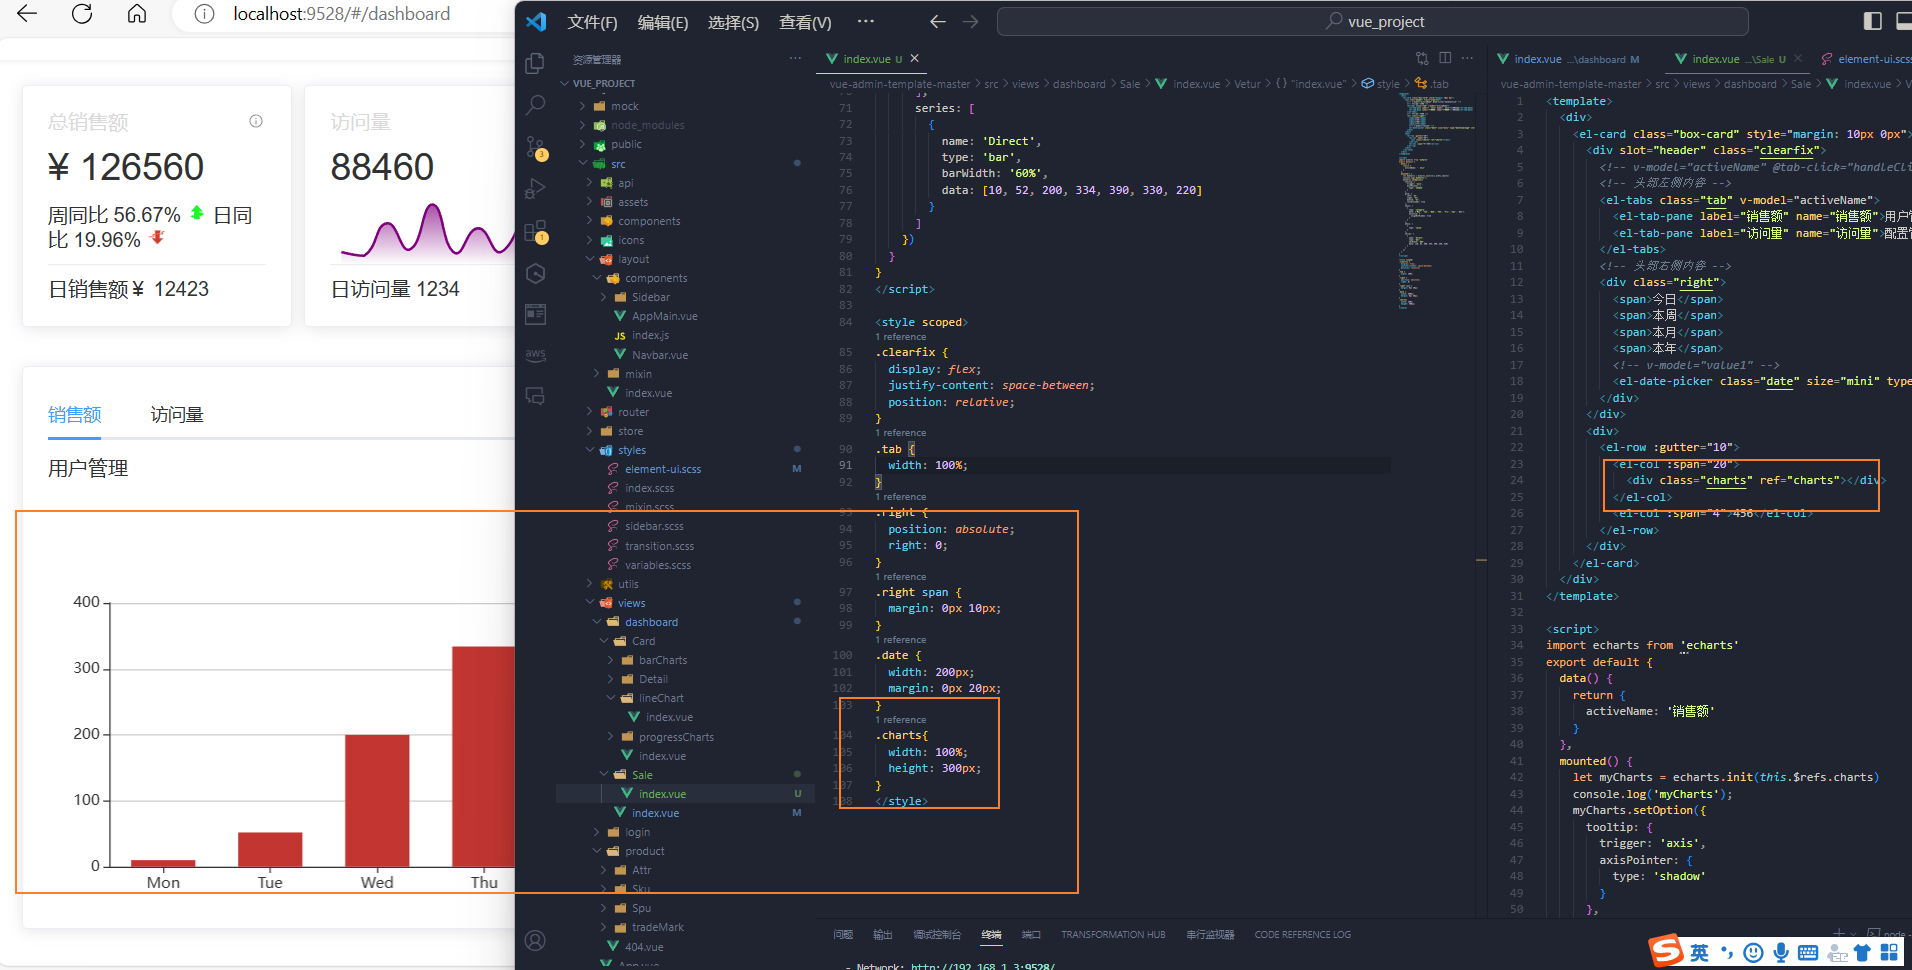
在配置中发现明明配置了,界面并无效果。后面发现是没有设置样式(容器的大小)的问题
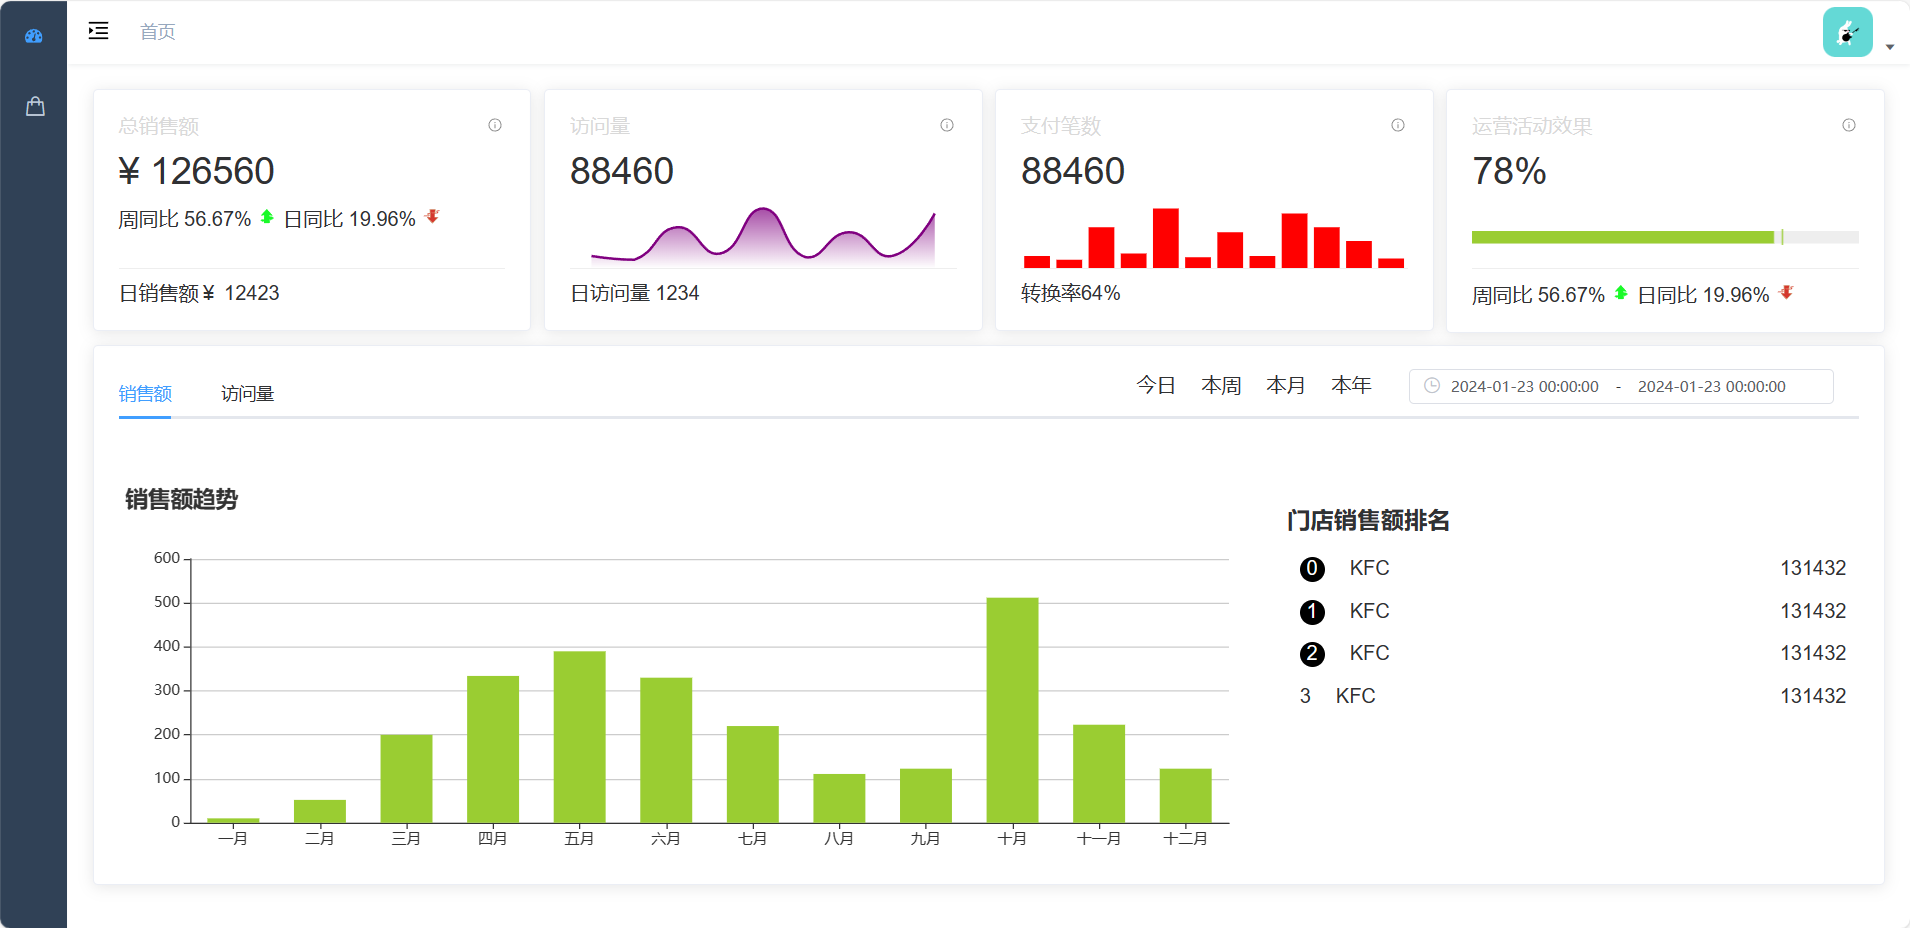
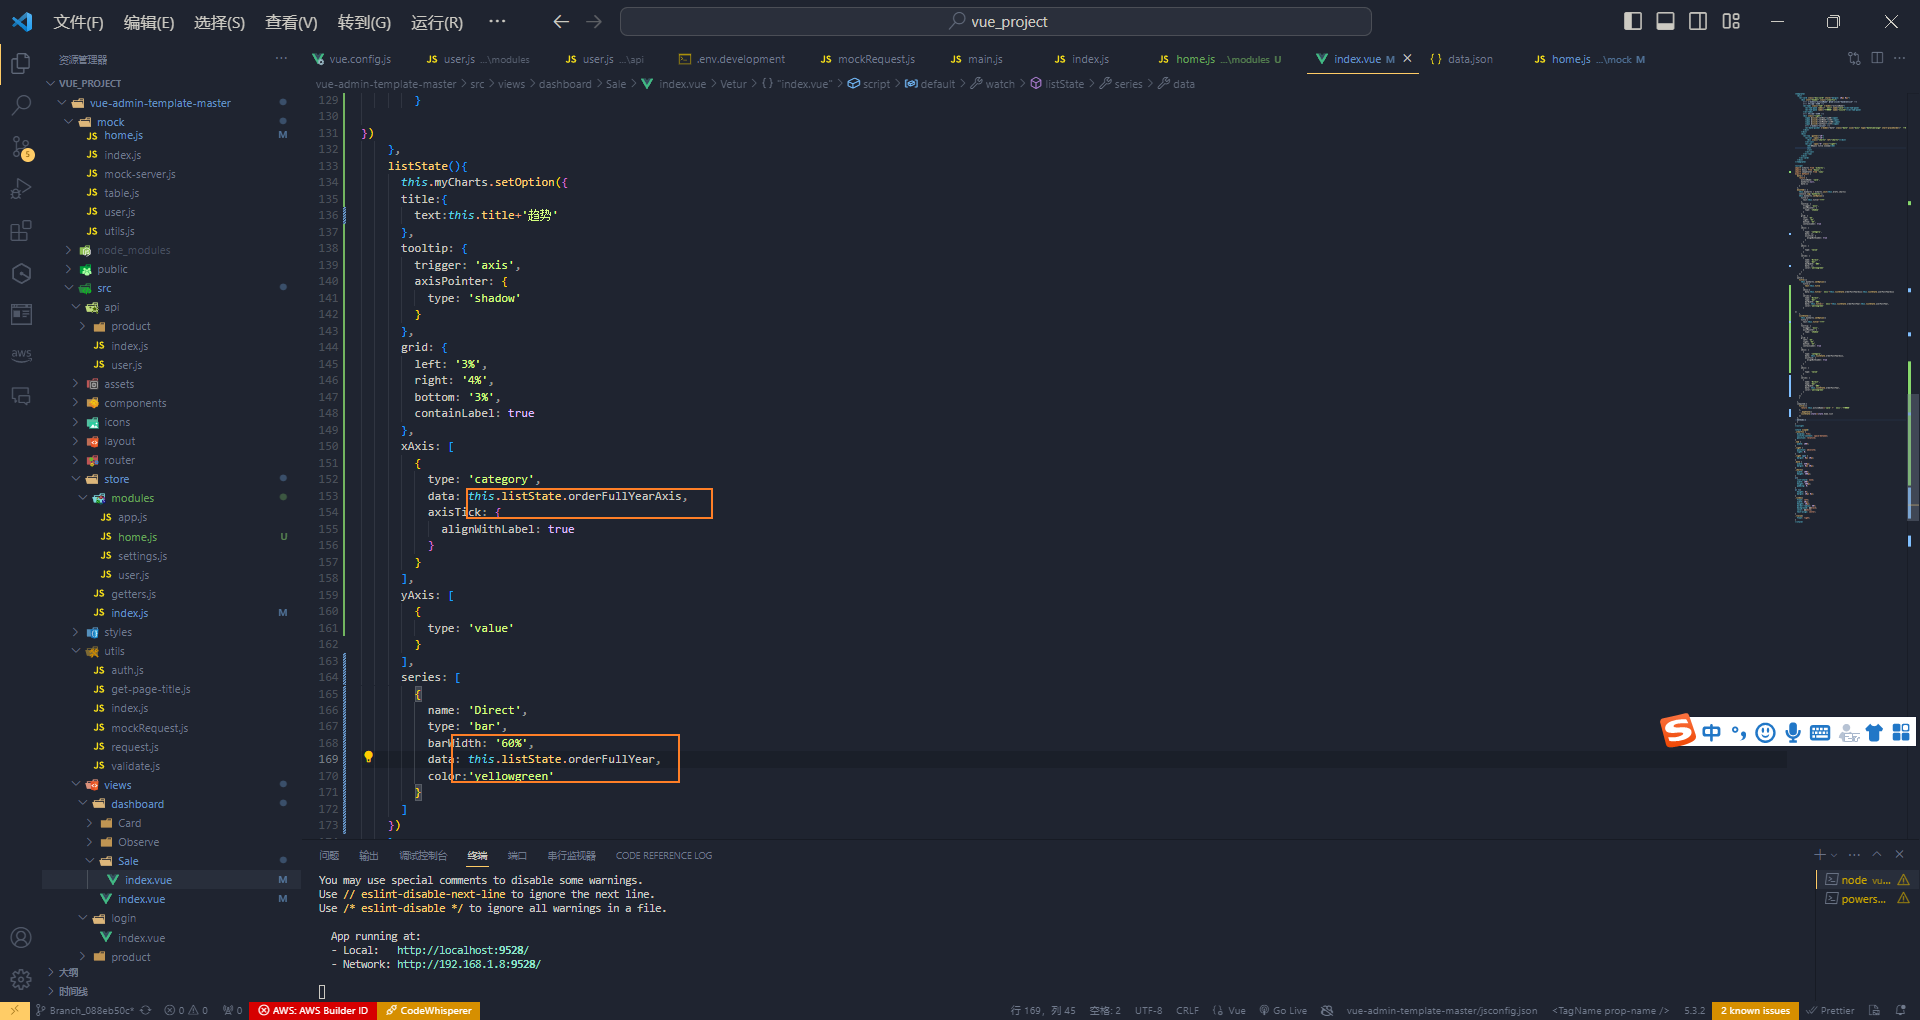
调整柱状图配置,并且书写右边的静态(ul>li*7)
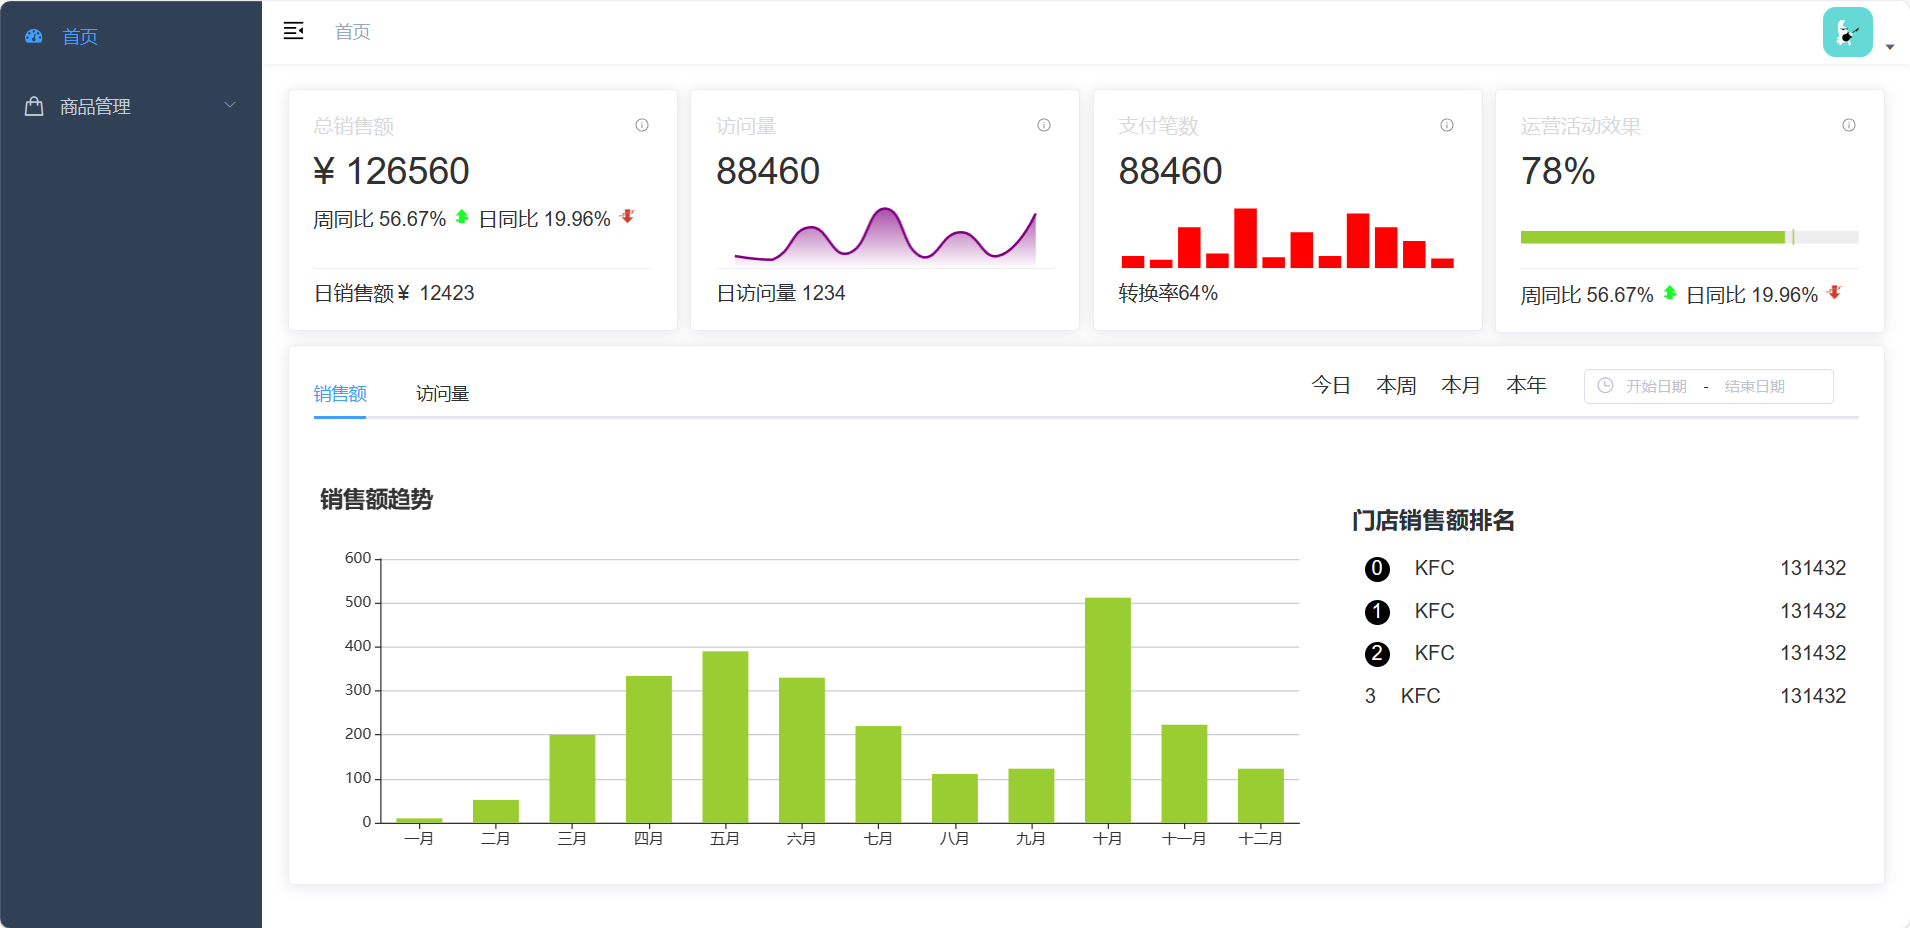
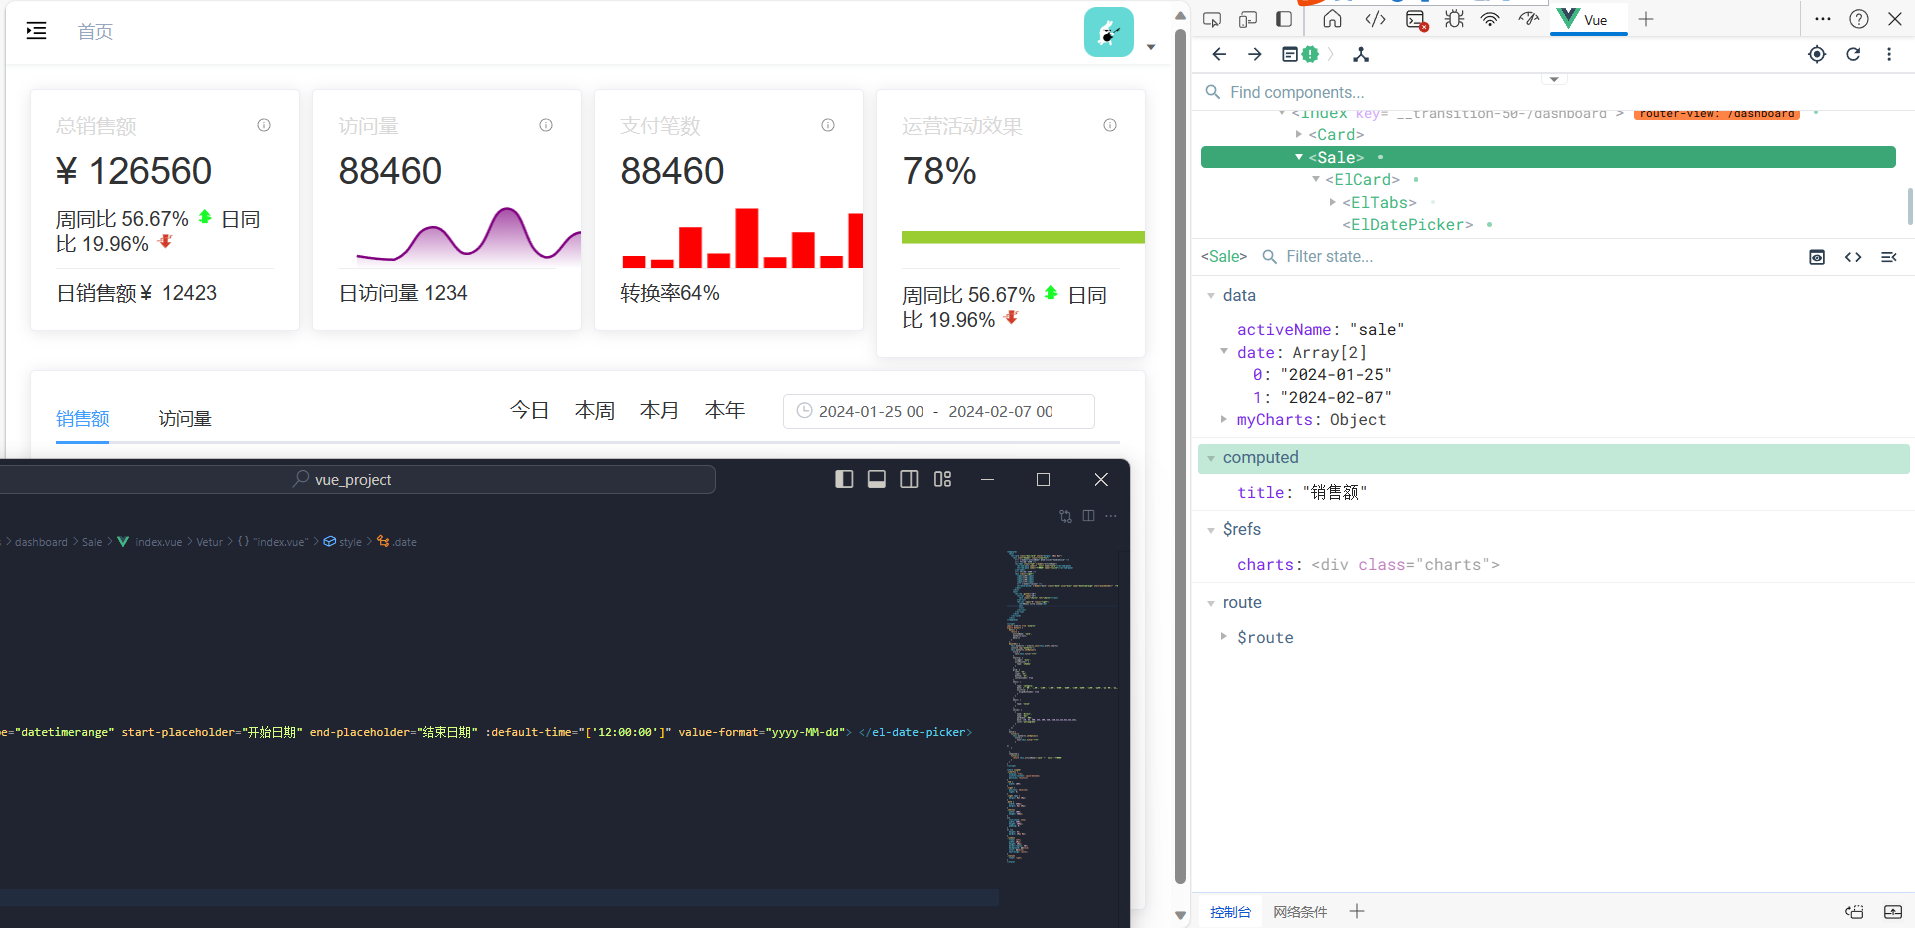
实现效果
然后写其他业务逻辑,先完成tab分栏的效果
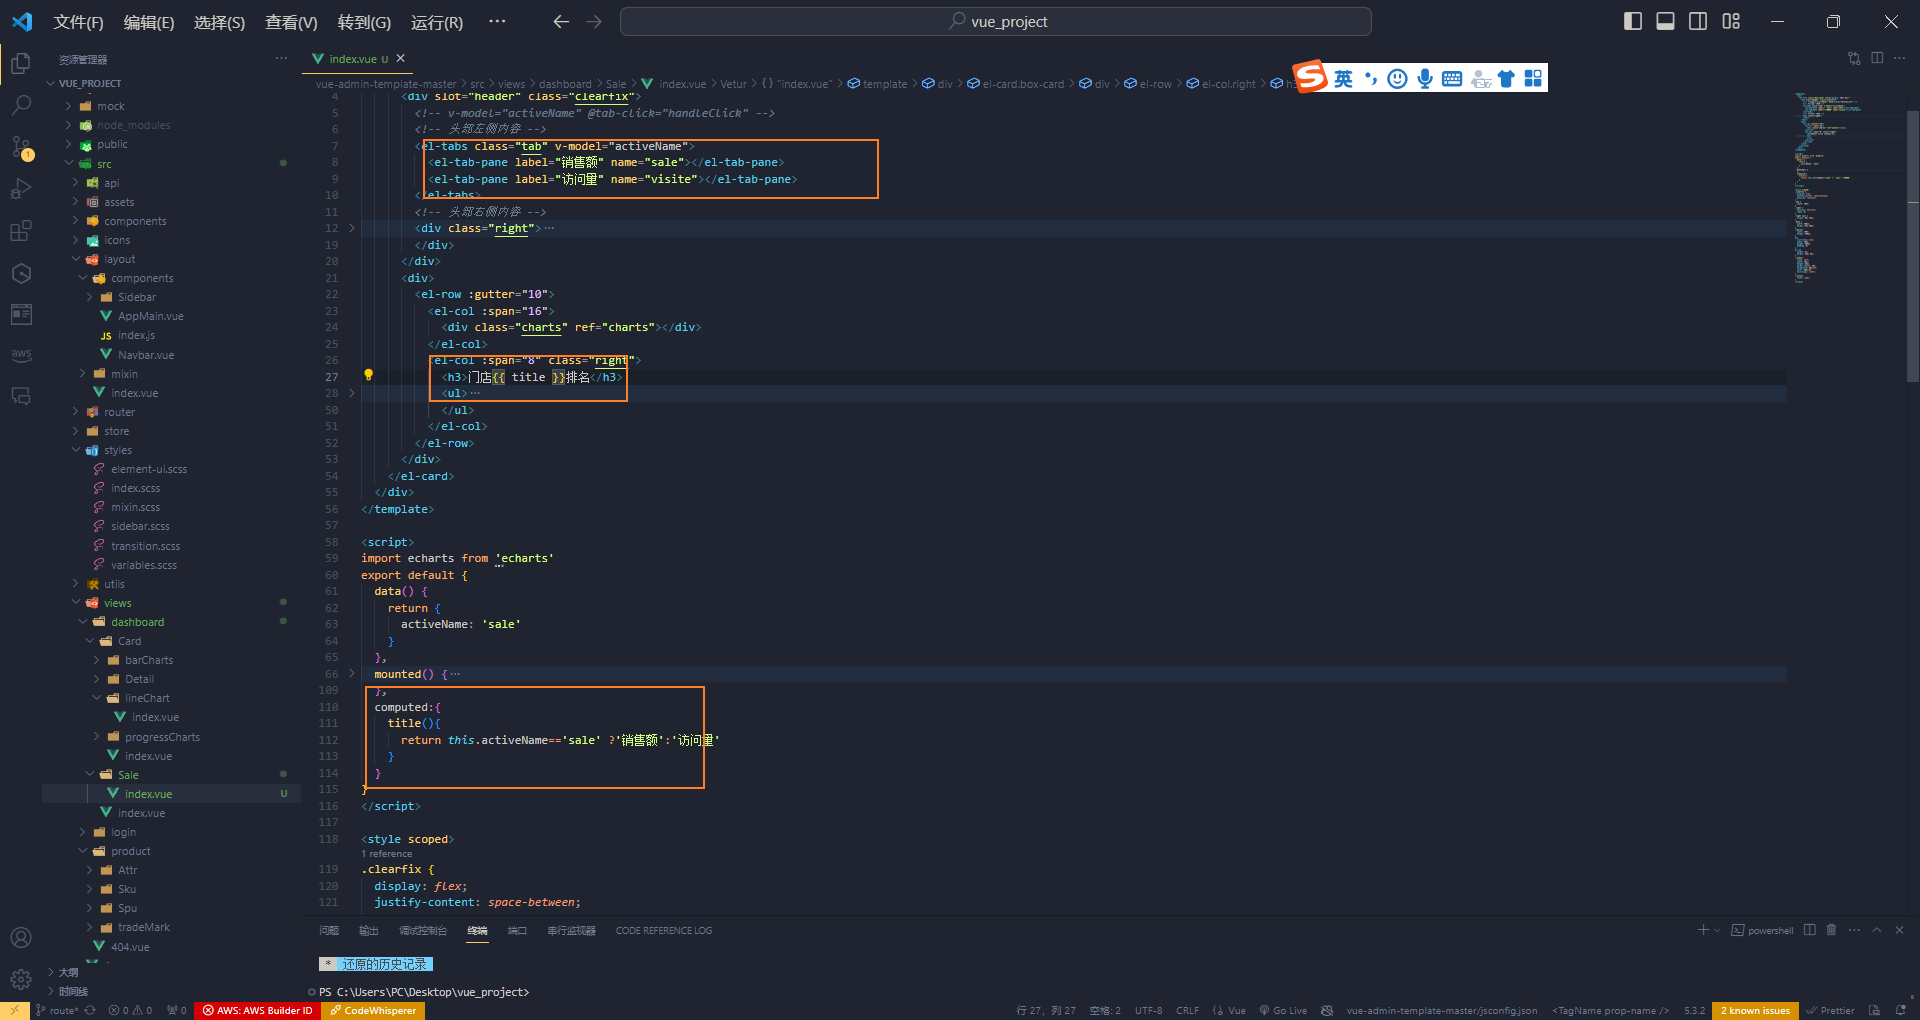
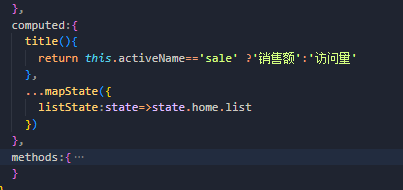
通过计算属性 title实现 点击tab 标题的改变
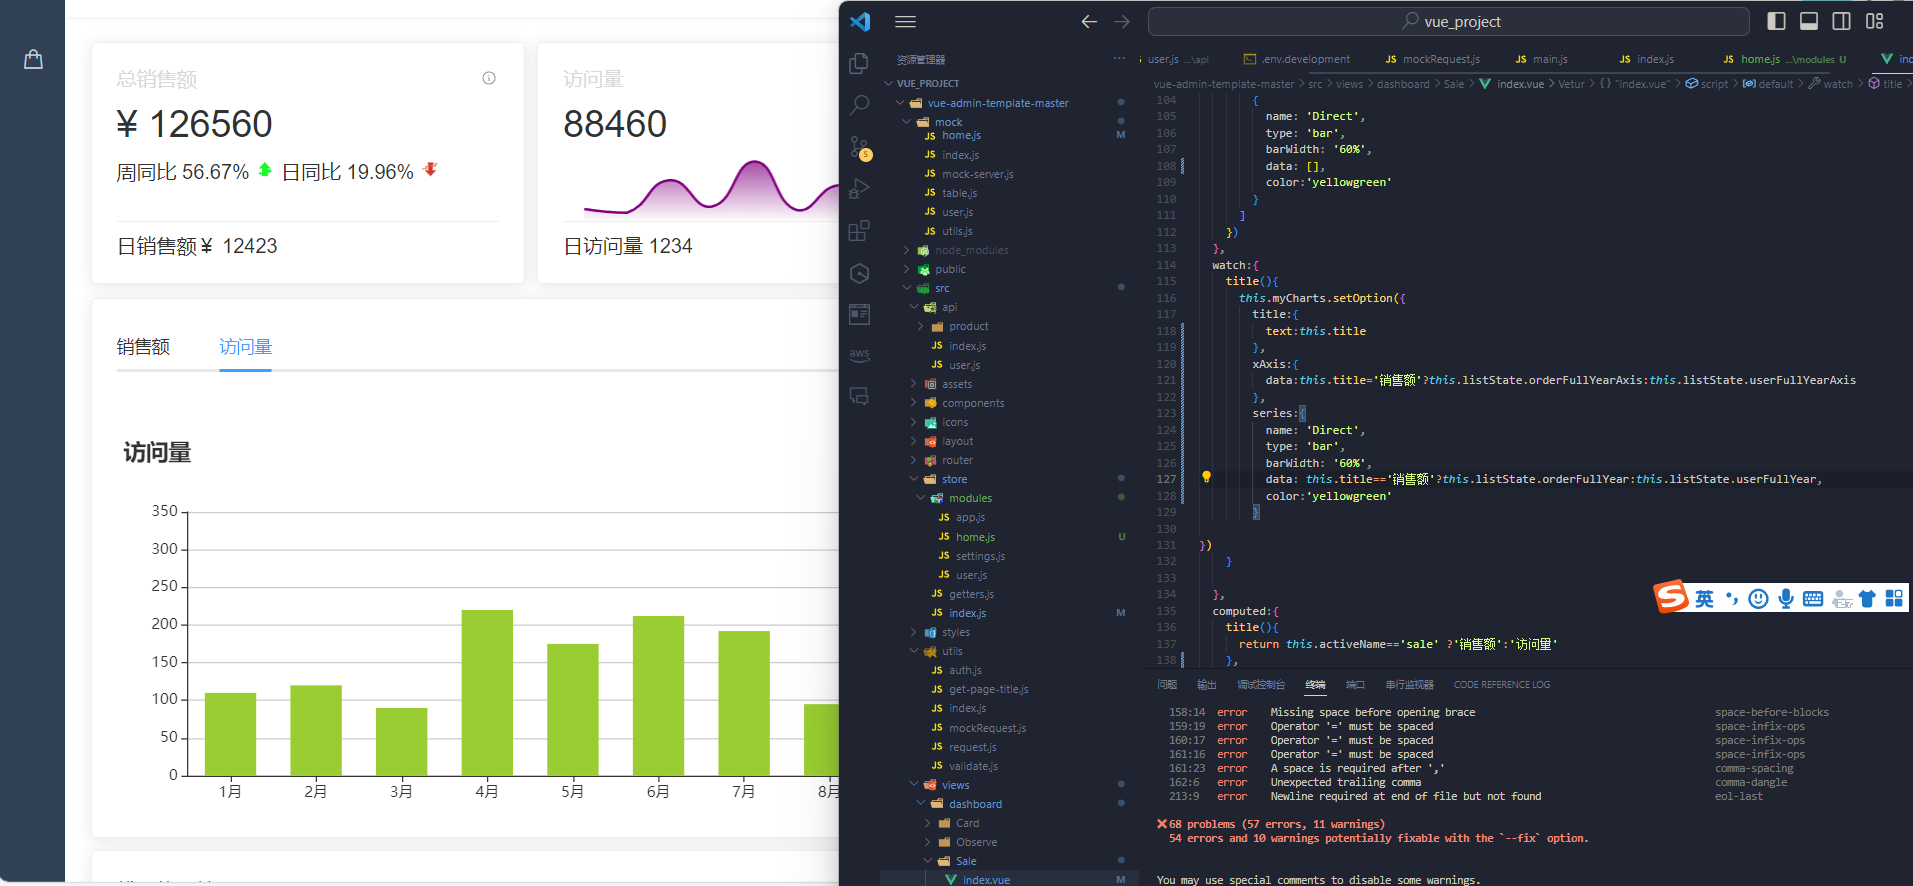
这里有一个注意点,无法修改图表中标题 因为mounted只能触发一次 因此我需要监听这个属性,让他修改
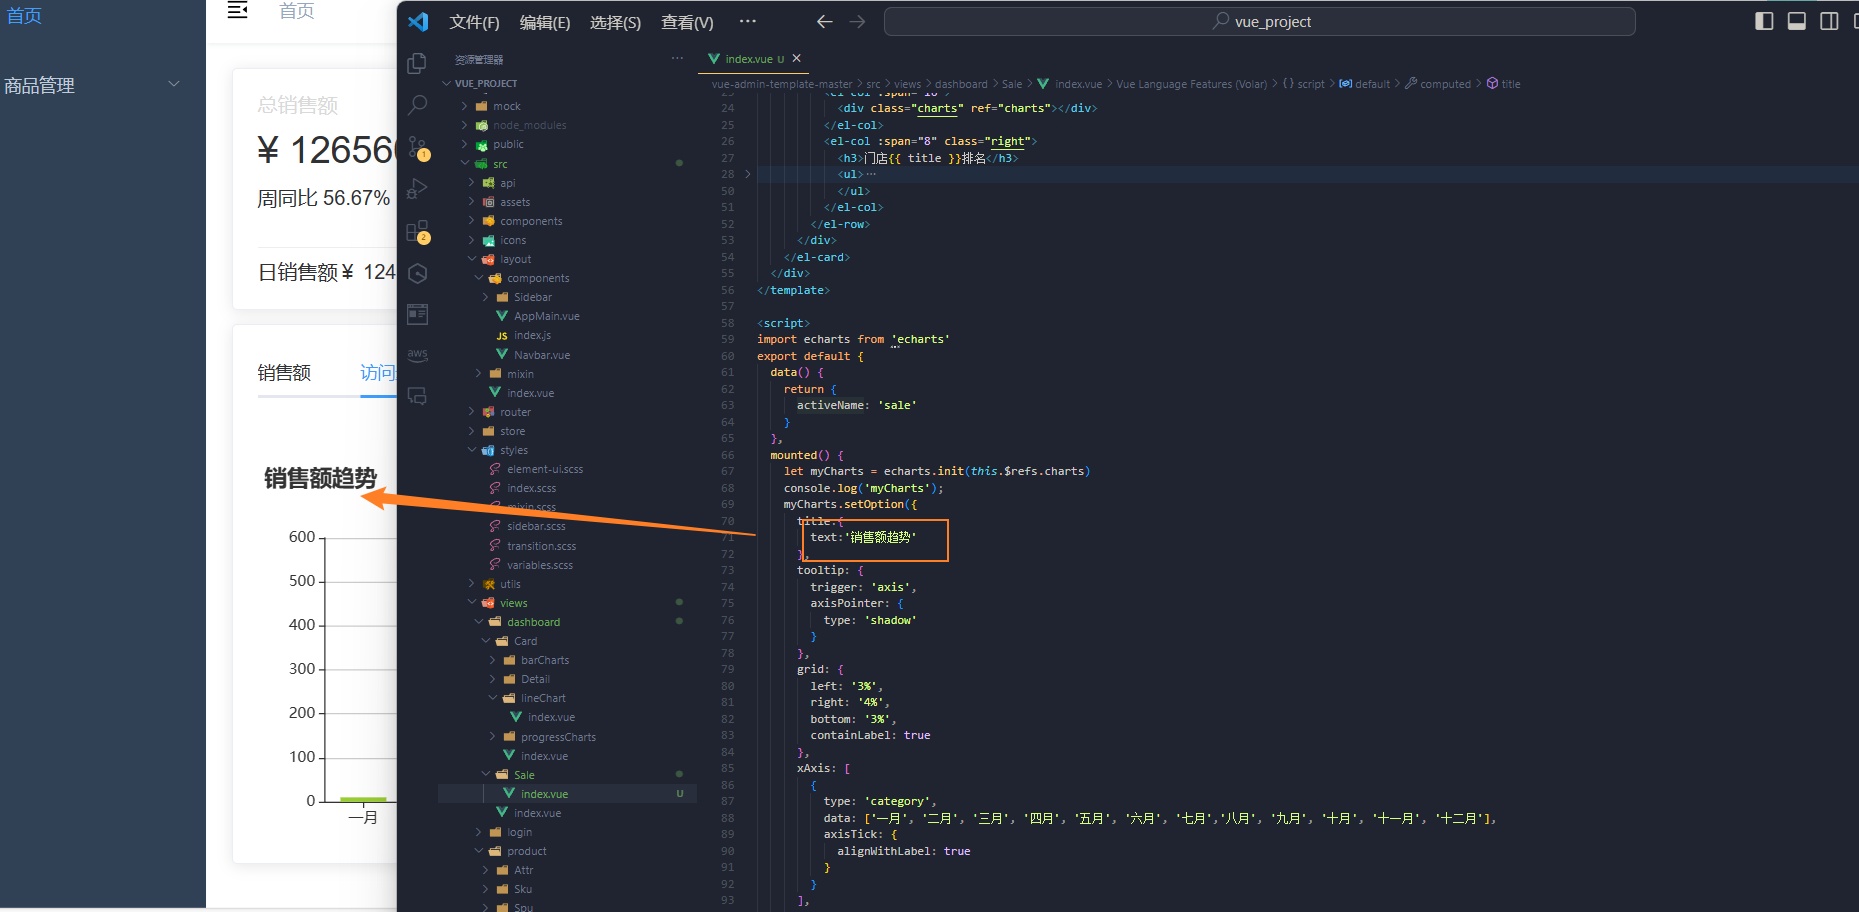
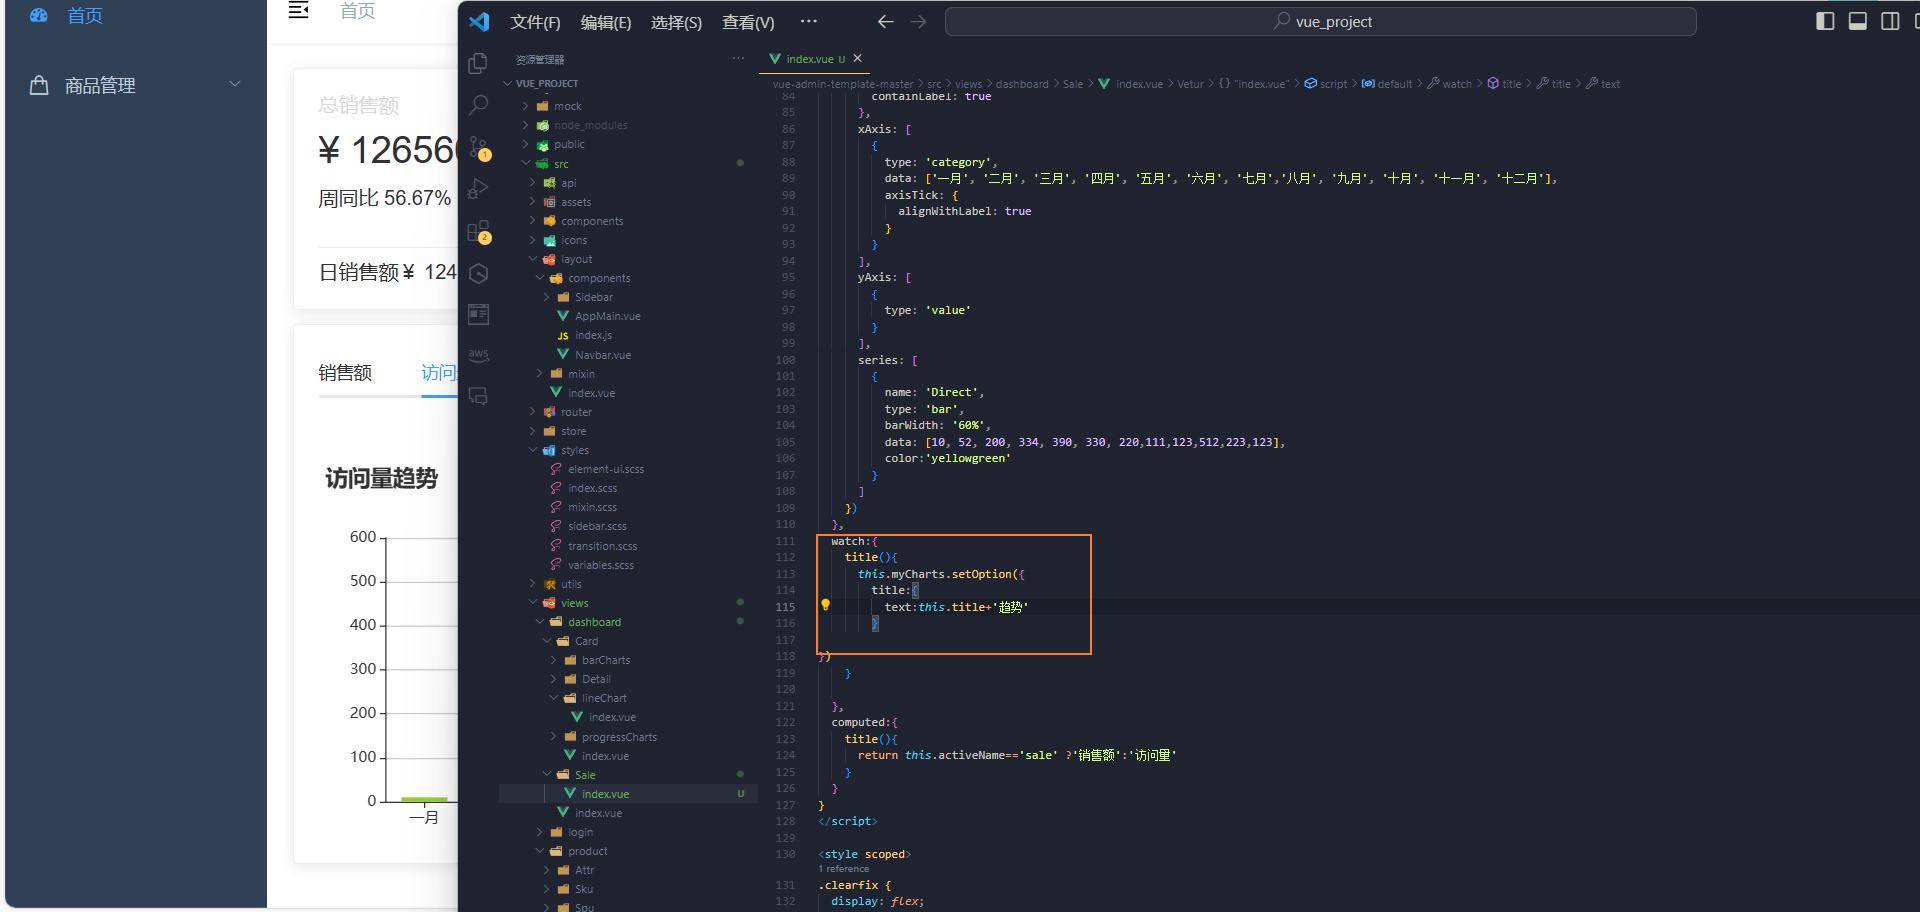
这就完成图表中标题的修改,接下来完成点击为当前日期
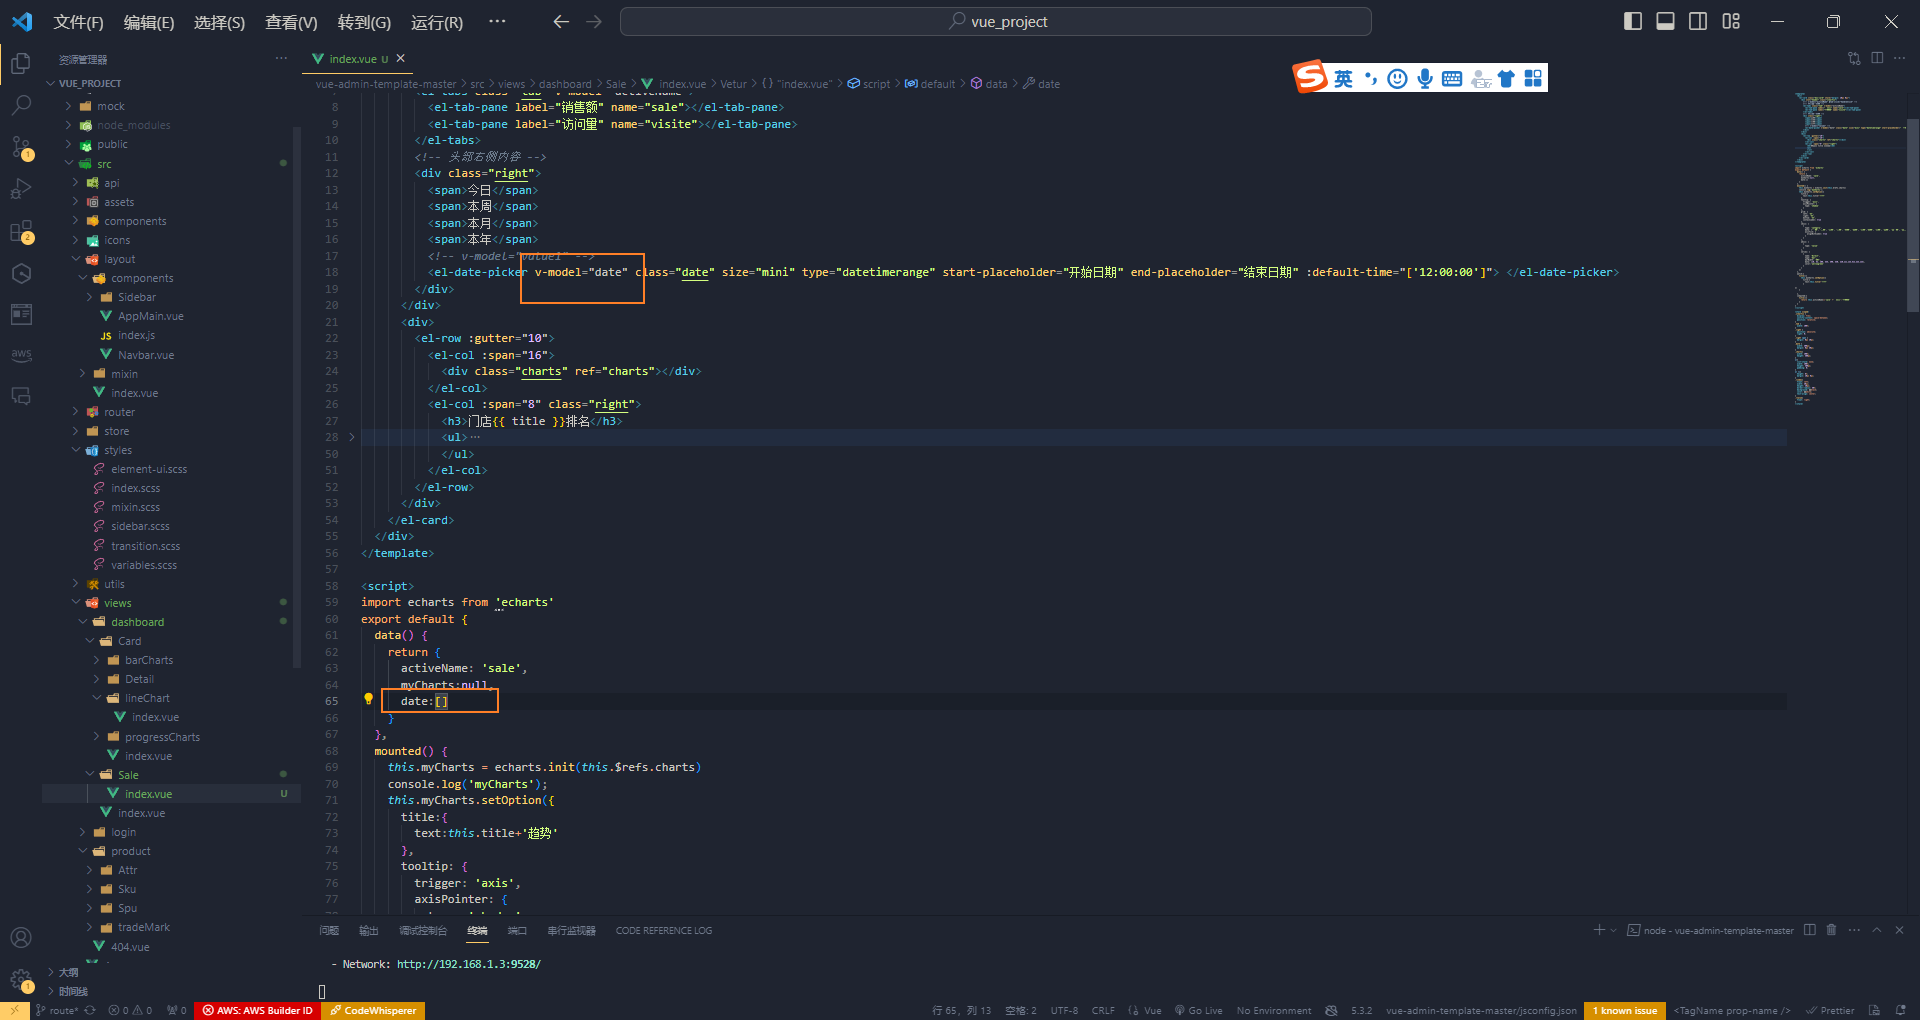 先收集到数据,这个数据是数组类型
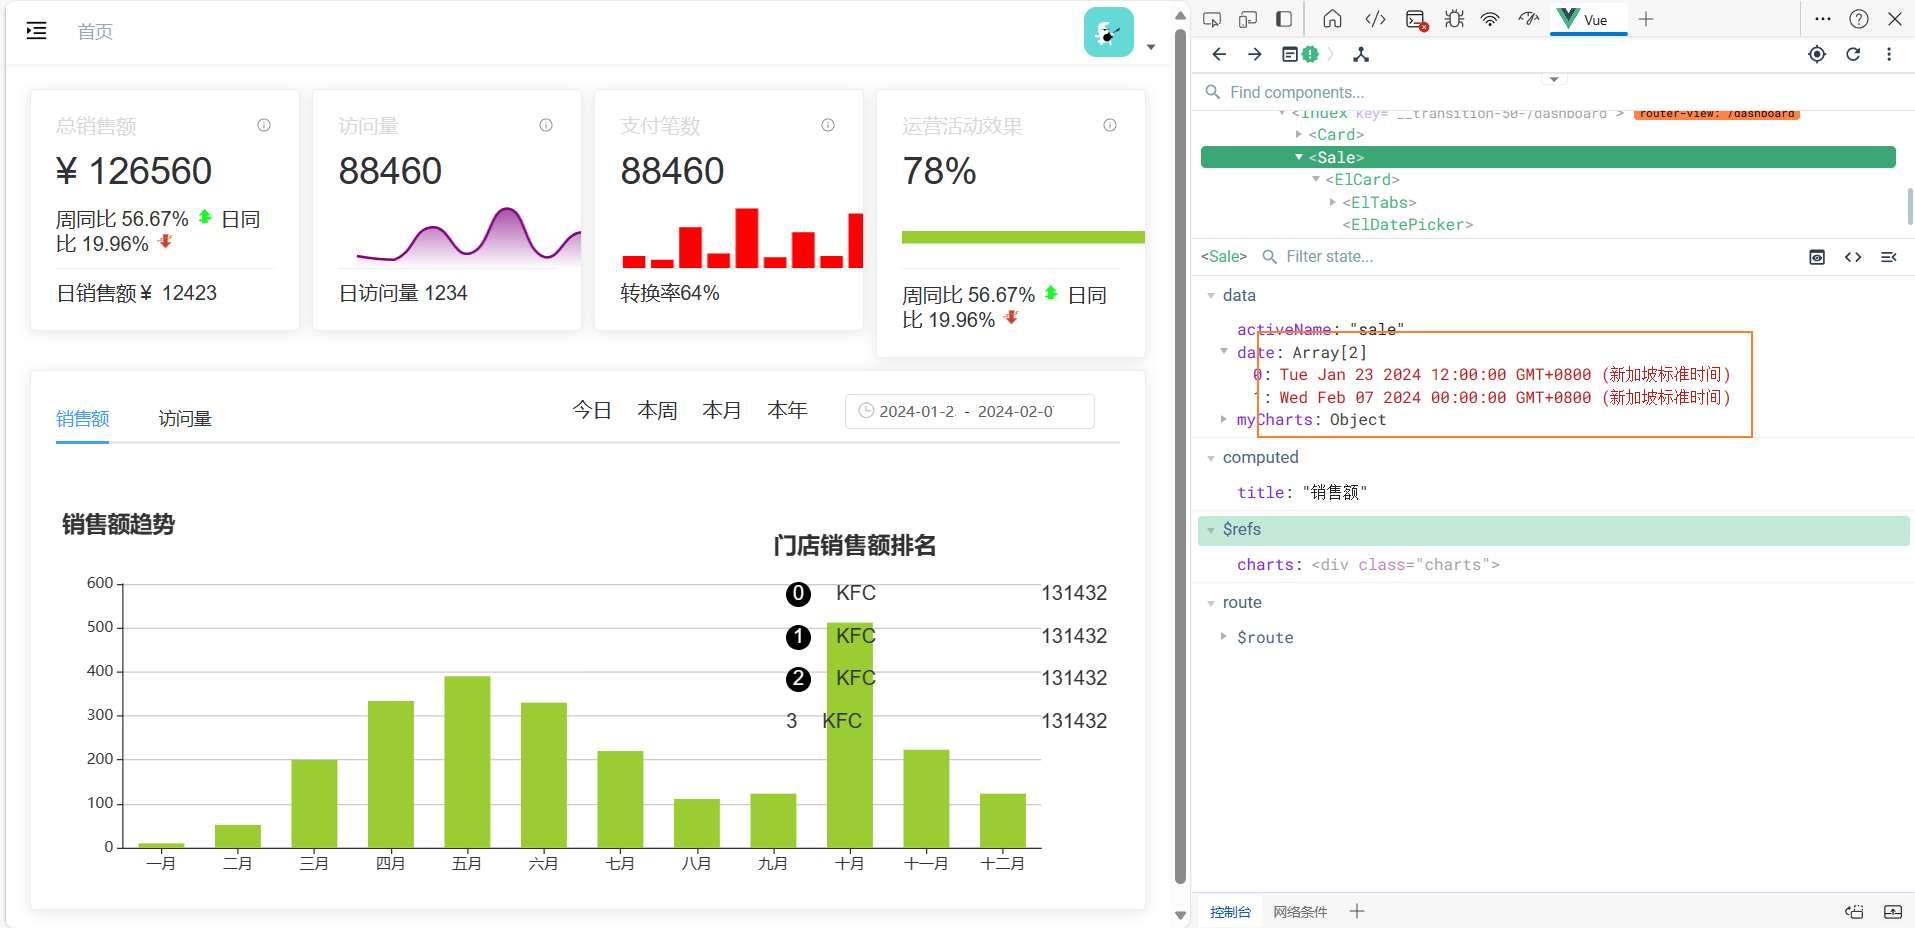
收集到的数据是这样的
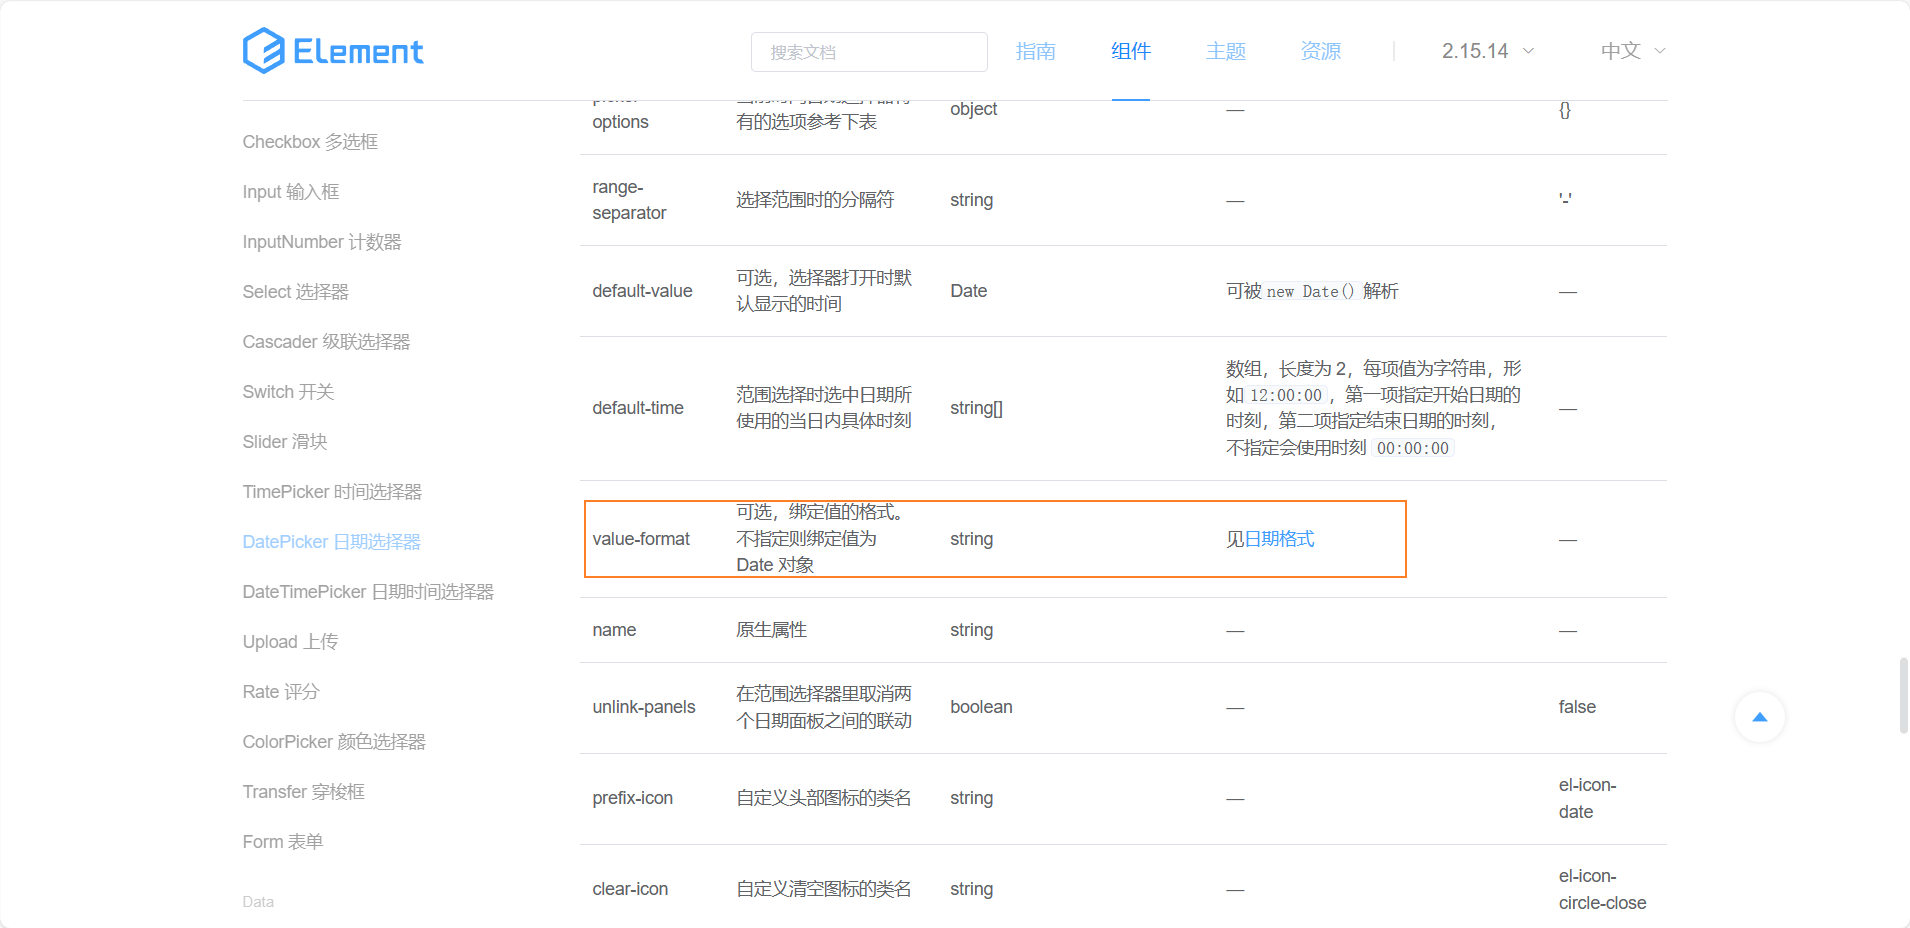 查看文档修改其中的类型,通过value-format这个属性
实现点击今日,本周等切换其中数据
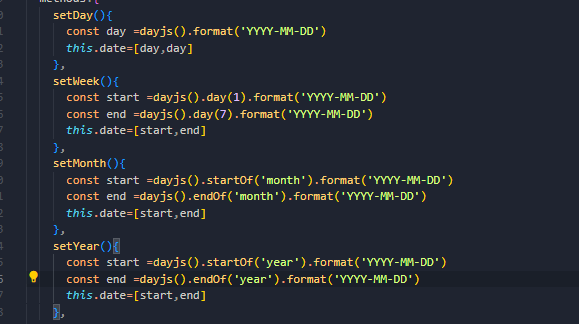
先要得到当前的日期,我们这里可以使用day.js
先安装
![]()
然后引入
书写点击后的方法
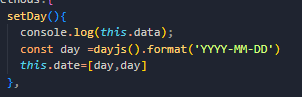
效果实现
同理书写本周,月,年
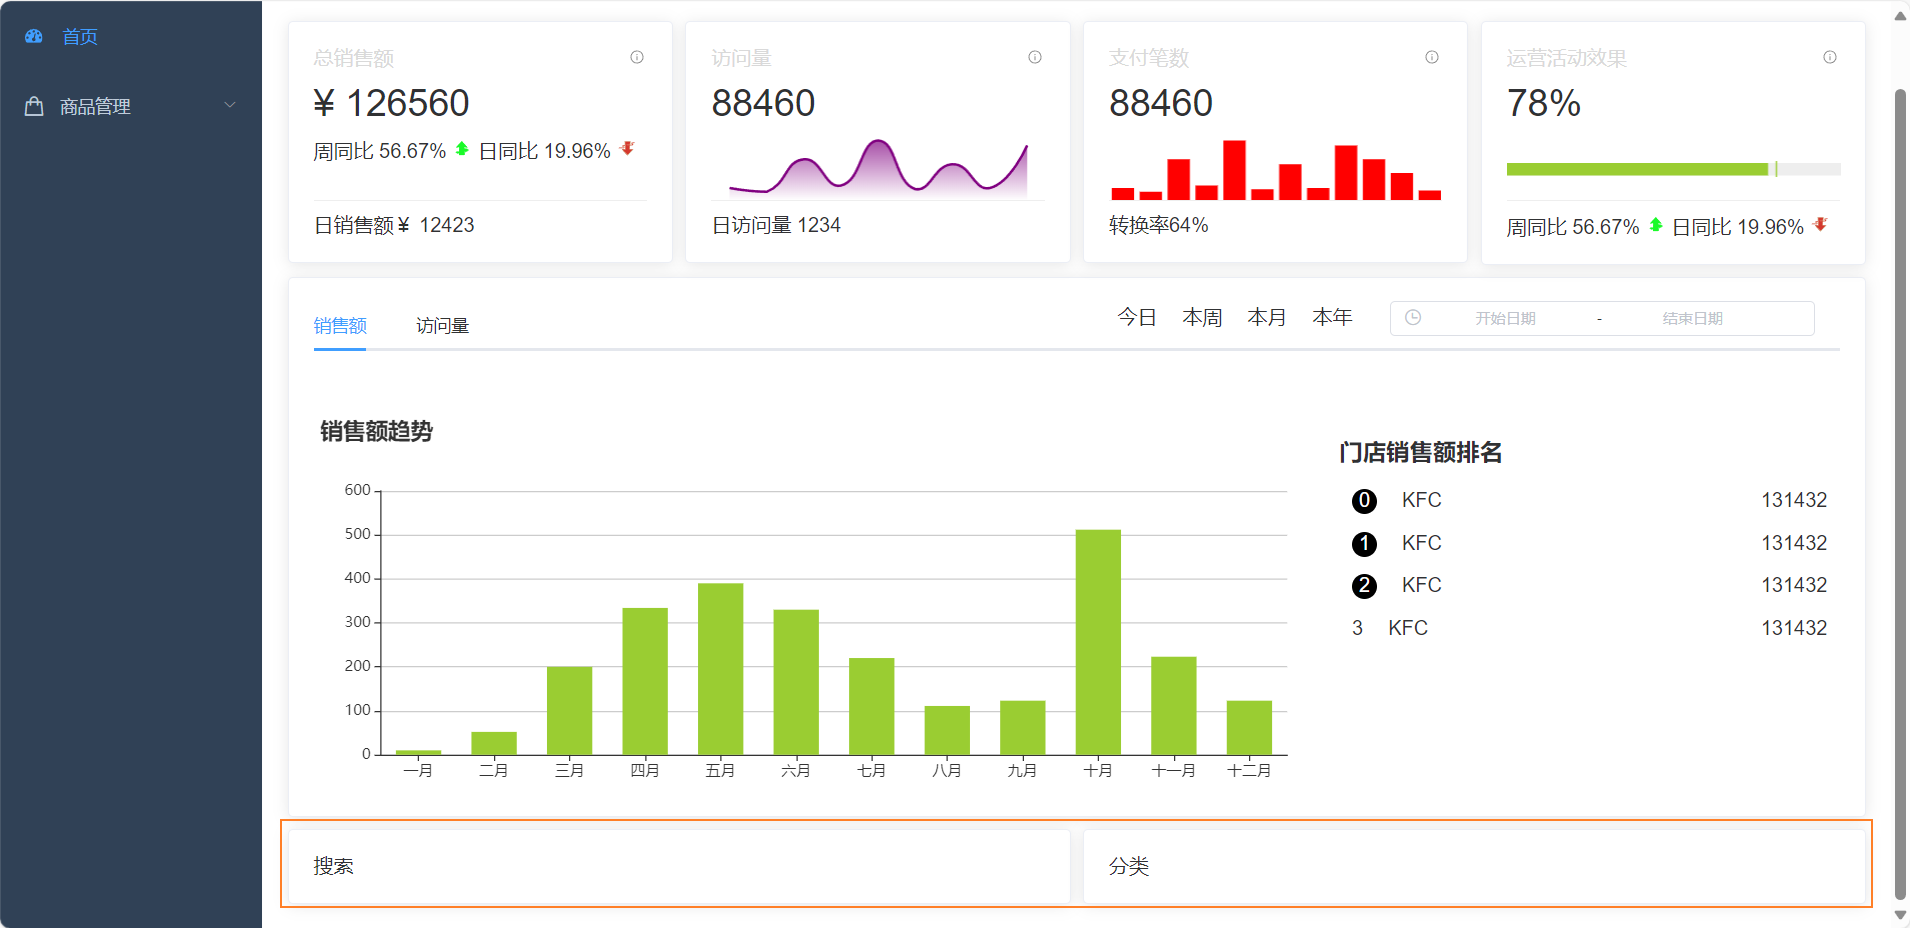
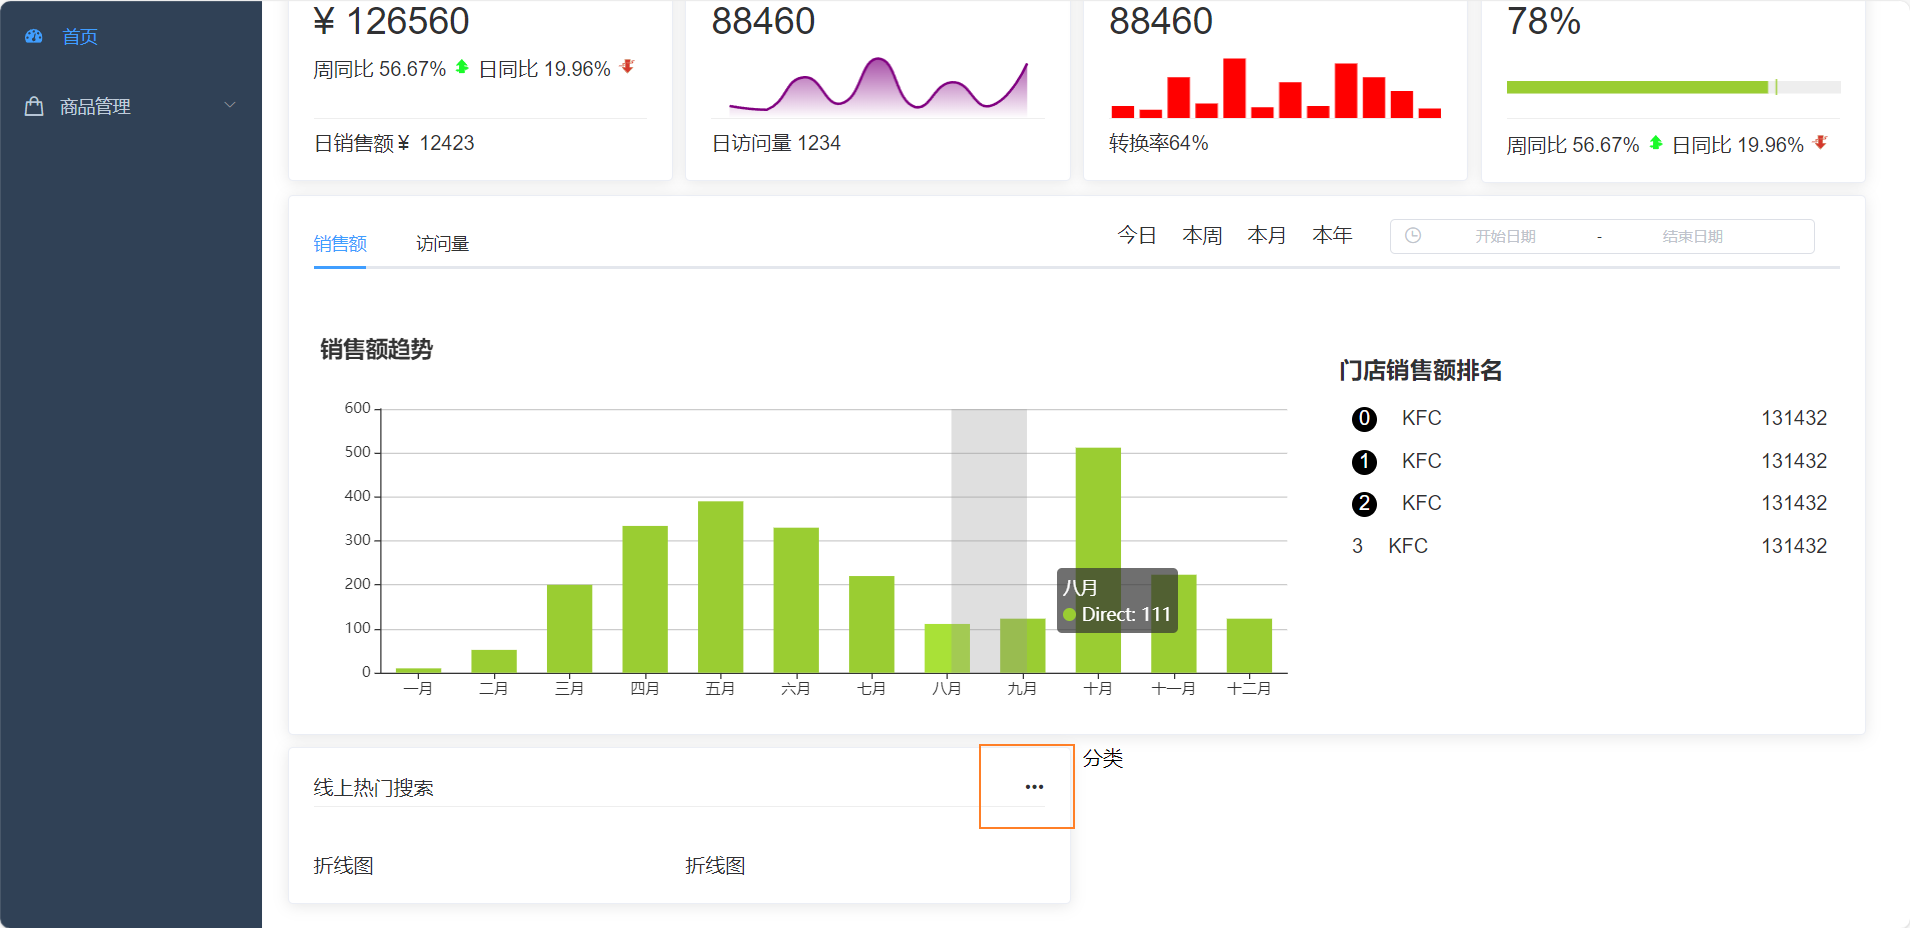
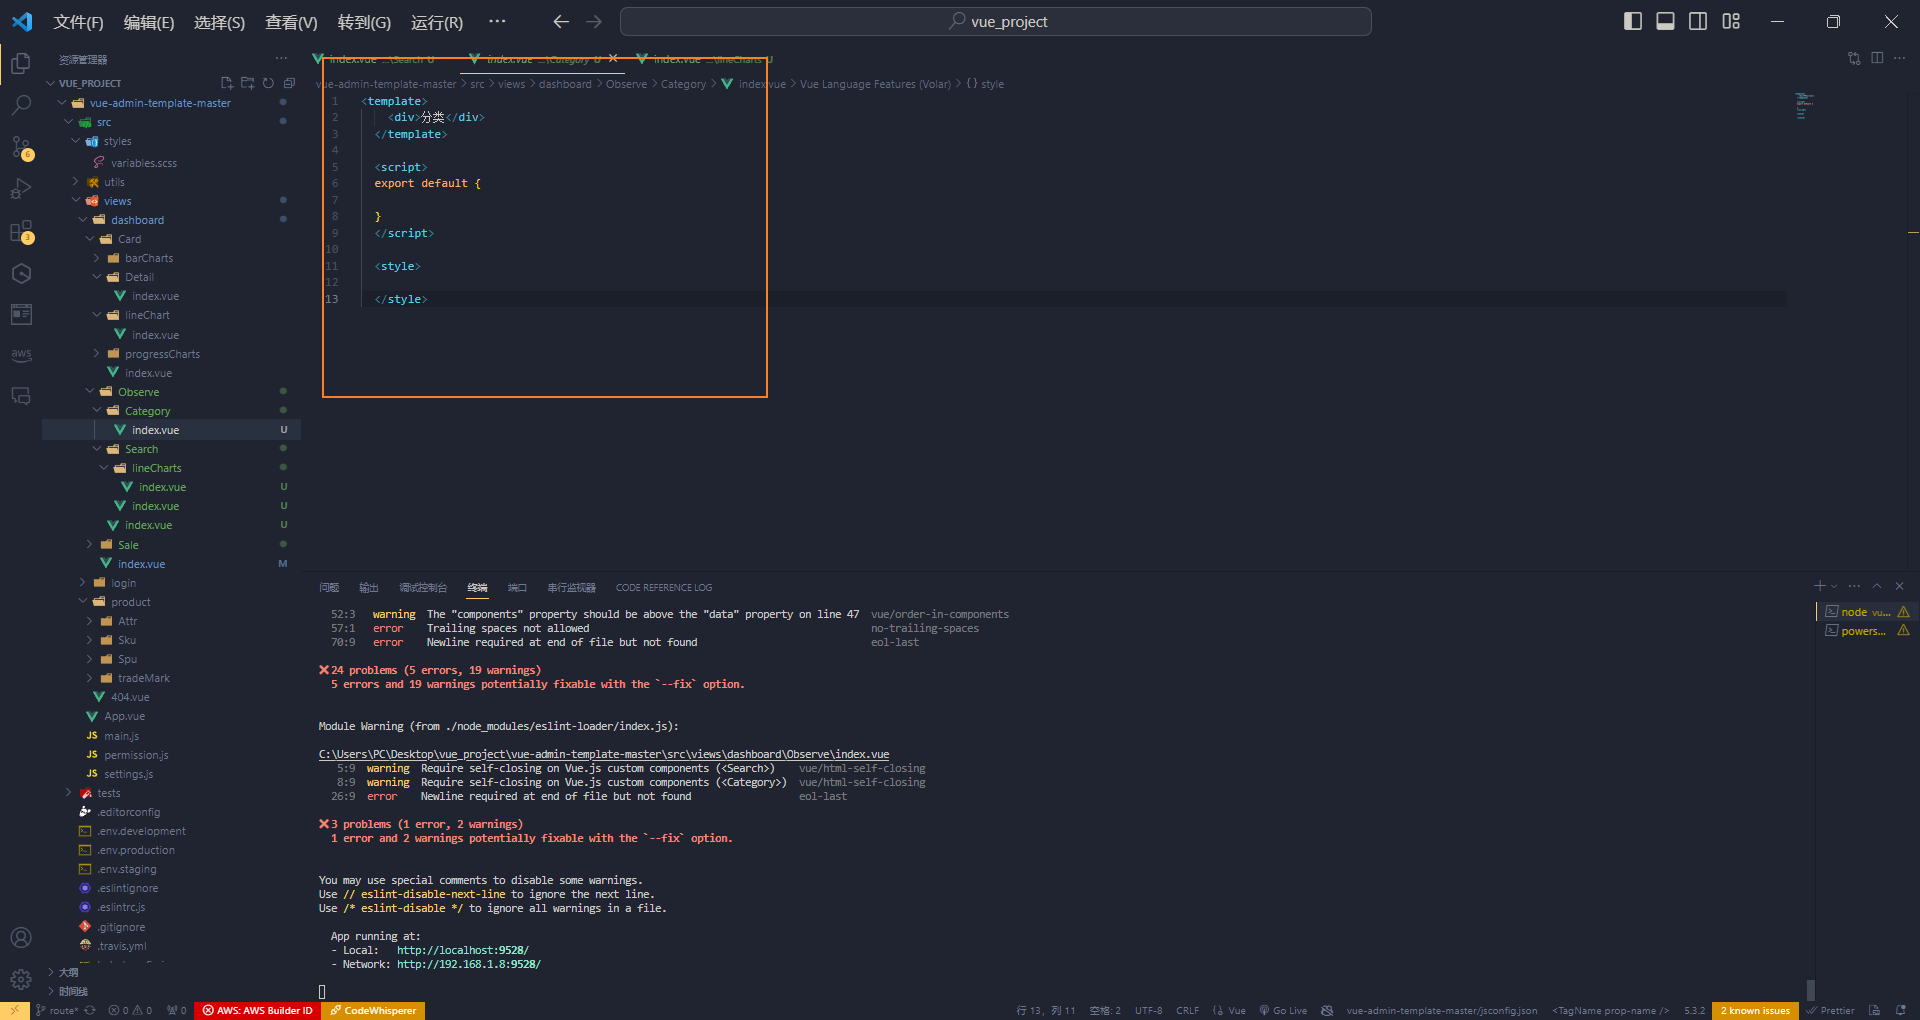
observe静态组件
完成底部组件静态设计
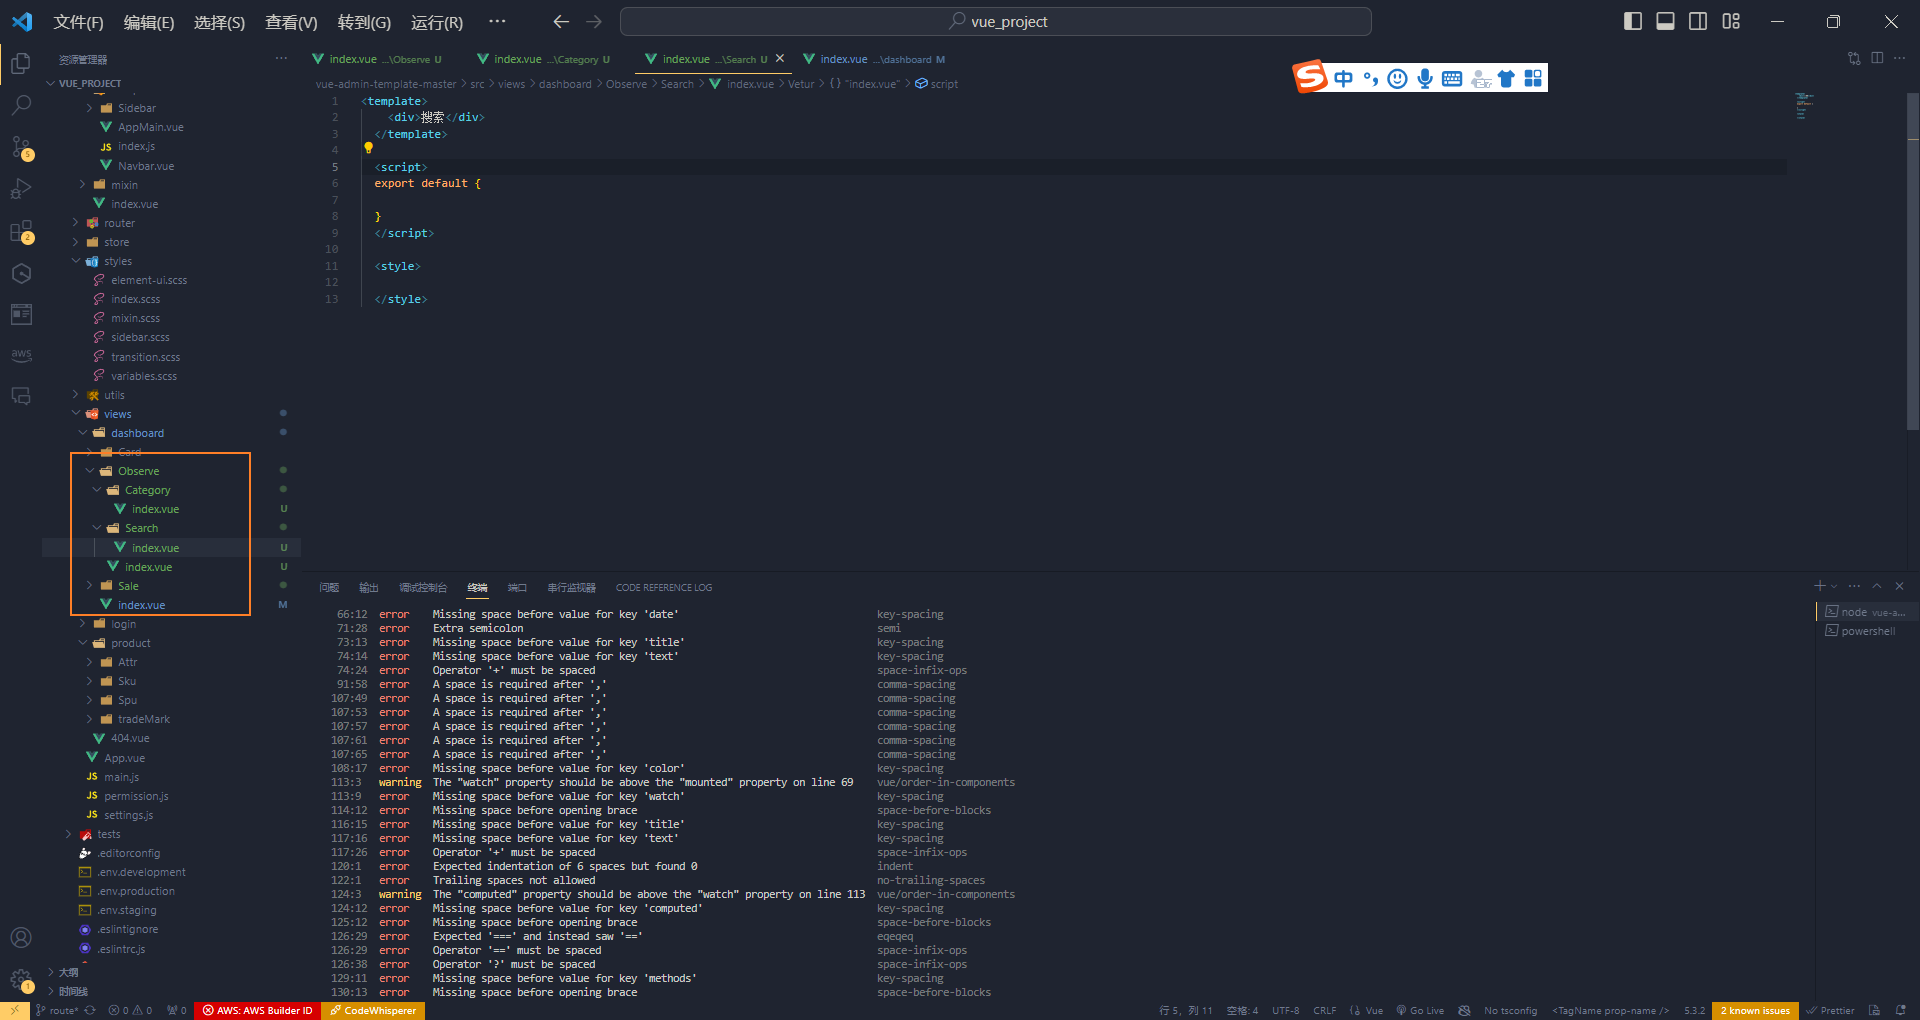
我们的设计是一个大的容器里面分成俩个小容器

 完成左侧的搜索
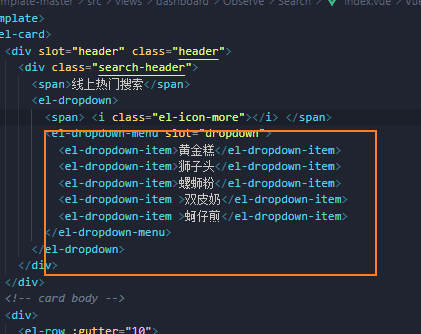
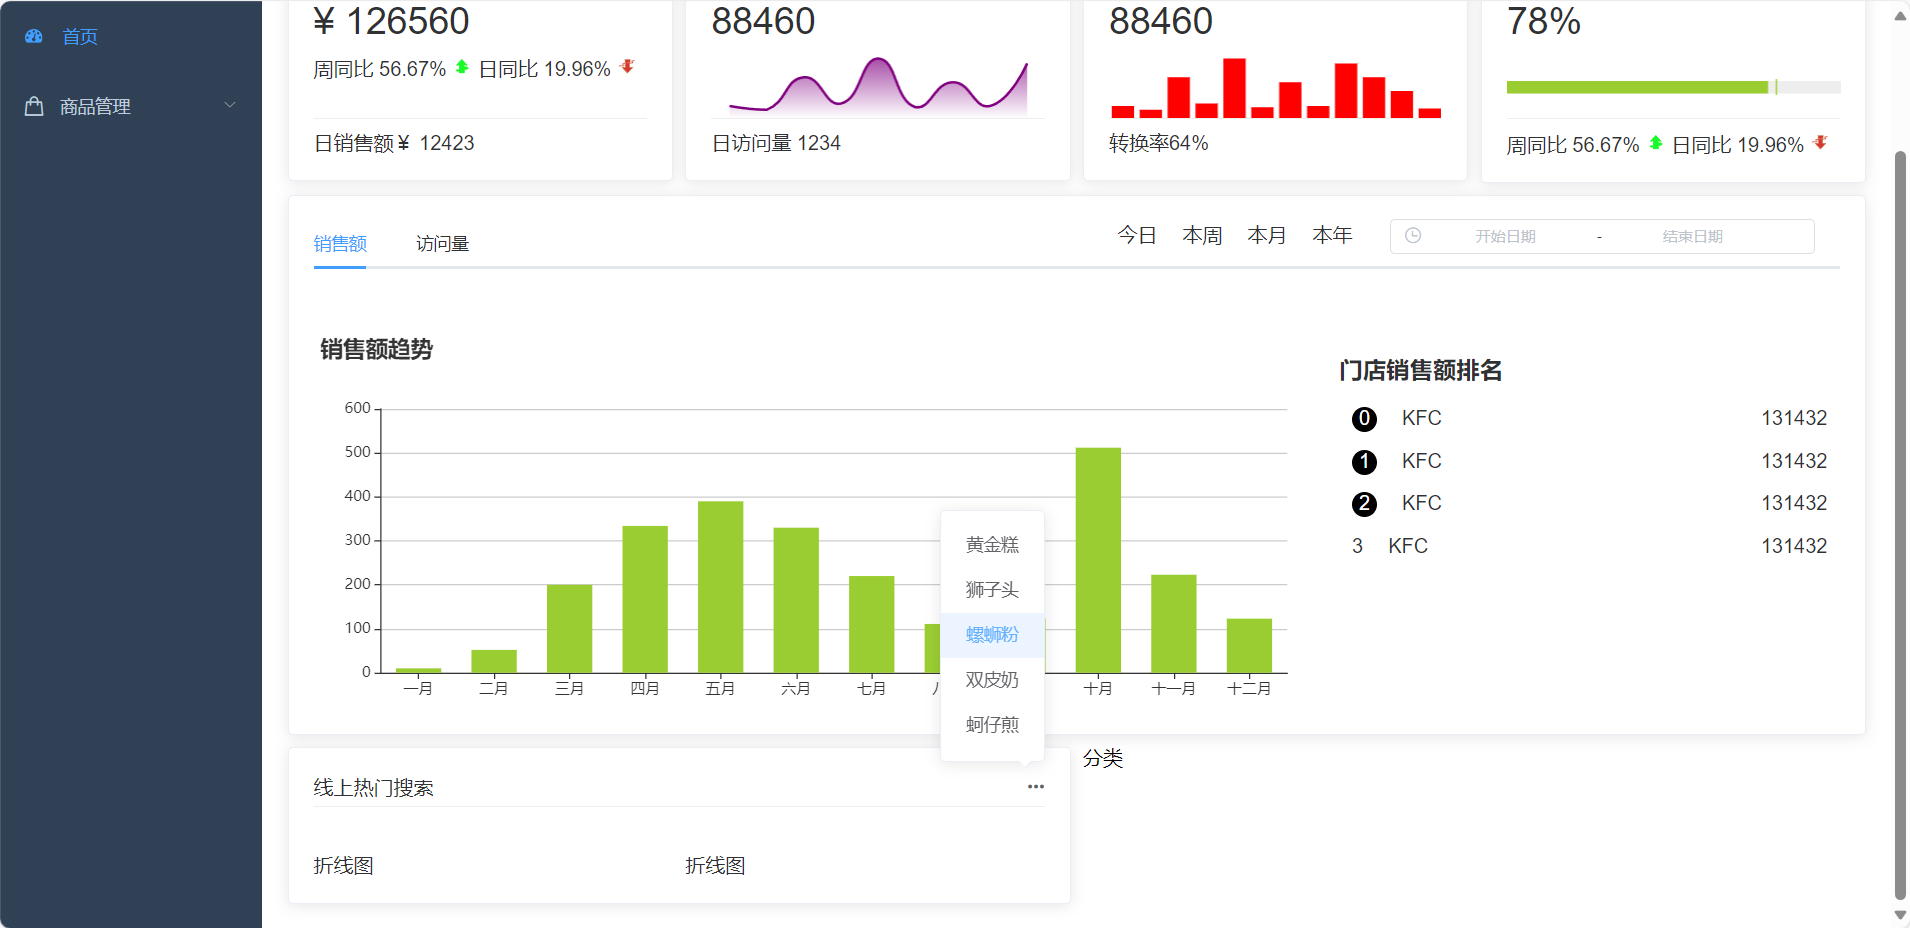
 现在实现效果,点击右侧的icon 出现下拉框
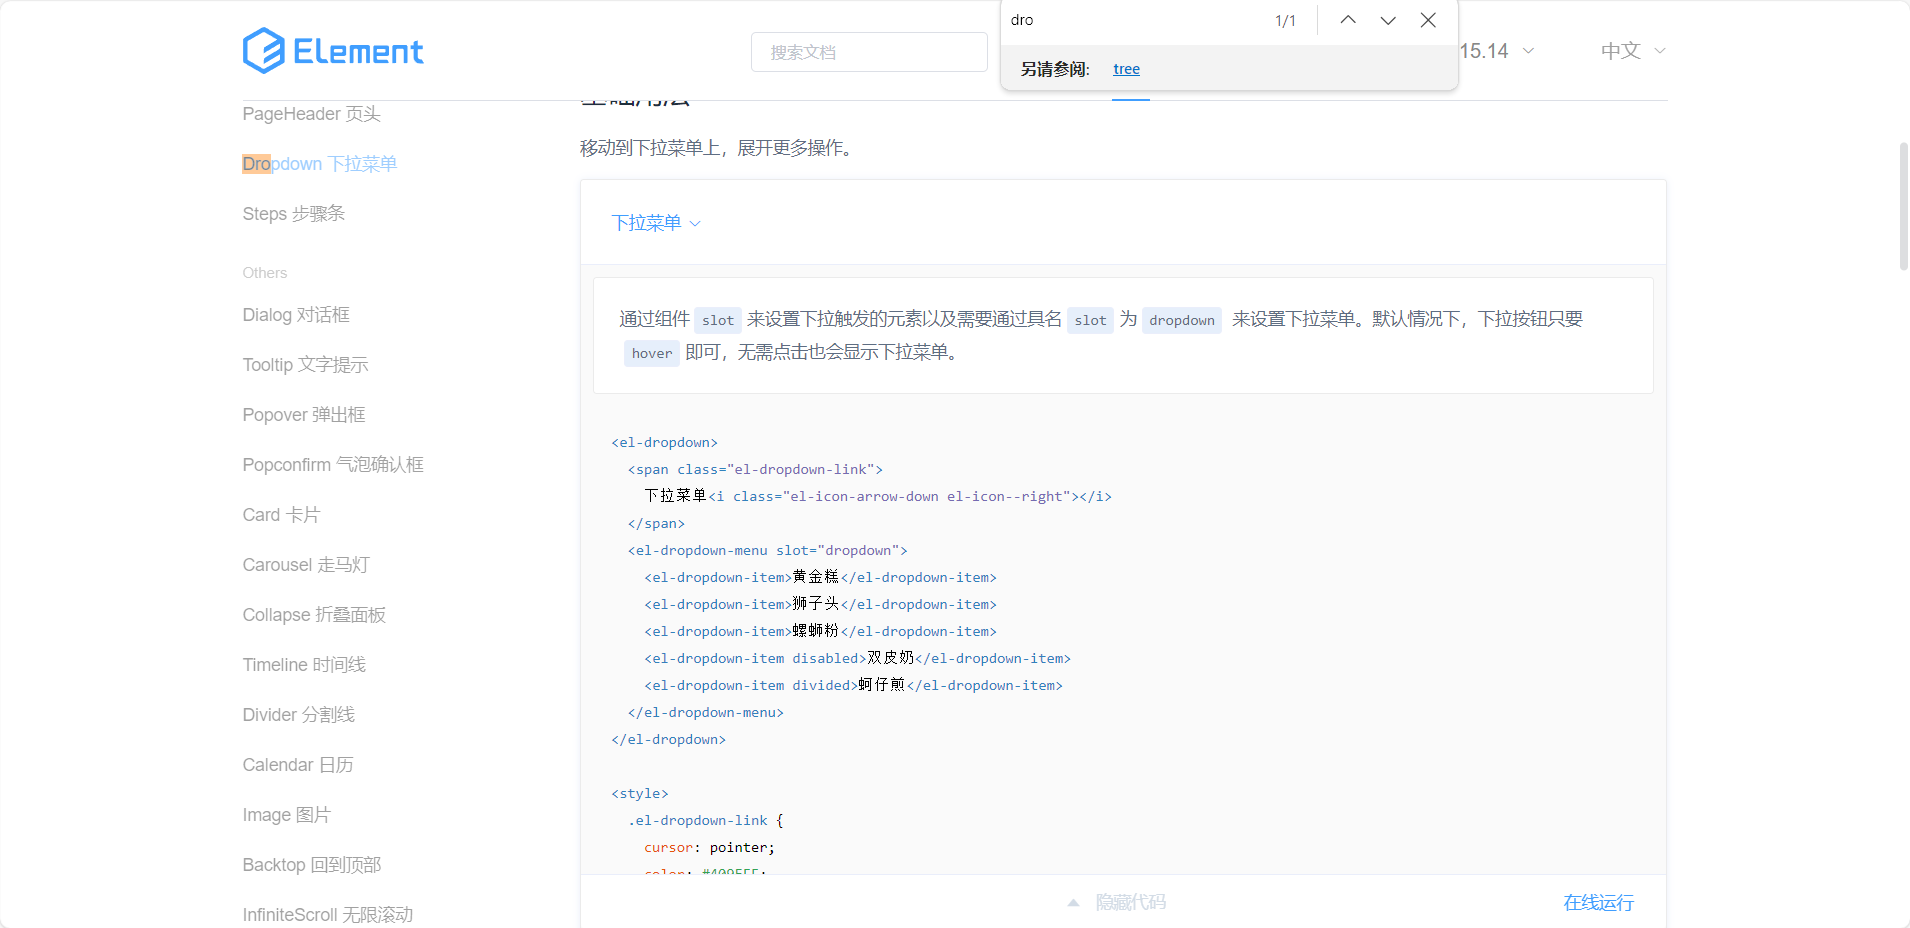
这里我们需要使用到新的组件el-dropdown,他参考代码复制到icon下面 即可
 书写折线图子组件
就是把之前书写过的折现图直接复制过来,然后写下面的table栏
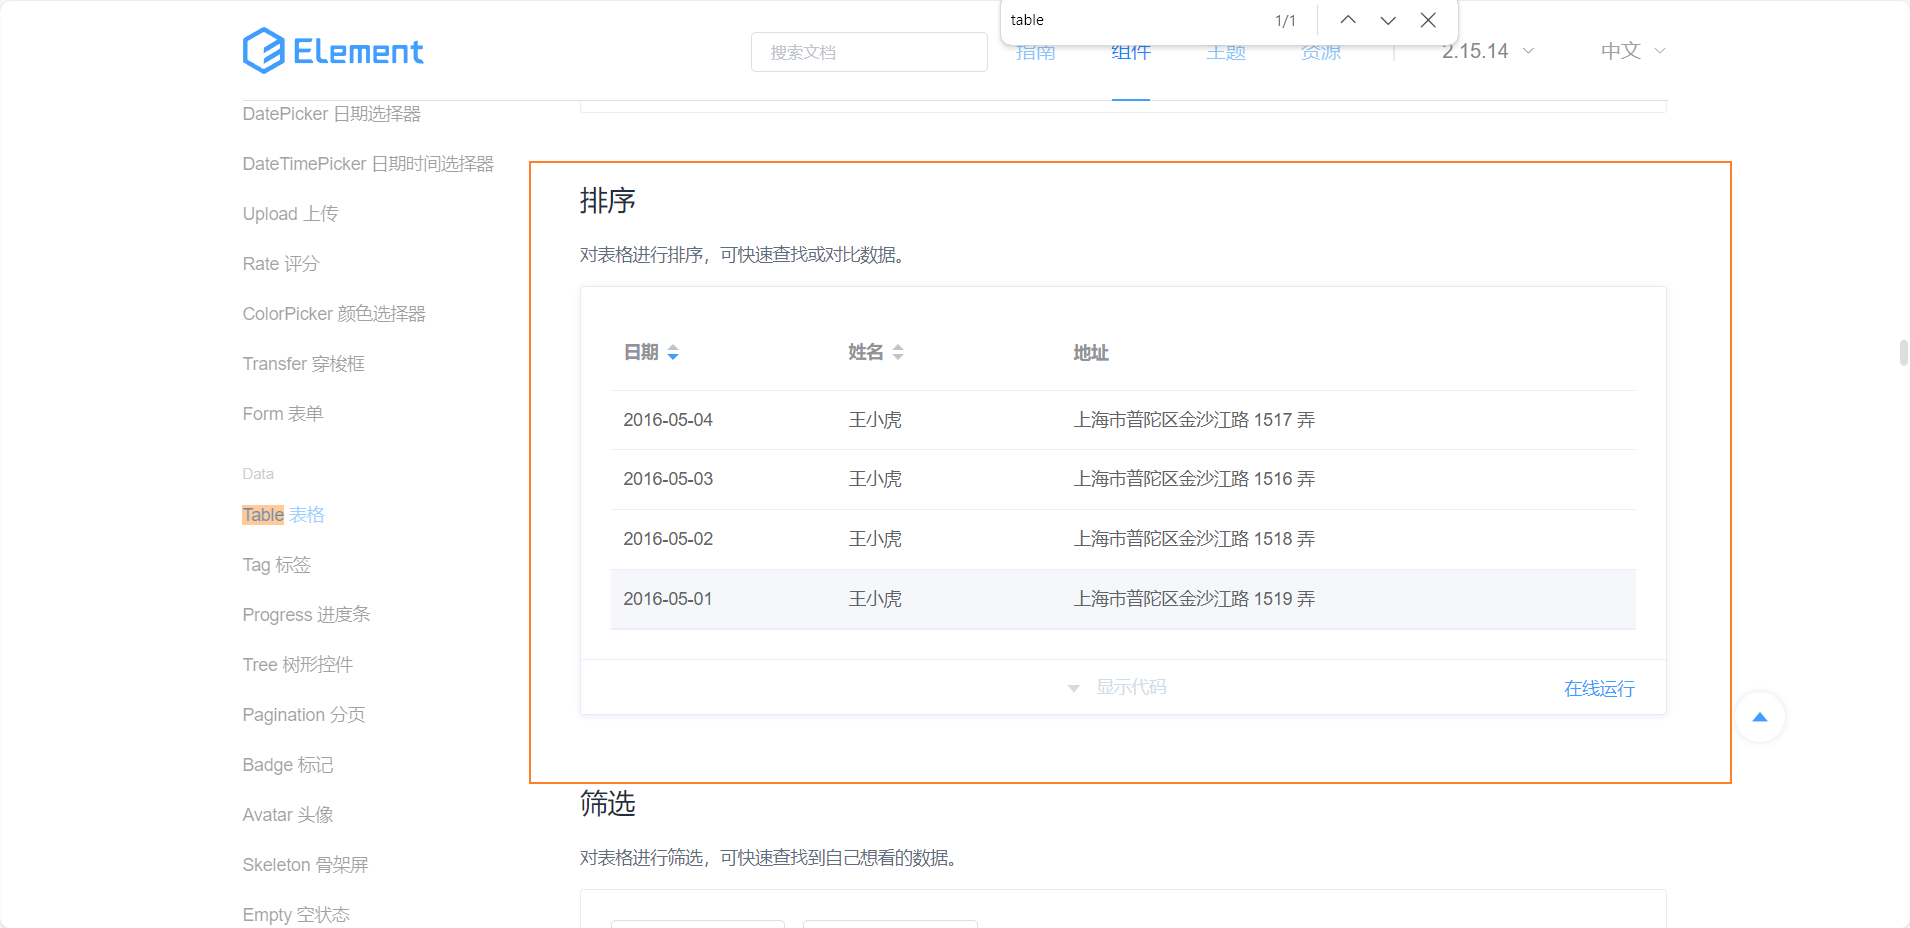
官网找到类似的,直接复制到代码中
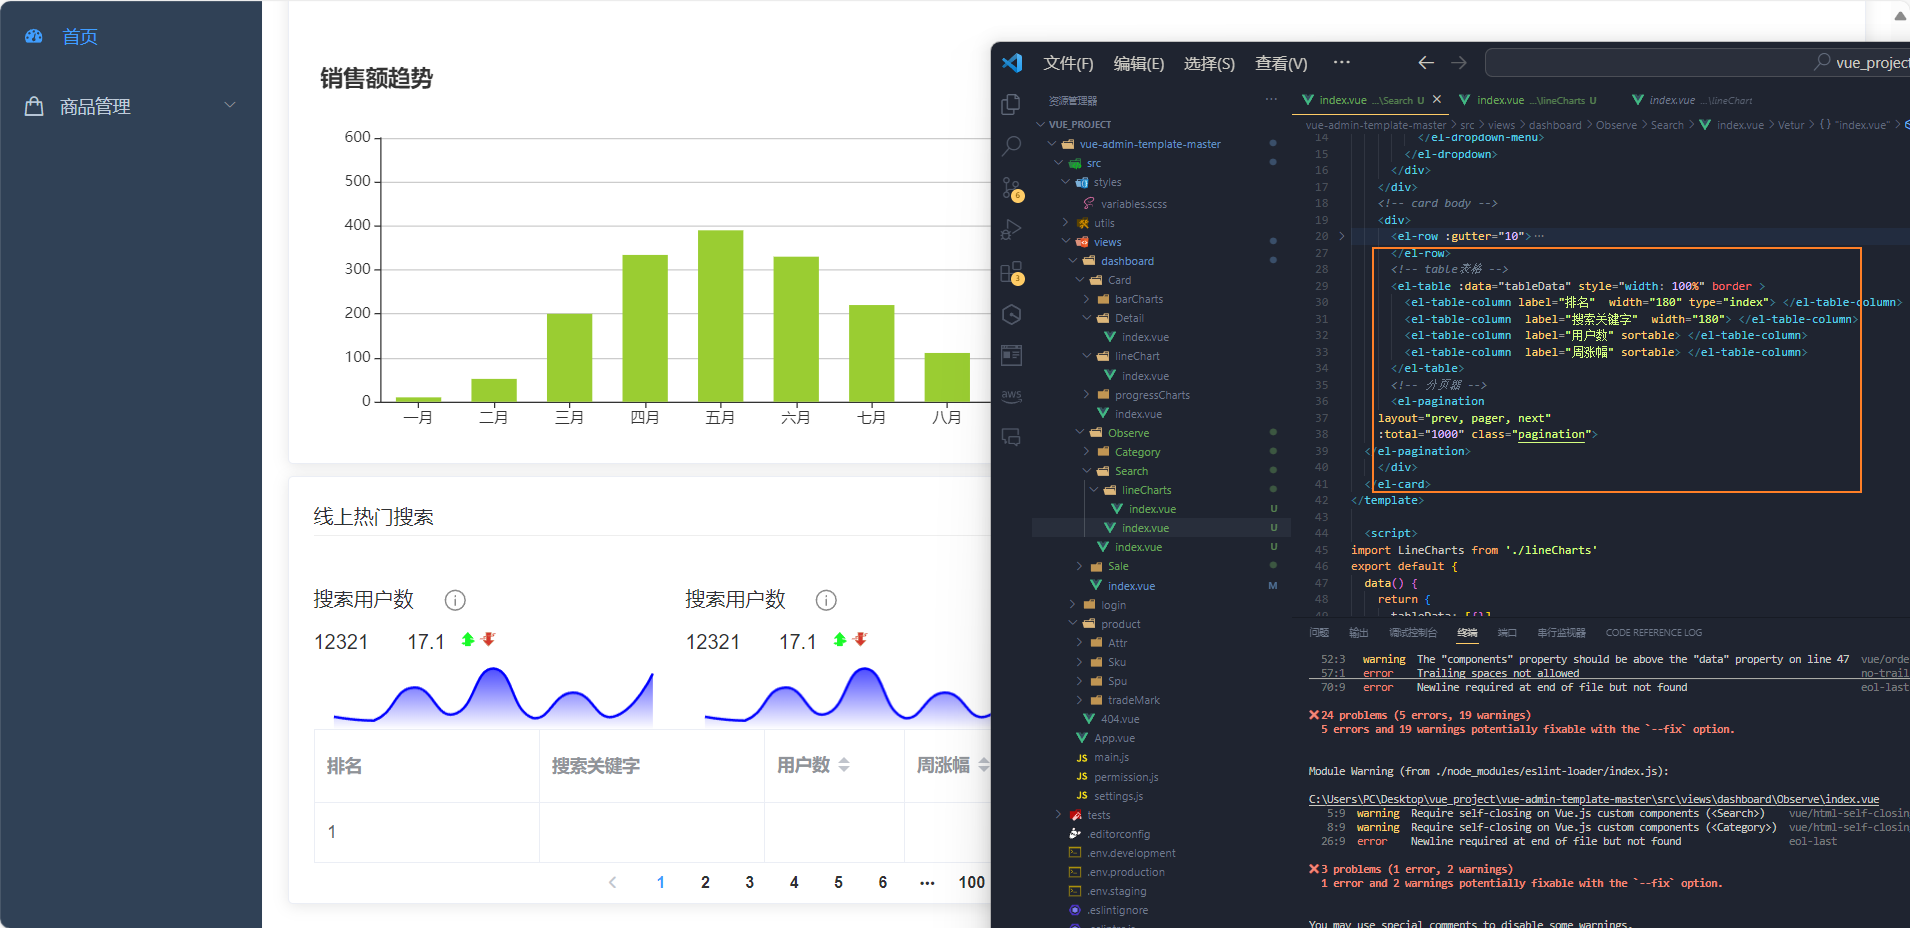
左侧的线上热门搜索大致就是这样,右侧销售额分类效果类似
回到子组件category
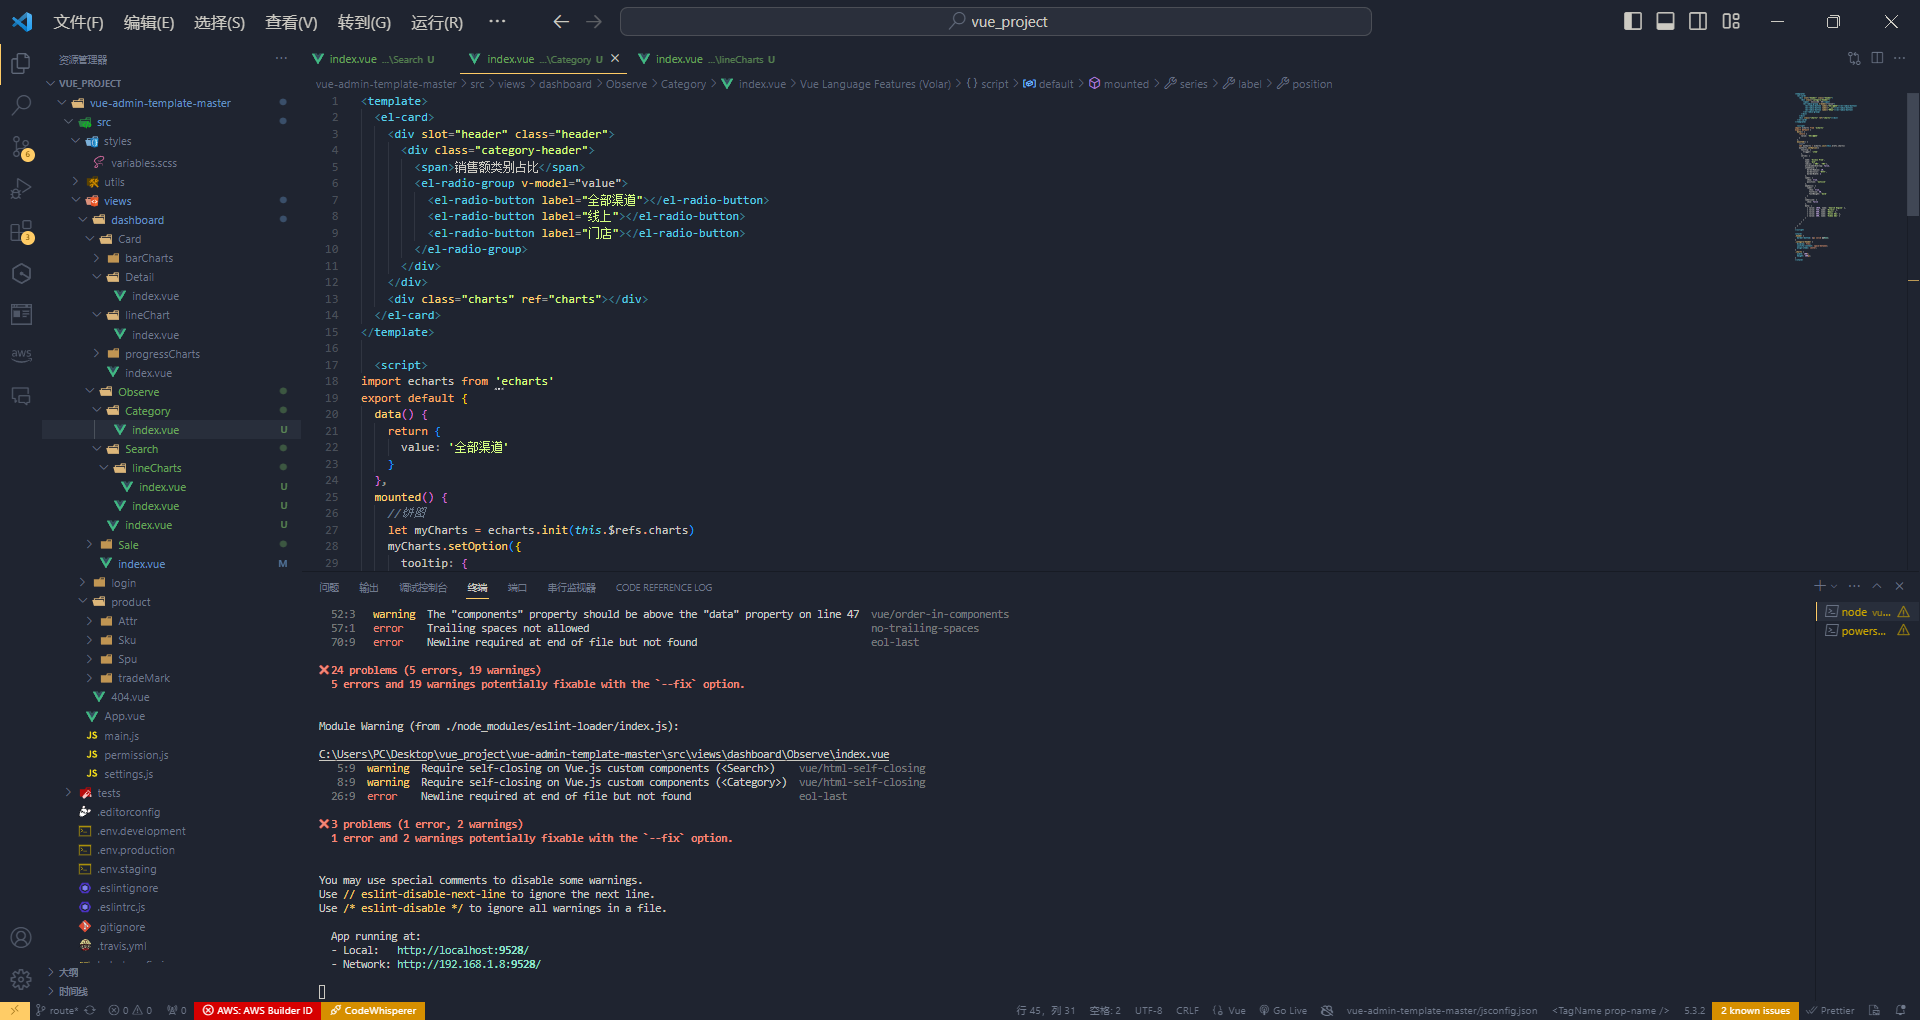
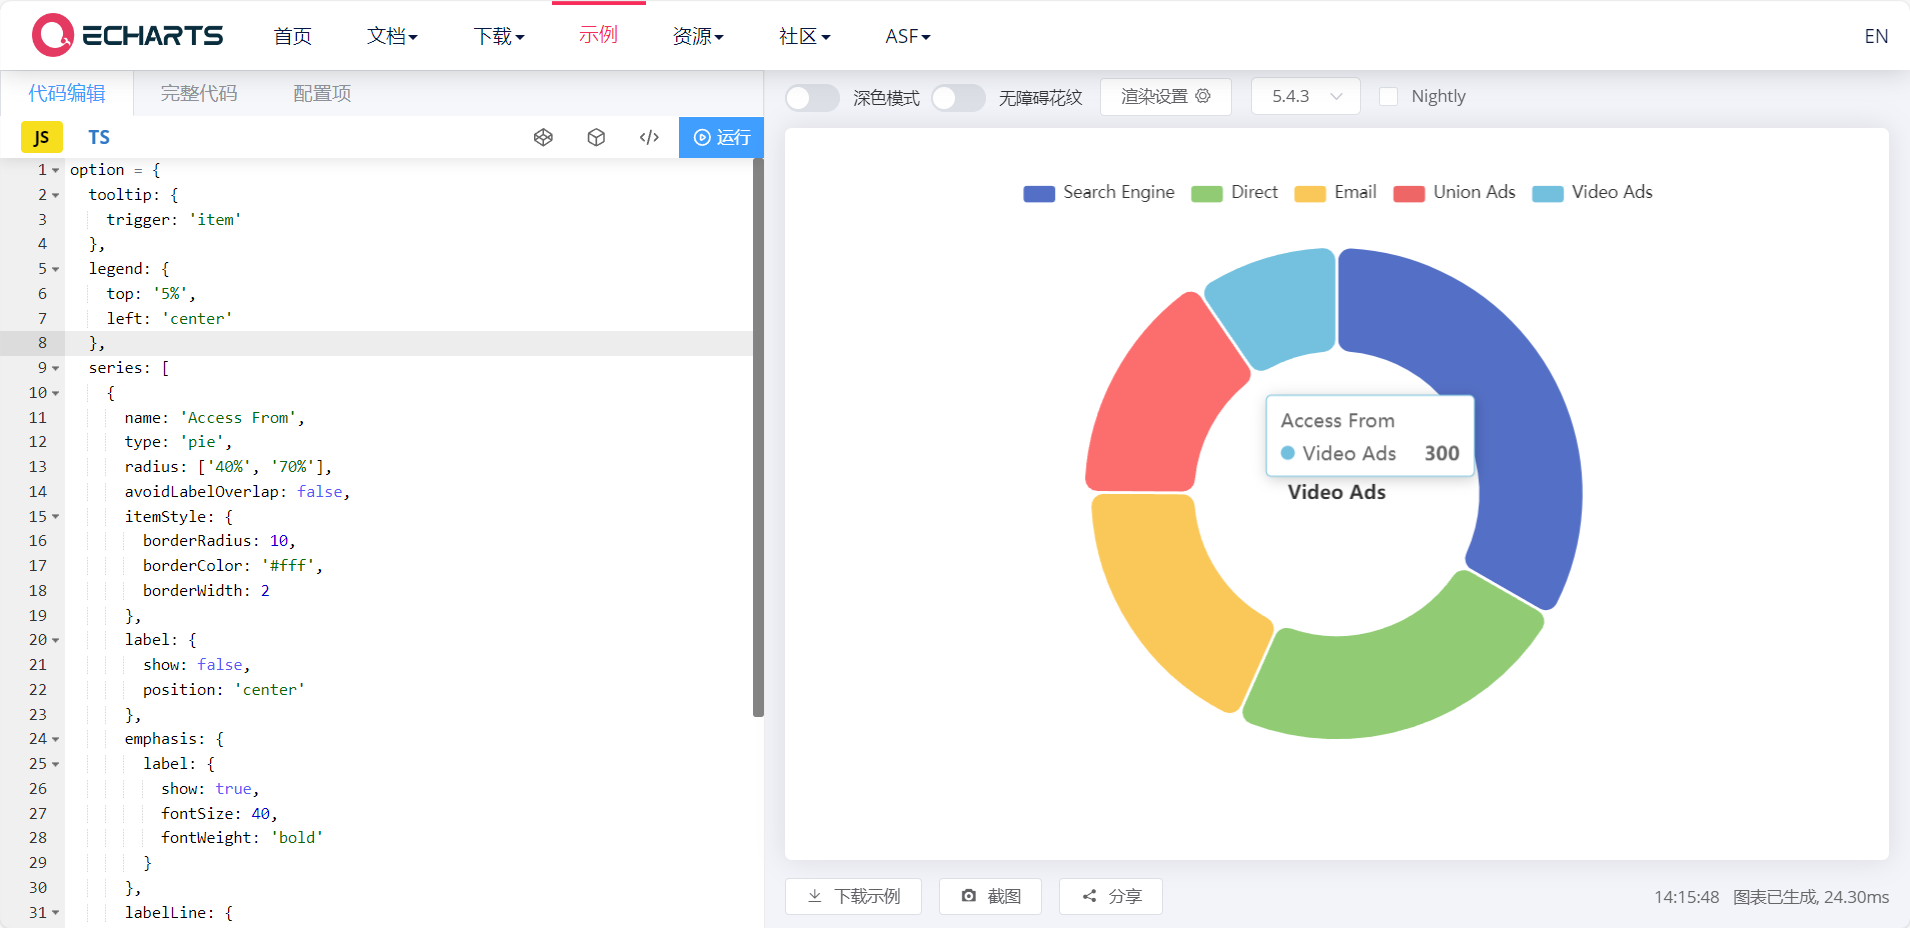
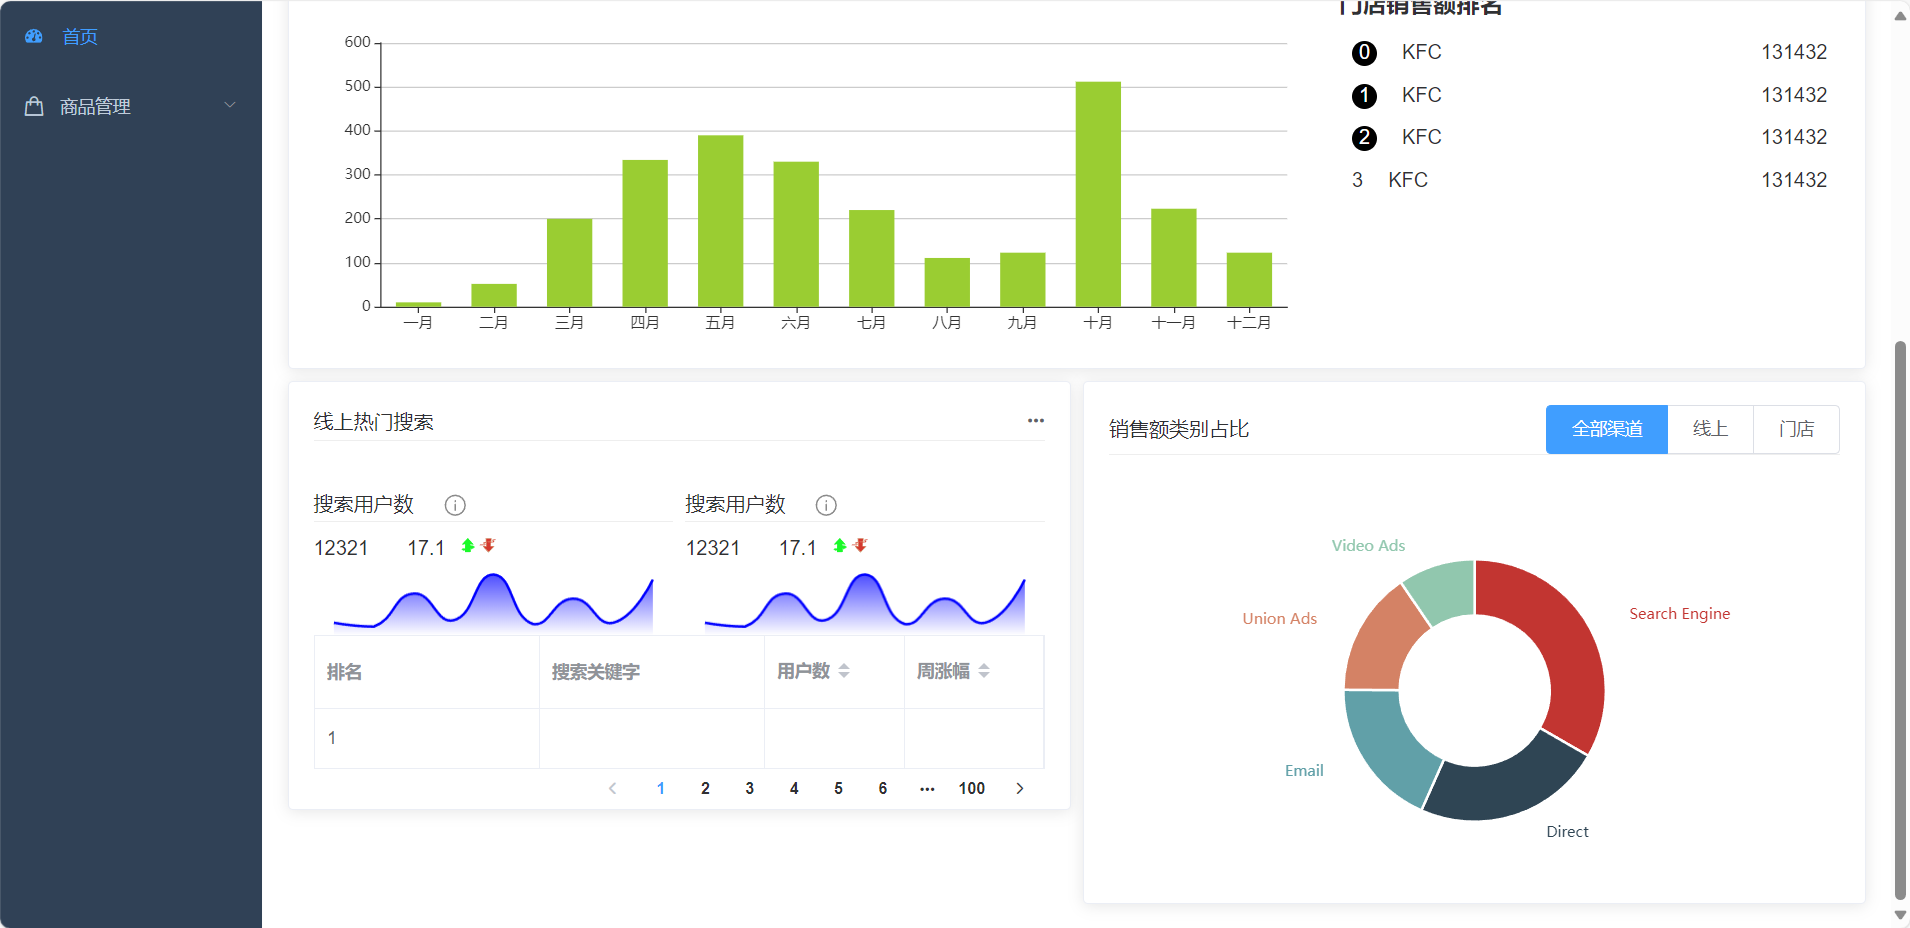 复制echarts里面的案例到代码中,并对饼图的参数进行修改
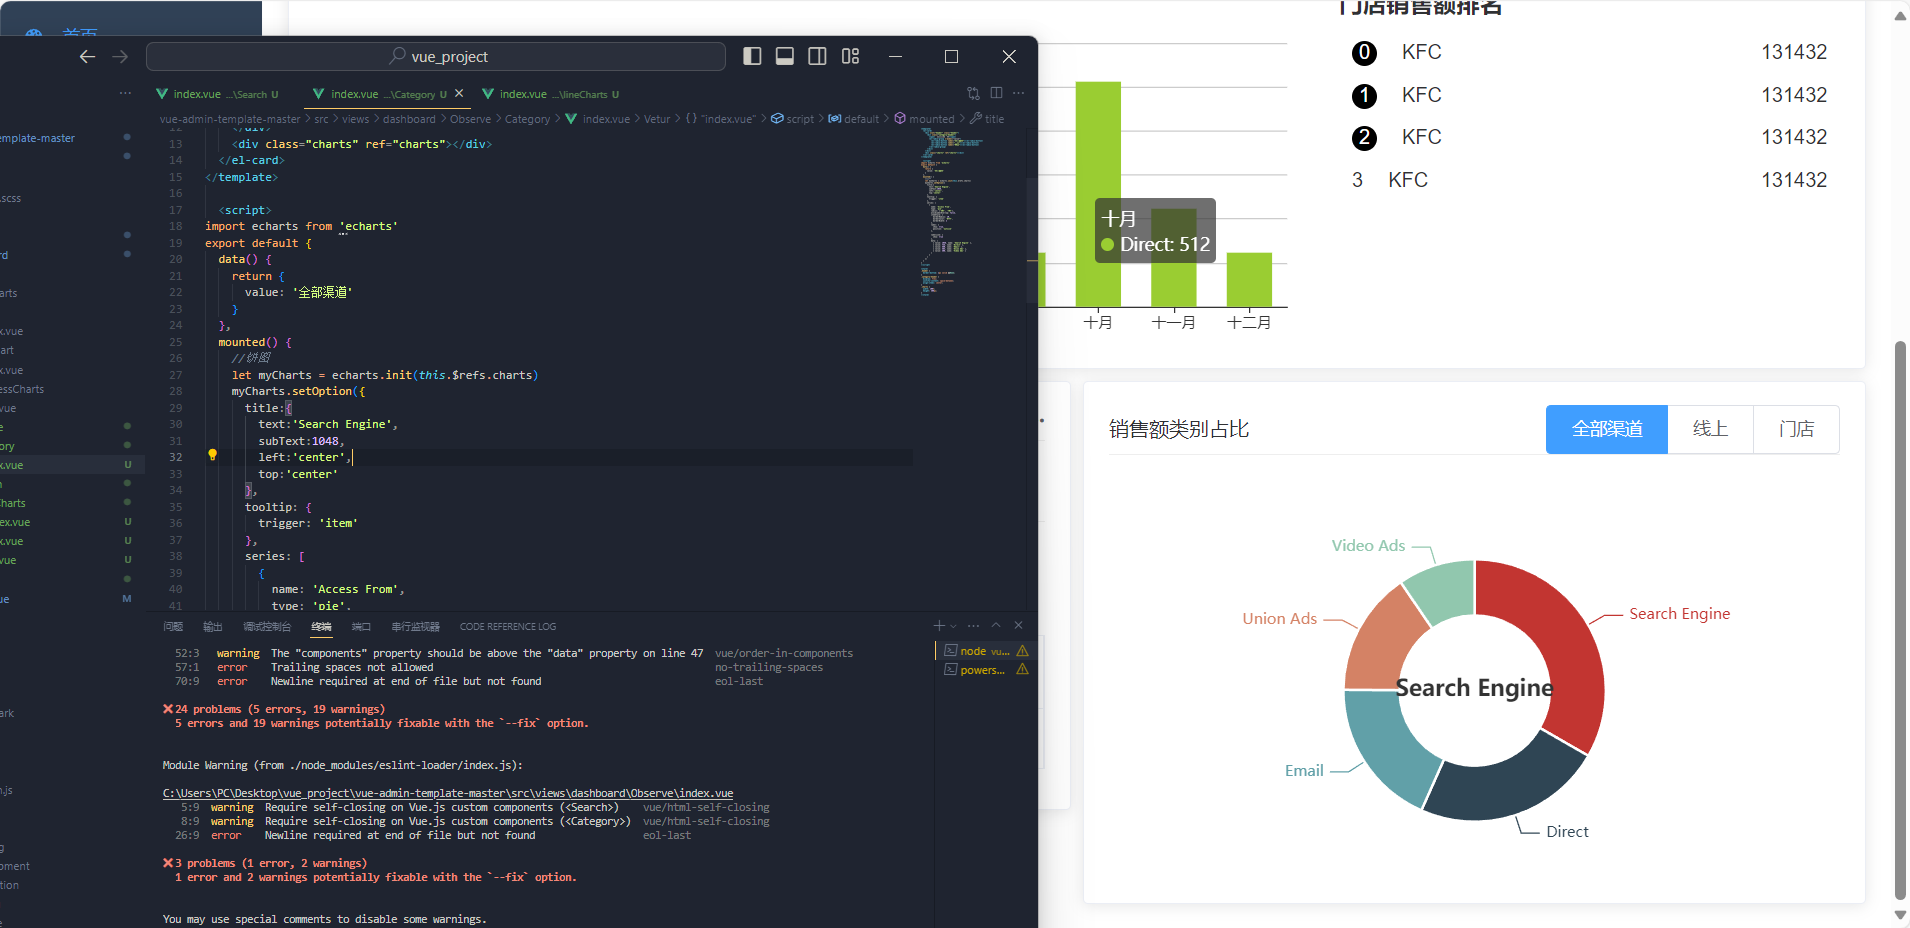
最终展示效果是这样的,我们还需要对鼠标添加事件

<template>
  <el-card>
    <div slot="header" class="header">
      <div class="category-header">
        <span>销售额类别占比</span>
        <el-radio-group v-model="value">
          <el-radio-button label="全部渠道"></el-radio-button>
          <el-radio-button label="线上"></el-radio-button>
          <el-radio-button label="门店"></el-radio-button>
        </el-radio-group>
      </div>
    </div>
    <div class="charts" ref="charts"></div>
  </el-card>
</template>

  <script>
import echarts from 'echarts'
export default {
  data() {
    return {
      value: '全部渠道'
    }
  },
  mounted() {
    //饼图
    let myCharts = echarts.init(this.$refs.charts)
    myCharts.setOption({
      title:{
        text:'Search Engine',
        subText:1048,
        left:'center',
        top:'center'
      },
      tooltip: {
        trigger: 'item'
      },
      series: [
        {
          name: 'Access From',
          type: 'pie',
          radius: ['40%', '70%'],
          avoidLabelOverlap: false,
          itemStyle: {
            borderRadius: 10,
            borderColor: '#fff',
            borderWidth: 2
          },
          label: {
            show: true,
            position: 'outsize'
          },

          labelLine: {
            show: true
          },
          data: [
            { value: 1048, name: 'Search Engine' },
            { value: 735, name: 'Direct' },
            { value: 580, name: 'Email' },
            { value: 484, name: 'Union Ads' },
            { value: 300, name: 'Video Ads' }
          ]
        }
      ]
    })
    myCharts.on('mouseover',(params)=>{
      //  鼠标移上获取数据
      const {name,value}=params.data
      // 重新设置标题
      myCharts.setOption({
        title:{
          text:name,
          subtext:value
        }
      })
    })
  }
}
</script>

<style>
.header {
  border-bottom: 1px solid #eee;
}
.category-header {
  display: flex;
  justify-content: space-between;
  align-items: center;
}
.charts {
  width: 100%;
  height: 300px;
}
</style>
动态展示mock数据
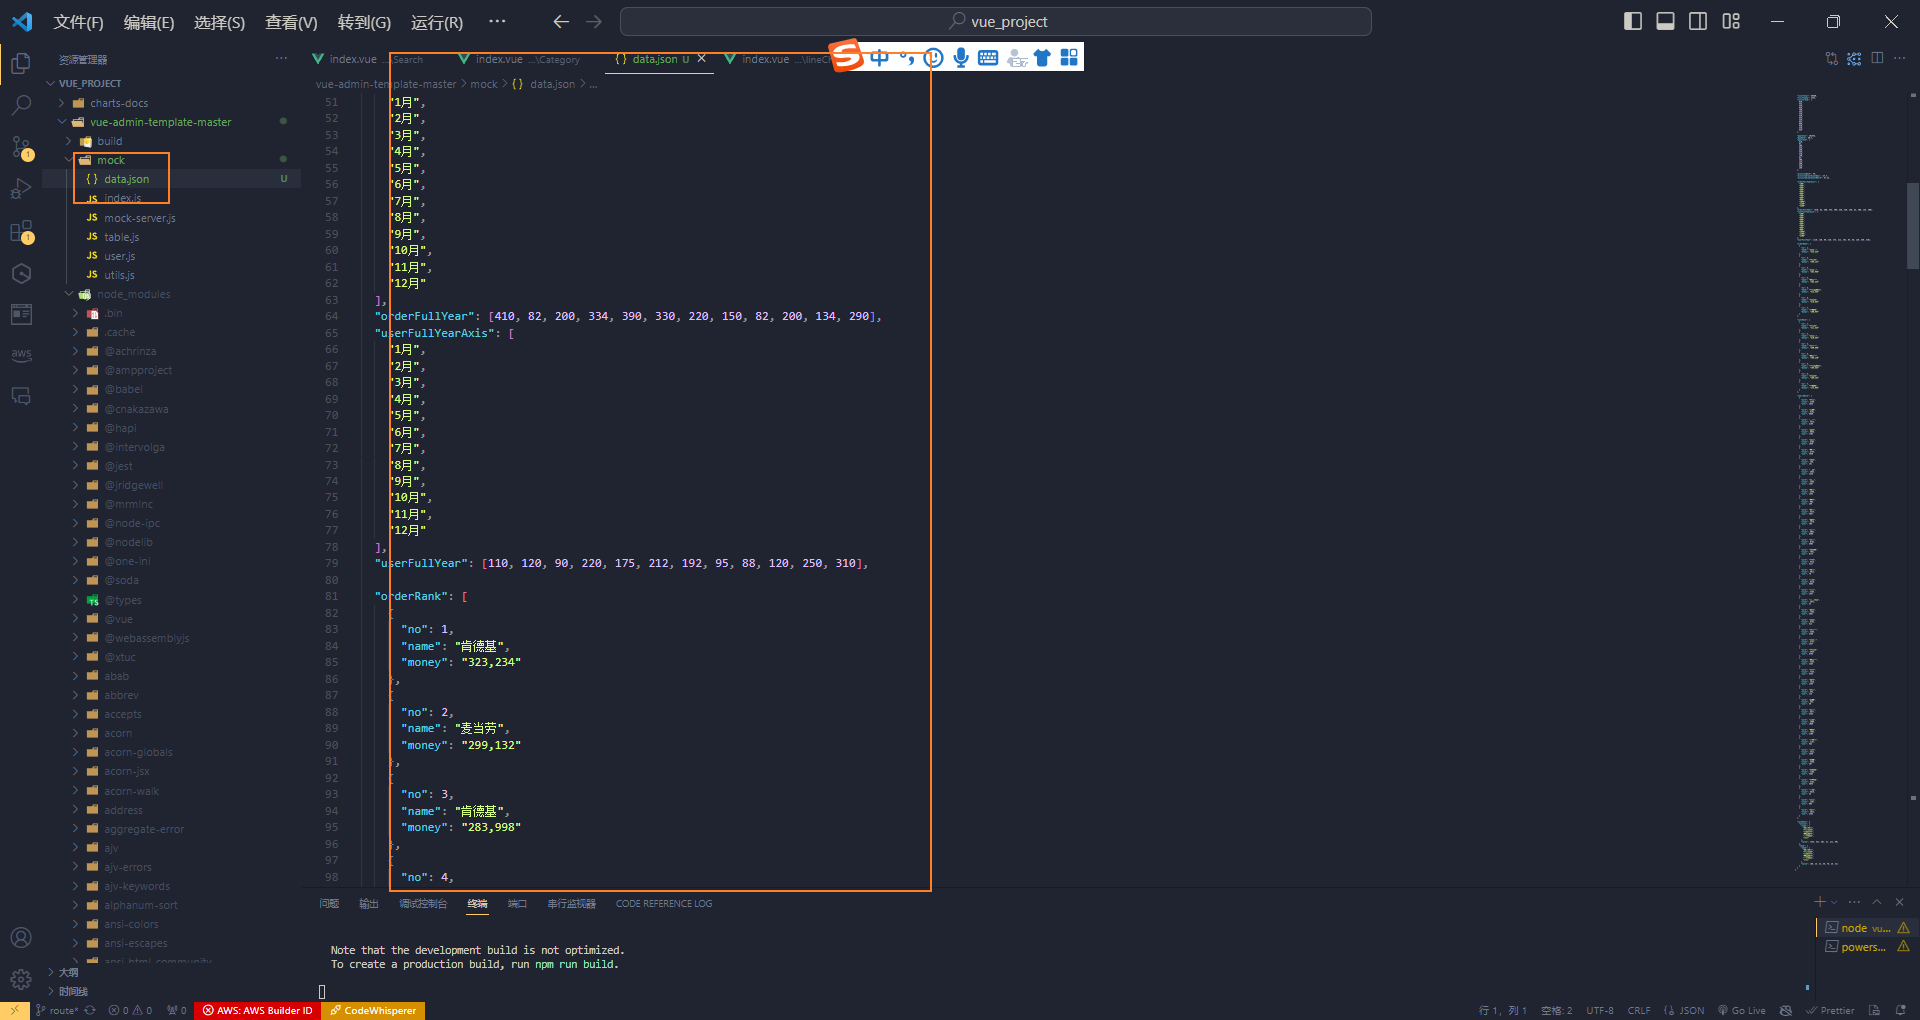
这就是我们需要模拟的数据mock,它是一个json类型
{
  "salesTotal":114779,
  "salesToday":112356,
  "salesGrowthLastDay": -19.16,
  "salesGrowthLastMonth": 56.67,

  "visitTotal": 88460,
  "visitToday": 1234,
  "visitTrend": [
    610,
    432,
    220,
    534,
    790,
    430,
    220,
    320,
    532,
    320,
    834,
    690,
    530,
    220,
    620
  ],

  "payTotal": 182425,
  "payRate": 60.2,
  "payTrend": [
    410,
    82,
    200,
    334,
    390,
    330,
    220,
    150,
    82,
    200,
    134,
    290,
    330,
    150
  ],

  "activityRate": 78,
  "activityGrowthLastDay": -17.7,
  "activityGrowthLastMonth": 47.12,

  "orderFullYearAxis": [
    "1月",
    "2月",
    "3月",
    "4月",
    "5月",
    "6月",
    "7月",
    "8月",
    "9月",
    "10月",
    "11月",
    "12月"
  ],
  "orderFullYear": [410, 82, 200, 334, 390, 330, 220, 150, 82, 200, 134, 290],
  "userFullYearAxis": [
    "1月",
    "2月",
    "3月",
    "4月",
    "5月",
    "6月",
    "7月",
    "8月",
    "9月",
    "10月",
    "11月",
    "12月"
  ],
  "userFullYear": [110, 120, 90, 220, 175, 212, 192, 95, 88, 120, 250, 310],

  "orderRank": [
    {
      "no": 1,
      "name": "肯德基",
      "money": "323,234"
    },
    {
      "no": 2,
      "name": "麦当劳",
      "money": "299,132"
    },
    {
      "no": 3,
      "name": "肯德基",
      "money": "283,998"
    },
    {
      "no": 4,
      "name": "海底捞",
      "money": "266,223"
    },
    {
      "no": 5,
      "name": "西贝筱面村",
      "money": "223,445"
    },
    {
      "no": 6,
      "name": "汉堡王",
      "money": "219,663"
    },
    {
      "no": 7,
      "name": "真功夫",
      "money": "200,997"
    }
  ],

  "userRank": [
    {
      "no": 1,
      "name": "麦当劳",
      "money": "211,335"
    },
    {
      "no": 2,
      "name": "肯德基",
      "money": "210,597"
    },
    {
      "no": 3,
      "name": "必胜客",
      "money": "200,998"
    },
    {
      "no": 4,
      "name": "海底捞",
      "money": "199,220"
    },
    {
      "no": 5,
      "name": "西贝筱面村",
      "money": "195,444"
    },
    {
      "no": 6,
      "name": "汉堡王",
      "money": "180,161"
    },
    {
      "no": 7,
      "name": "真功夫",
      "money": "172,995"
    }
  ],

  "searchWord": [
    {
      "word": "北京",
      "count": 3440,
      "user": 1626
    },
    {
      "word": "上海",
      "count": 8101,
      "user": 6660
    },
    {
      "word": "广州",
      "count": 7814,
      "user": 2196
    },
    {
      "word": "深圳",
      "count": 8888,
      "user": 7102
    },
    {
      "word": "南京",
      "count": 6204,
      "user": 1949
    },
    {
      "word": "杭州",
      "count": 8159,
      "user": 3548
    },
    {
      "word": "合肥",
      "count": 269,
      "user": 151
    },
    {
      "word": "济南",
      "count": 2045,
      "user": 1320
    },
    {
      "word": "太原",
      "count": 5693,
      "user": 2297
    },
    {
      "word": "成都",
      "count": 4850,
      "user": 1635
    },
    {
      "word": "重庆",
      "count": 906,
      "user": 269
    },
    {
      "word": "苏州",
      "count": 5576,
      "user": 3937
    },
    {
      "word": "无锡",
      "count": 1576,
      "user": 796
    },
    {
      "word": "常州",
      "count": 9002,
      "user": 8508
    },
    {
      "word": "温州",
      "count": 8103,
      "user": 4903
    },
    {
      "word": "哈尔滨",
      "count": 7961,
      "user": 6173
    },
    {
      "word": "长春",
      "count": 5916,
      "user": 3117
    },
    {
      "word": "大连",
      "count": 5012,
      "user": 78
    },
    {
      "word": "沈阳",
      "count": 8410,
      "user": 5696
    },
    {
      "word": "拉萨",
      "count": 3385,
      "user": 2547
    },
    {
      "word": "呼和浩特",
      "count": 4672,
      "user": 34
    },
    {
      "word": "武汉",
      "count": 7386,
      "user": 4047
    },
    {
      "word": "南宁",
      "count": 6192,
      "user": 612
    },
    {
      "word": "必胜客",
      "count": 3504,
      "user": 2480
    },
    {
      "word": "肯德基",
      "count": 3727,
      "user": 2527
    },
    {
      "word": "麦当劳",
      "count": 8959,
      "user": 6198
    },
    {
      "word": "海底捞",
      "count": 5295,
      "user": 2264
    },
    {
      "word": "美食",
      "count": 7348,
      "user": 5555
    },
    {
      "word": "商超",
      "count": 1628,
      "user": 1295
    },
    {
      "word": "水果",
      "count": 892,
      "user": 215
    },
    {
      "word": "跑腿",
      "count": 254,
      "user": 40
    },
    {
      "word": "送药",
      "count": 8377,
      "user": 4363
    },
    {
      "word": "烩饭",
      "count": 2009,
      "user": 1080
    },
    {
      "word": "面条",
      "count": 7684,
      "user": 4299
    },
    {
      "word": "小龙虾",
      "count": 3187,
      "user": 562
    },
    {
      "word": "牛肉",
      "count": 3612,
      "user": 3449
    },
    {
      "word": "鸡腿",
      "count": 4460,
      "user": 367
    },
    {
      "word": "全家桶",
      "count": 7206,
      "user": 3682
    },
    {
      "word": "麦乐鸡",
      "count": 3383,
      "user": 3048
    },
    {
      "word": "炭烤",
      "count": 8818,
      "user": 26
    },
    {
      "word": "麻辣",
      "count": 1297,
      "user": 905
    },
    {
      "word": "冒菜",
      "count": 3015,
      "user": 2362
    }
  ],

  "saleRank": {
    "online": {
      "name": [
        "家用电器",
        "食用酒水",
        "个护健康",
        "服饰箱包",
        "母婴产品",
        "其他"
      ],
      "value": [244, 321, 301, 41, 111, 69]
    },
    "shop": {
      "name": [
        "家用电器",
        "食用酒水",
        "个护健康",
        "服饰箱包",
        "母婴产品",
        "其他"
      ],
      "value": [68, 15, 41, 56, 70, 25, 31]
    }
  }
}
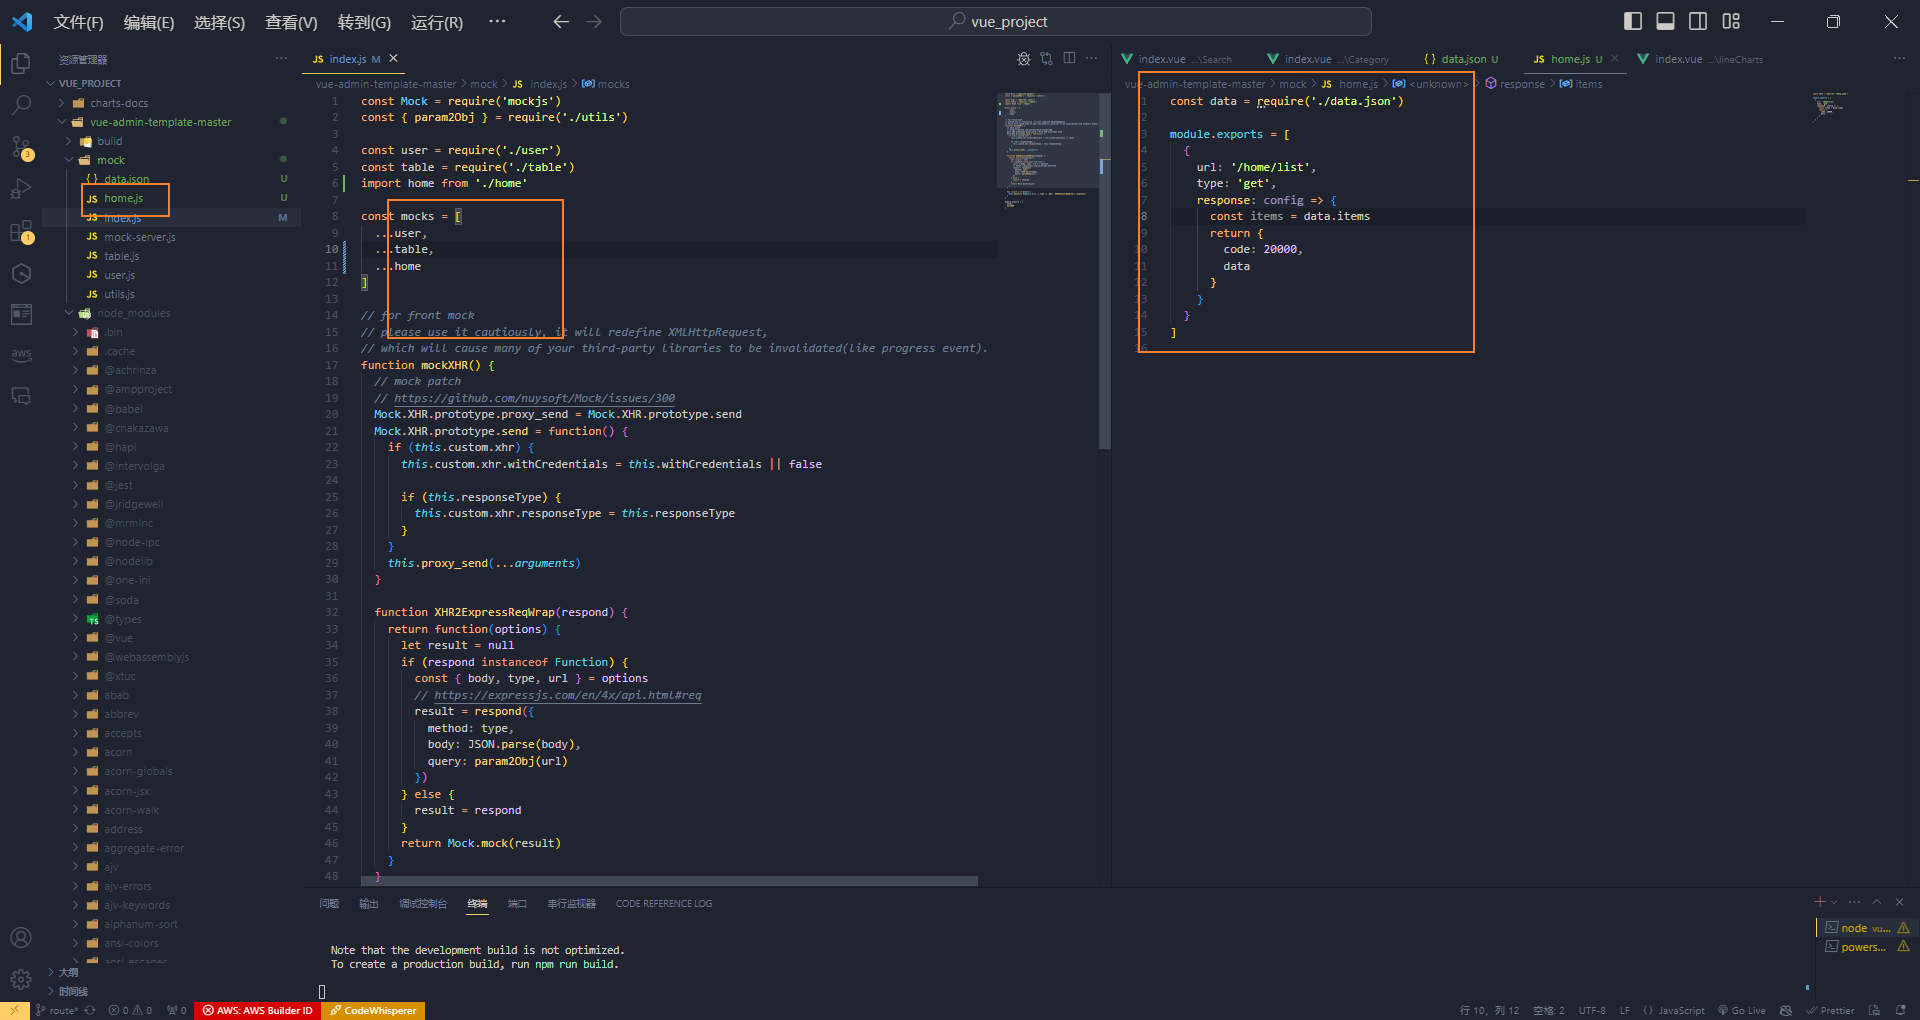
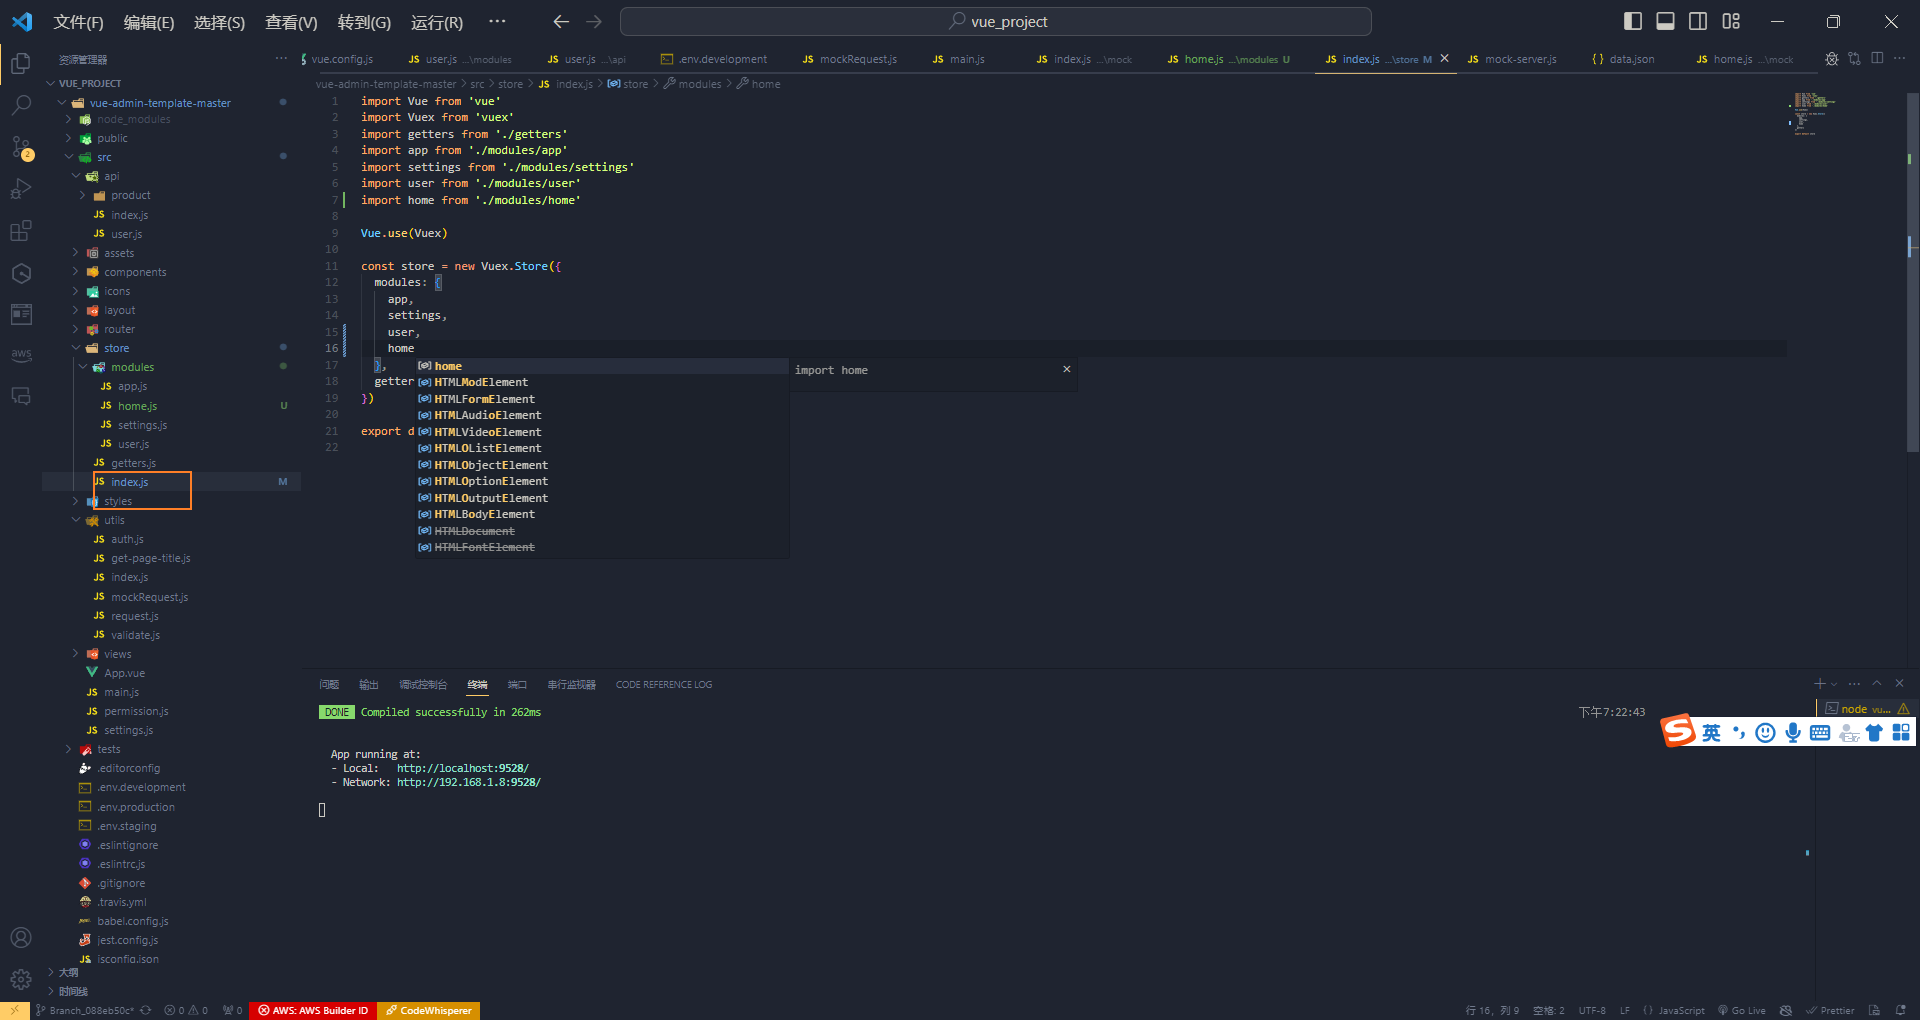
新建一个home.js用来存放假数据data.json 然后在主文件中对外暴露出去
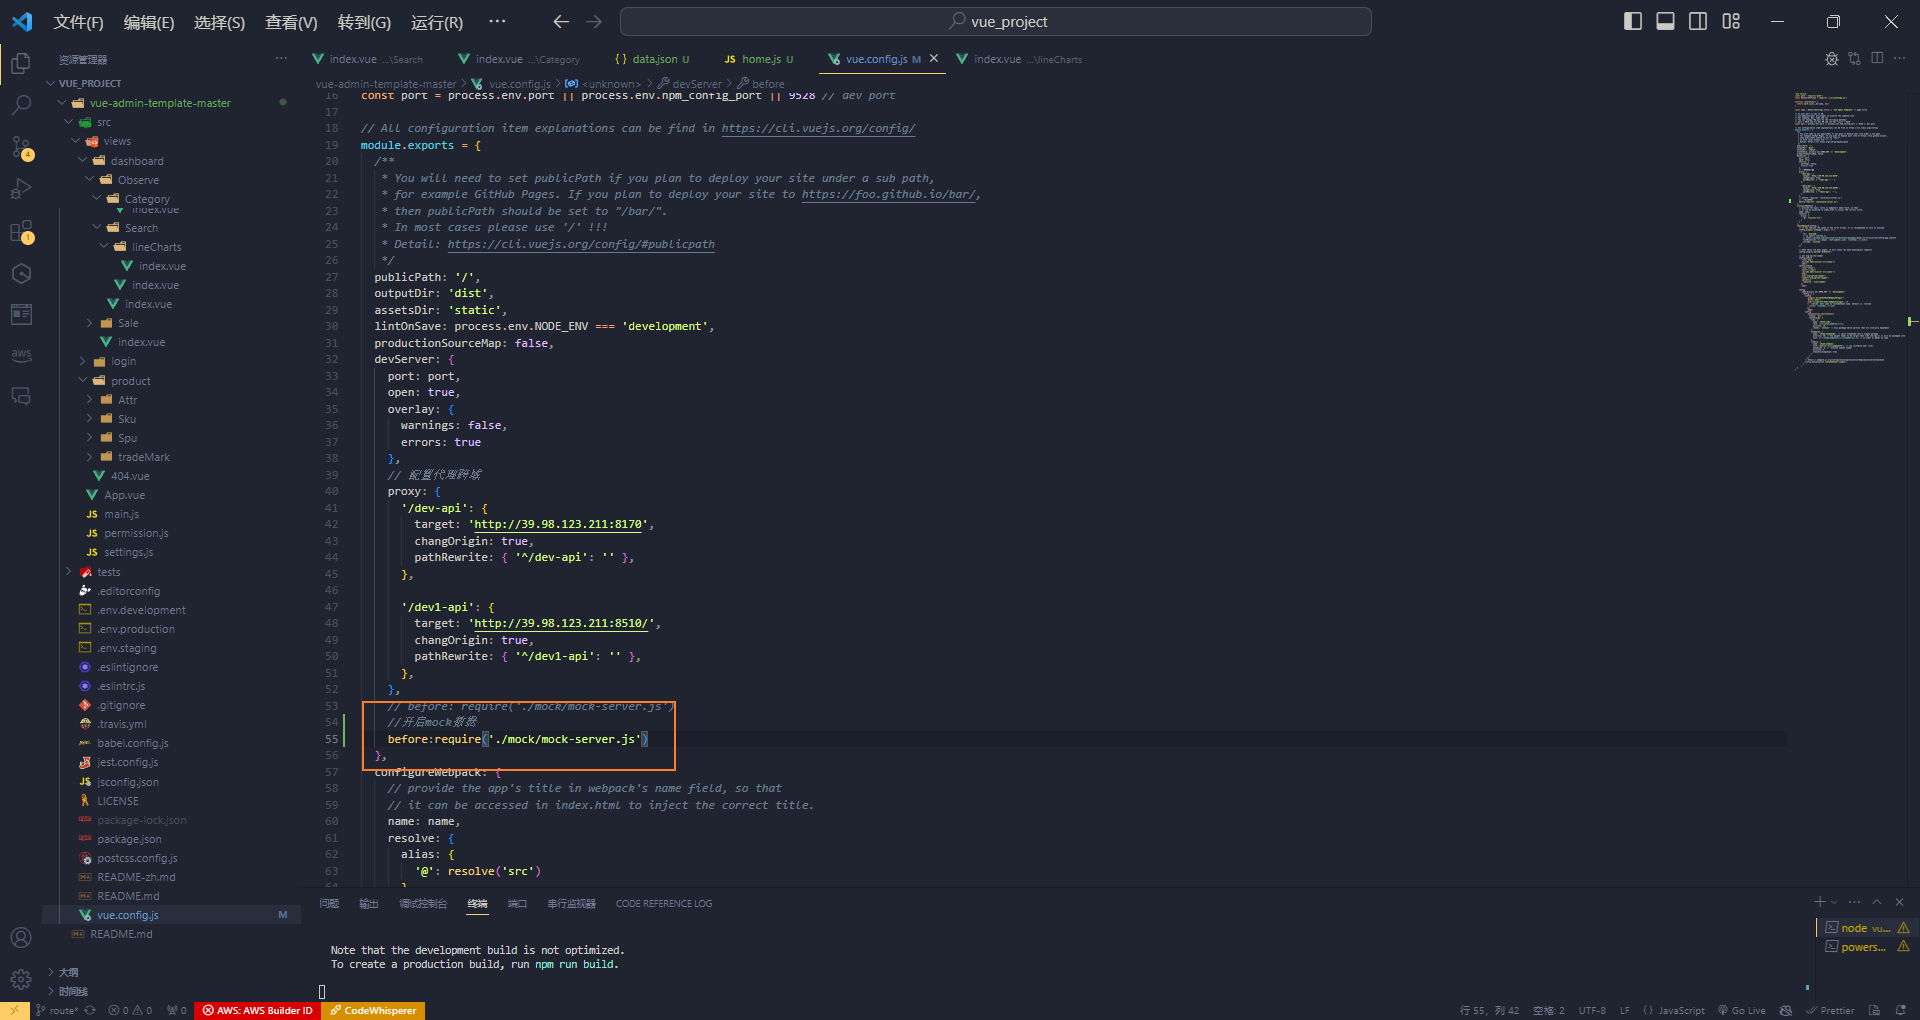
然后到vue.config中进行配置的设置
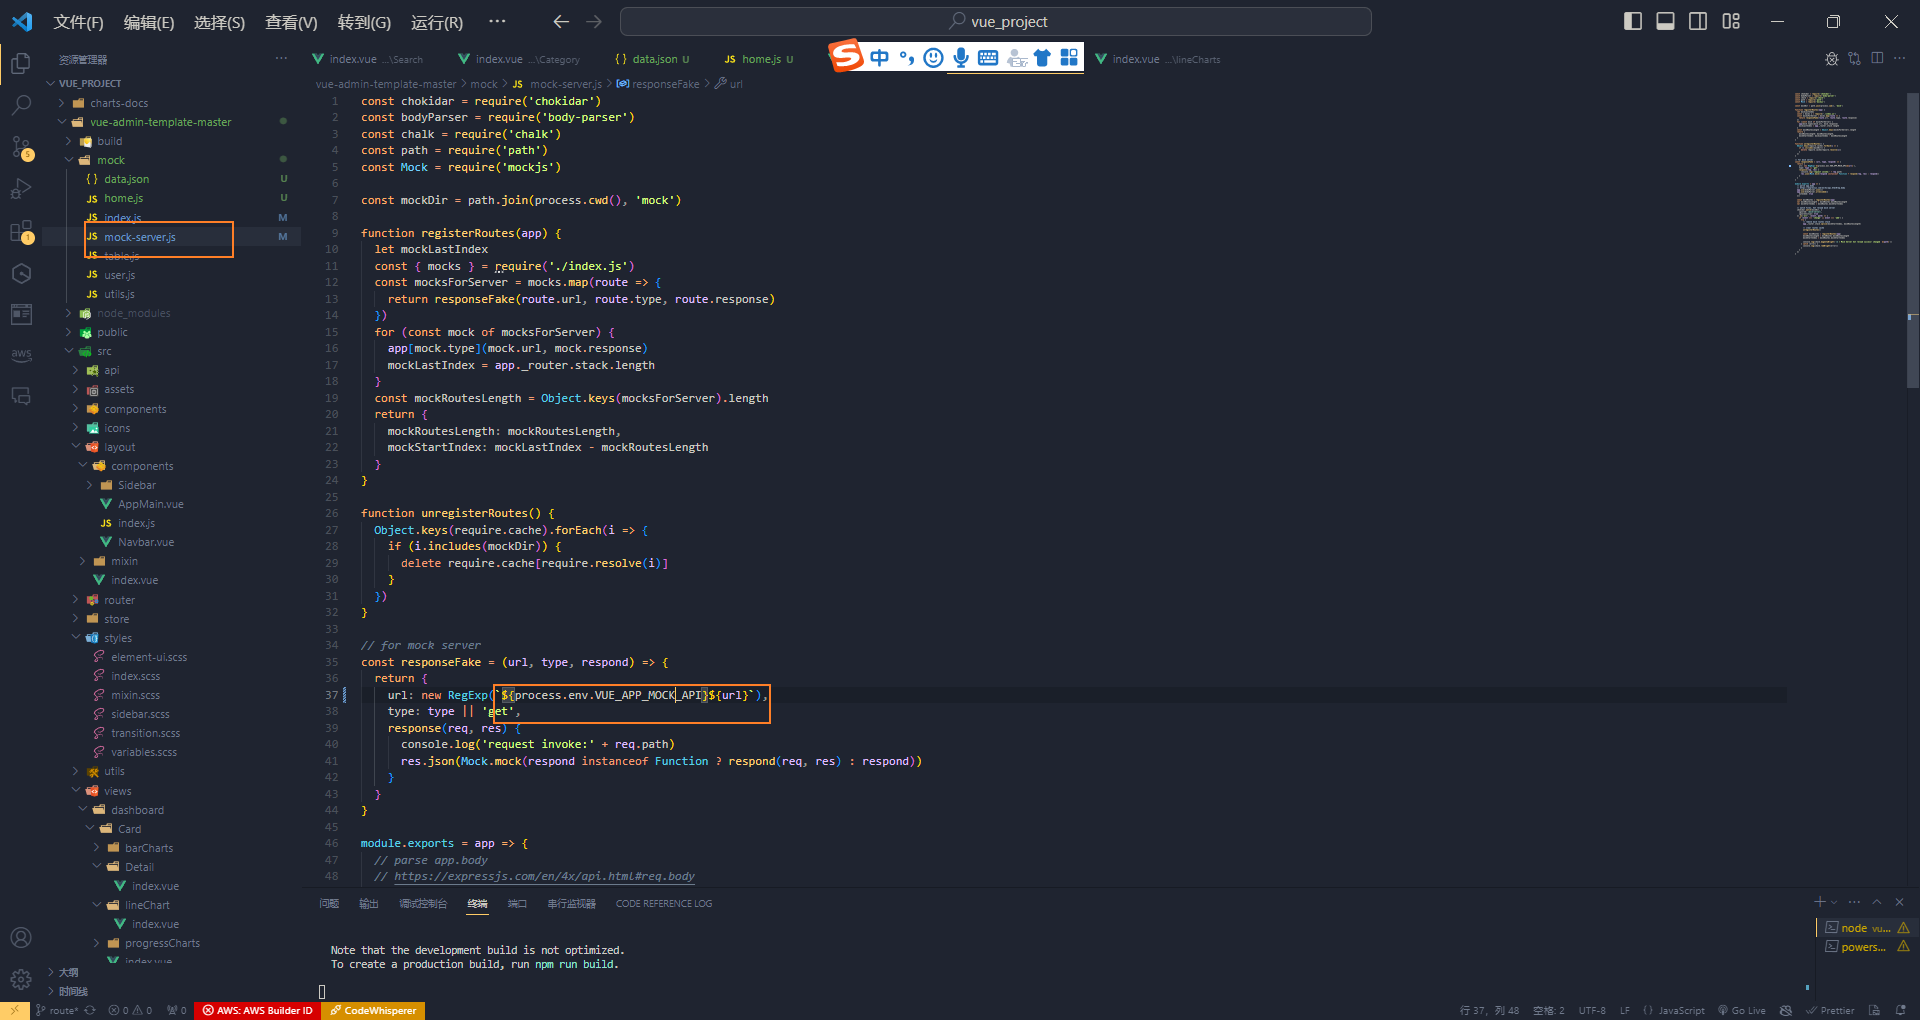
因为我需要拿到的mock假数据,防止与真实服务器的数据冲突,注意这个变量是没有的,因此我们还需要重新设置
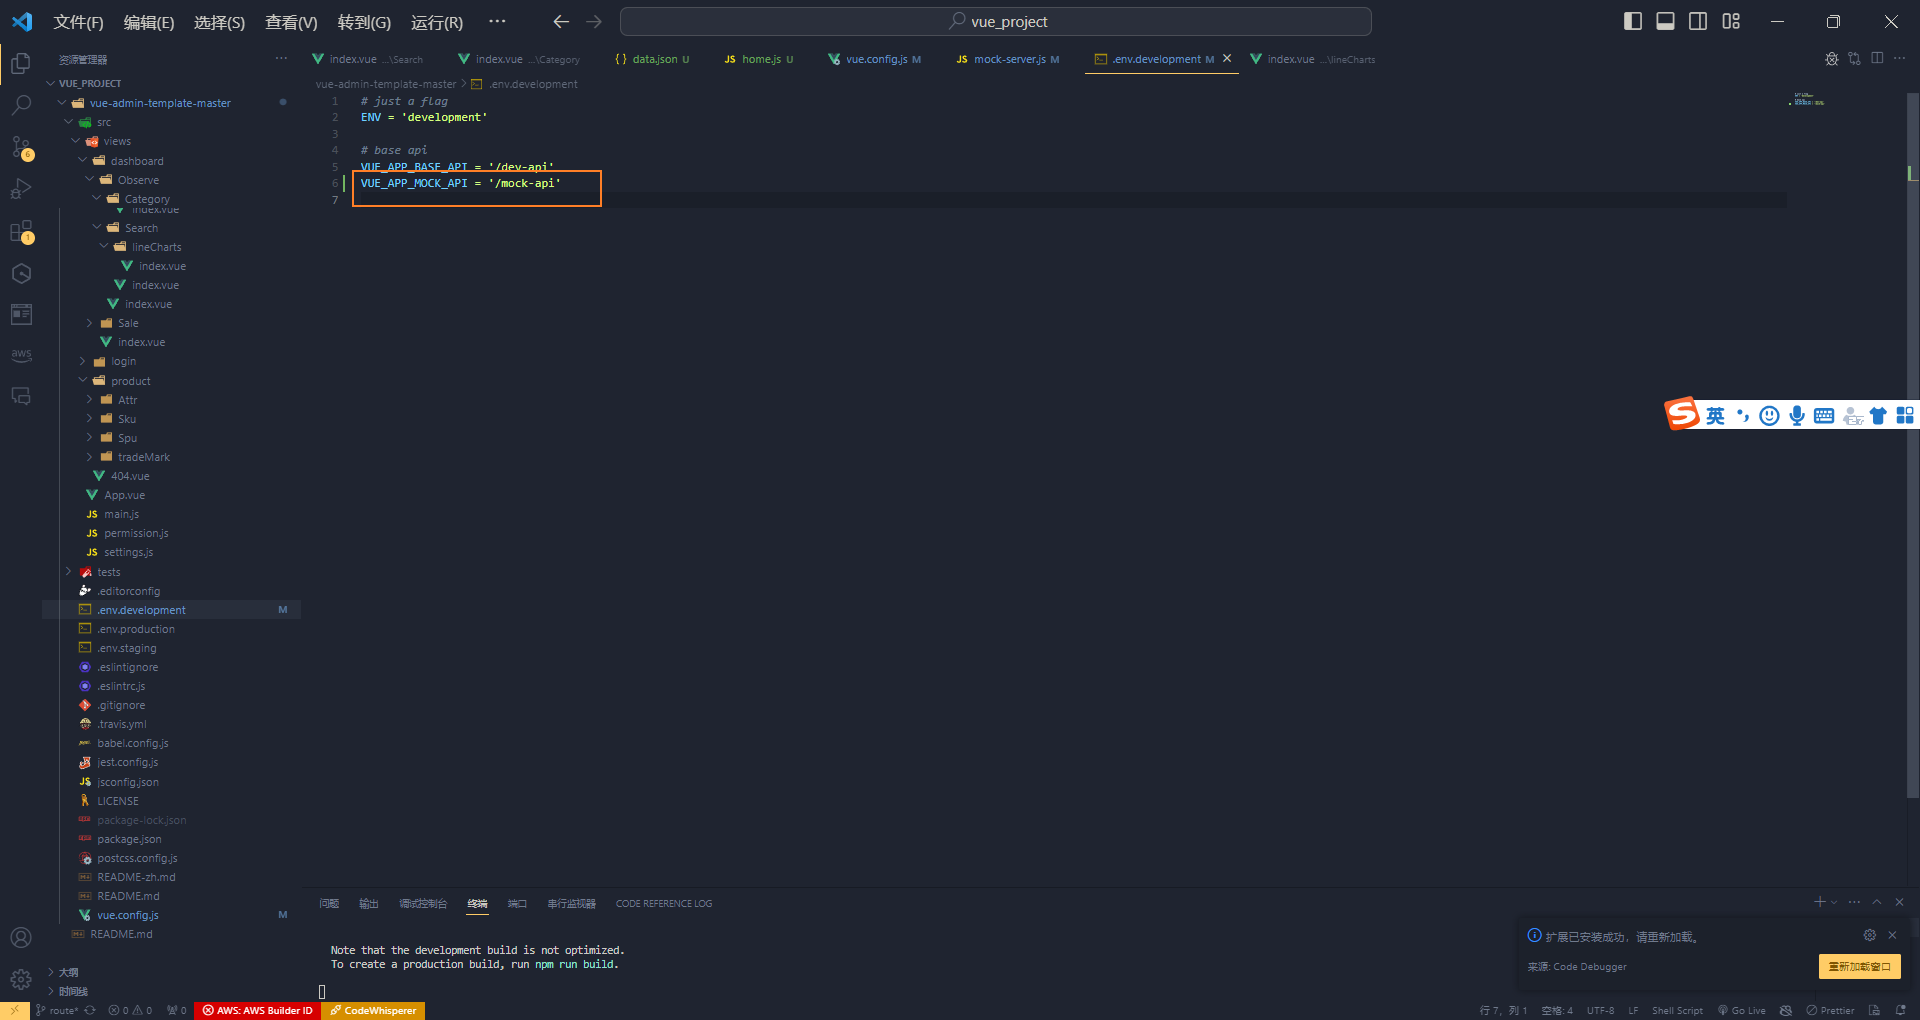
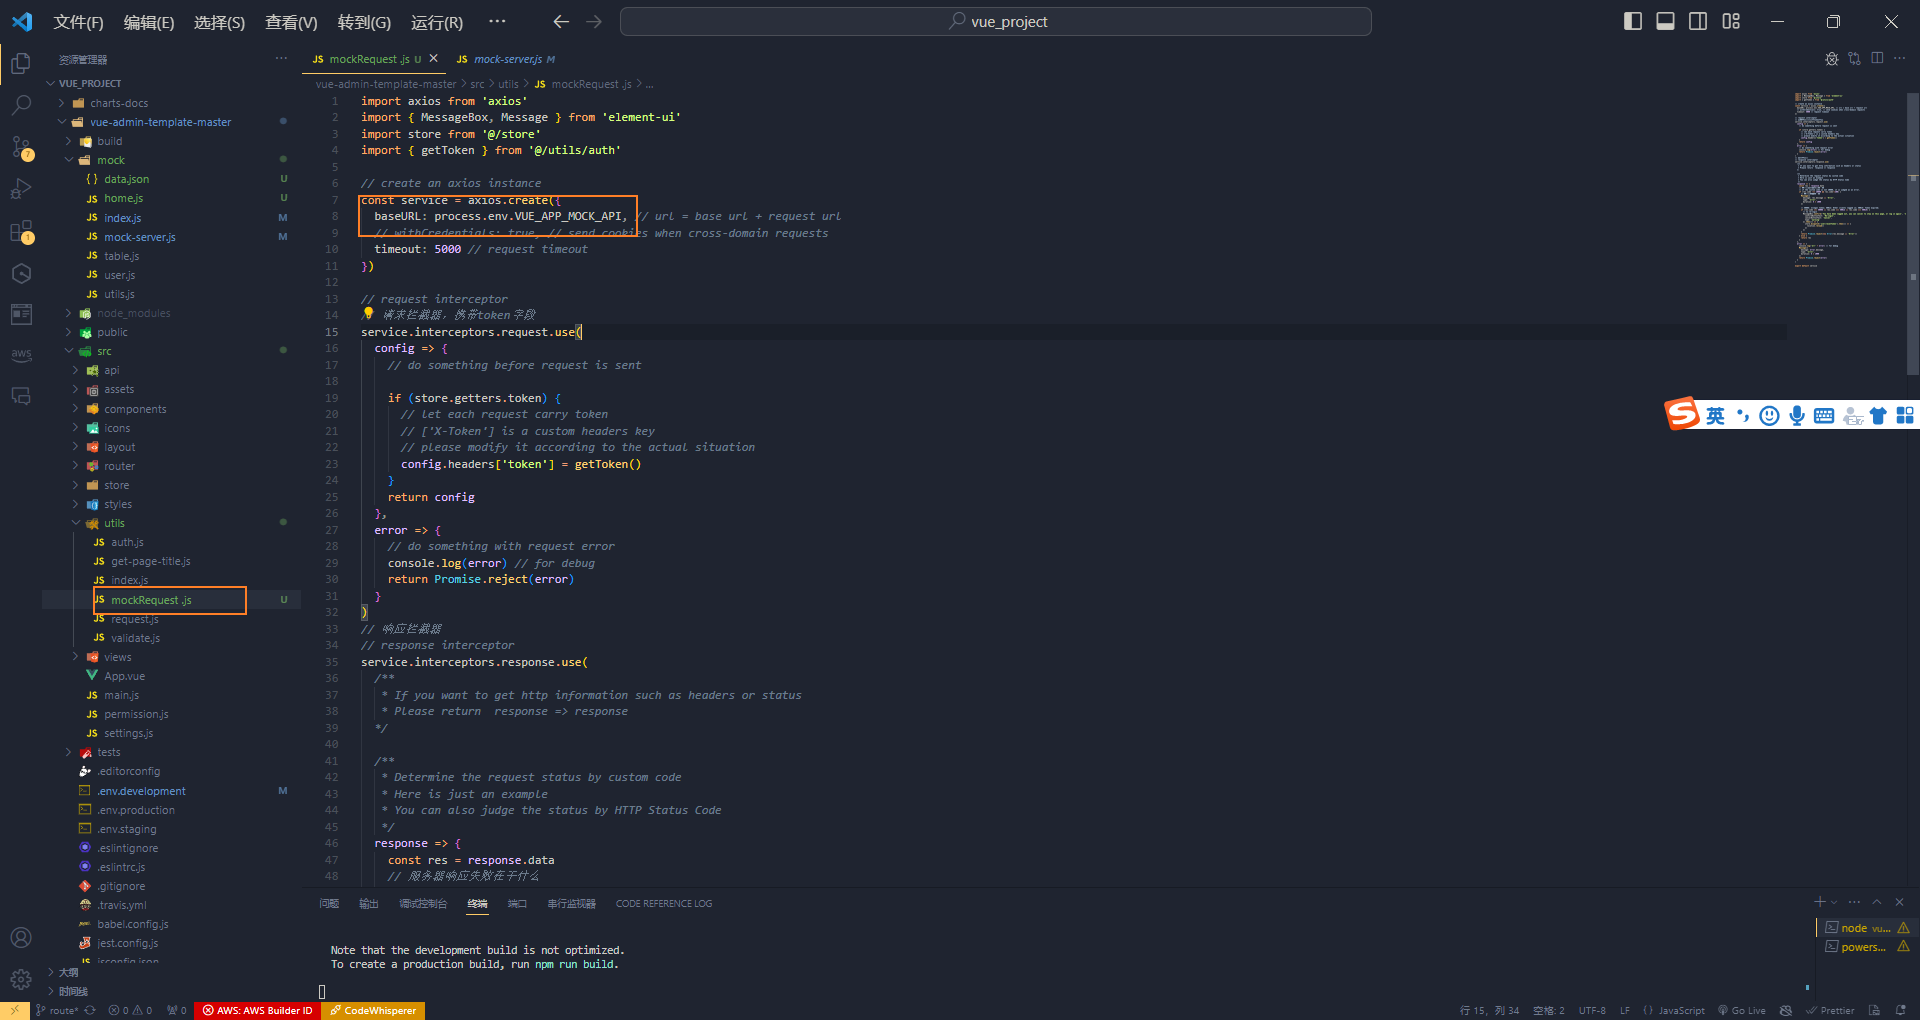
复制原先请求文件,修改url为mock即可
然后登陆的时候发现请求超时,timeout5000
解决方案如下:
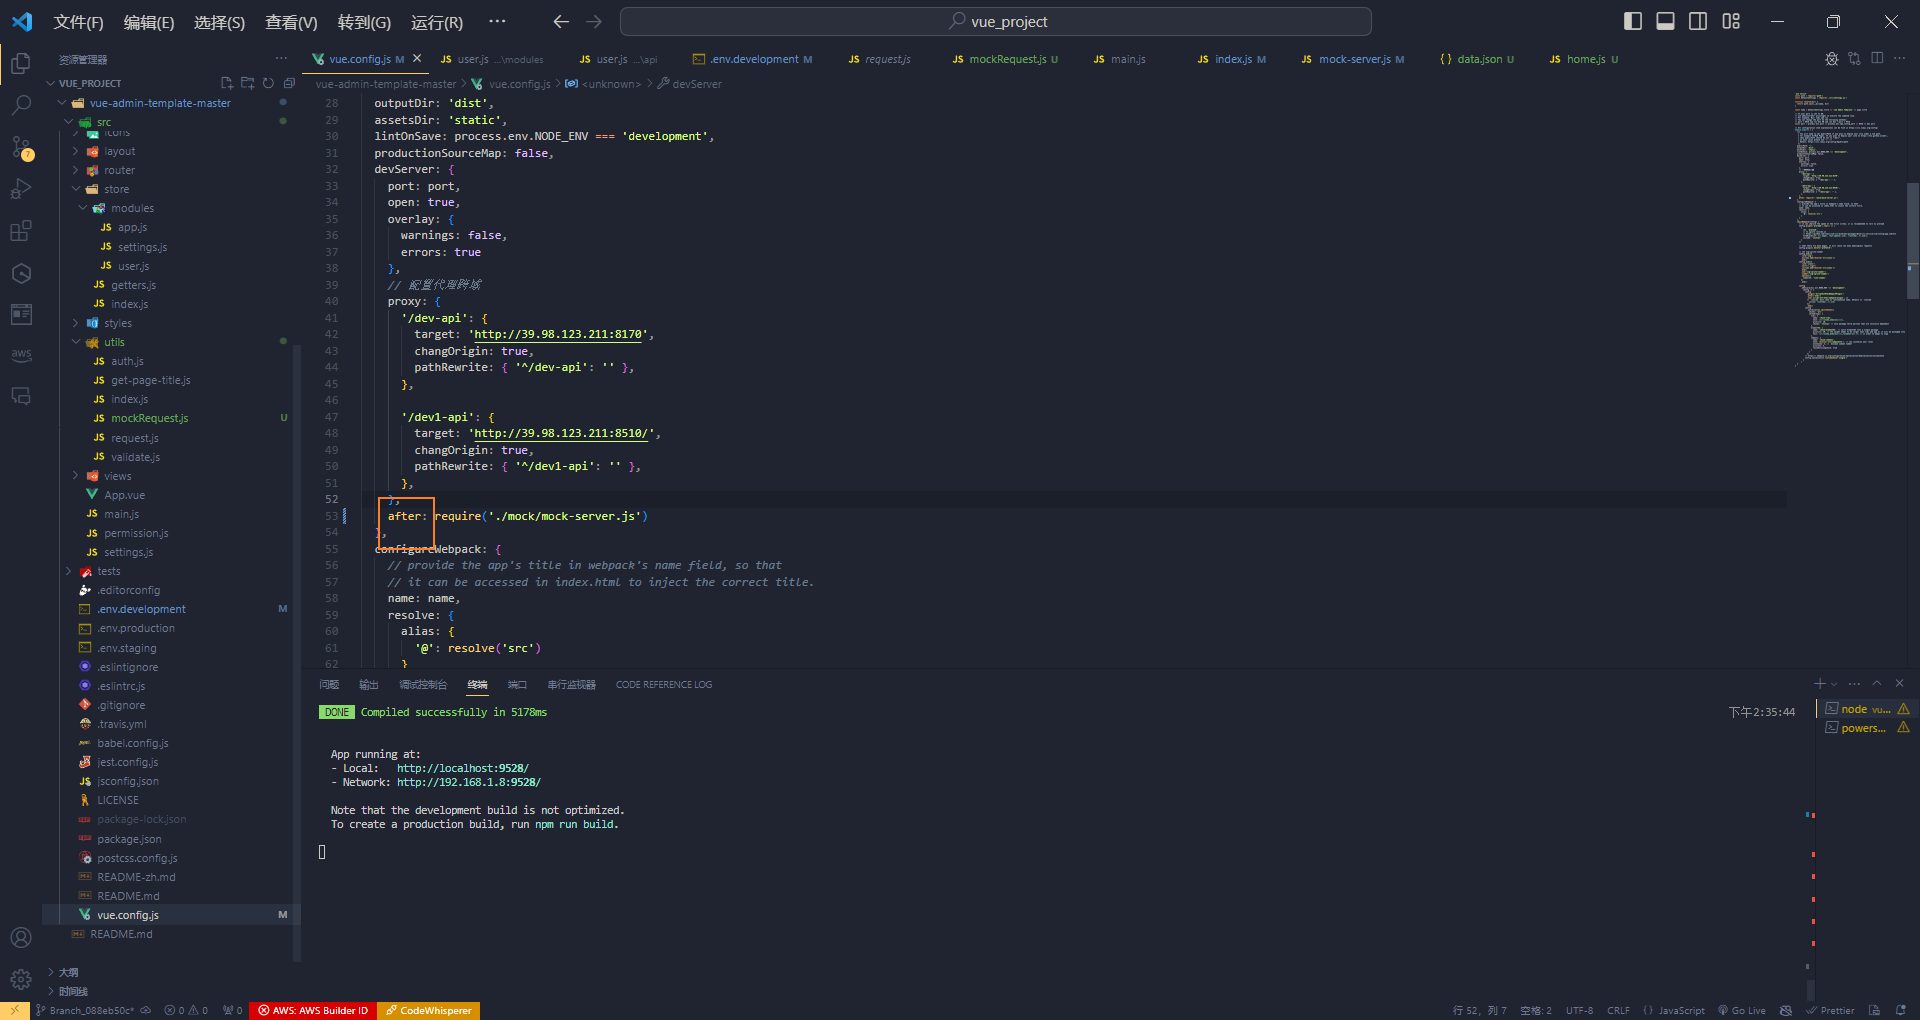
回到vue.config中将before修改为after
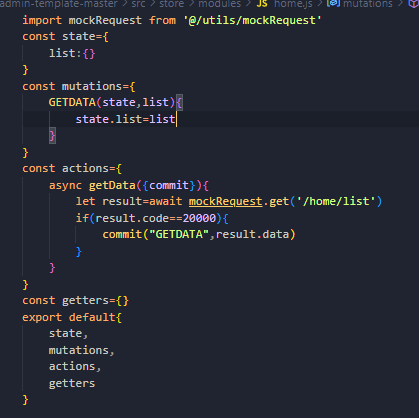
然后向服务器发请求获取数据展示数据。我们可以在vuex中拿数据
三连环 这里我们之前在mockRequest.js中发起网络请求,这里我们就可以直接拿来用
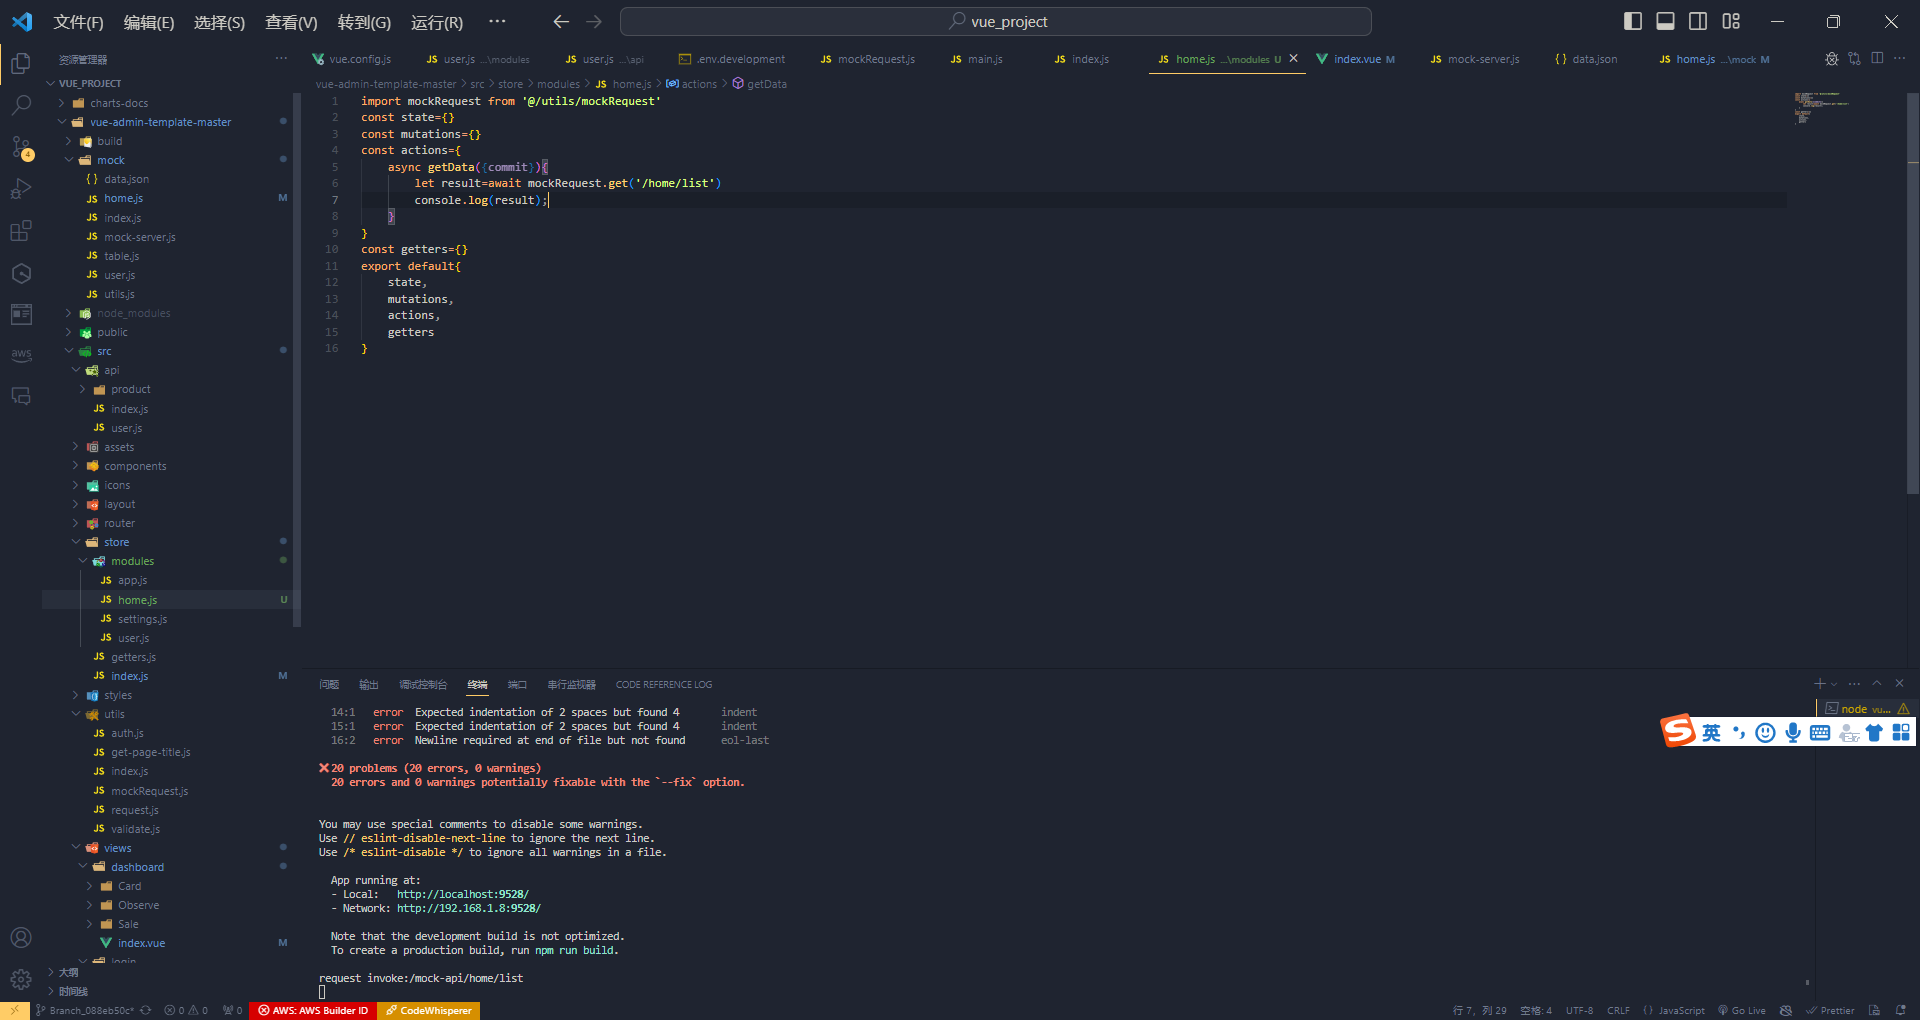
还要去引用它
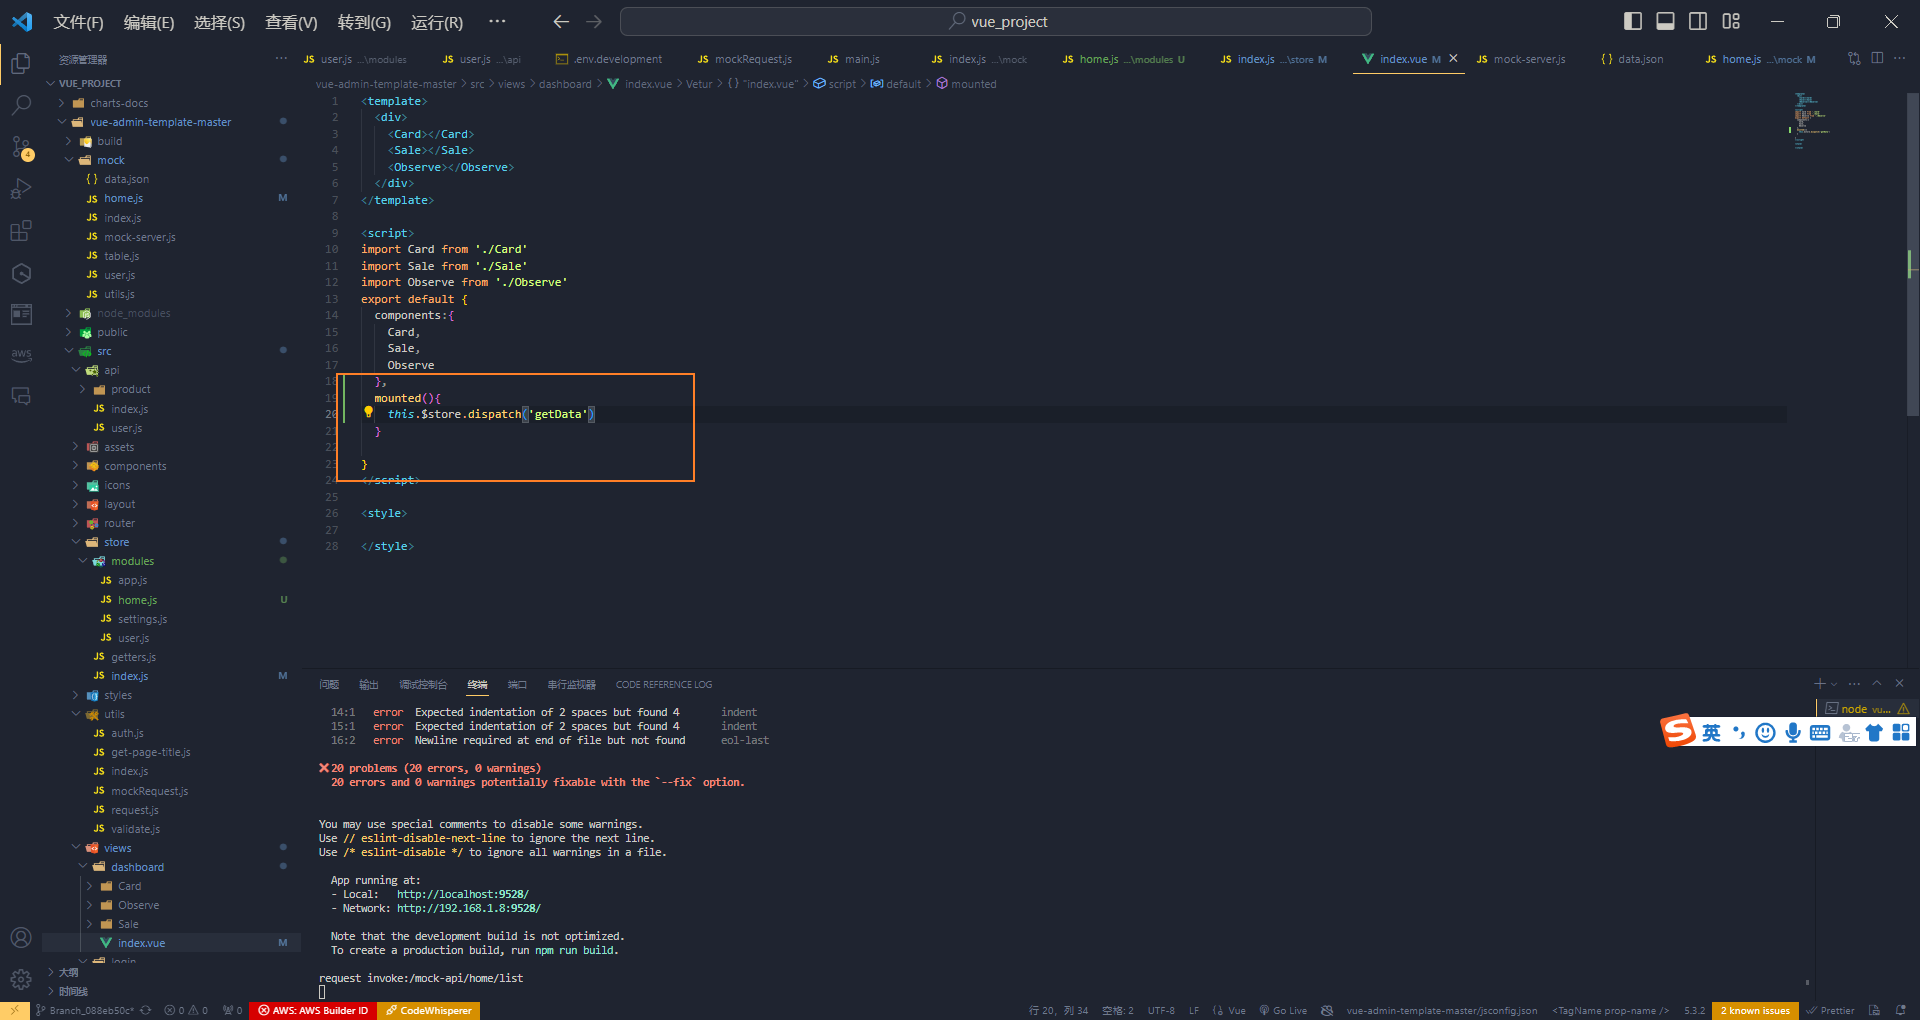
当页面载入时,先去引用一下,看打印出来的数据
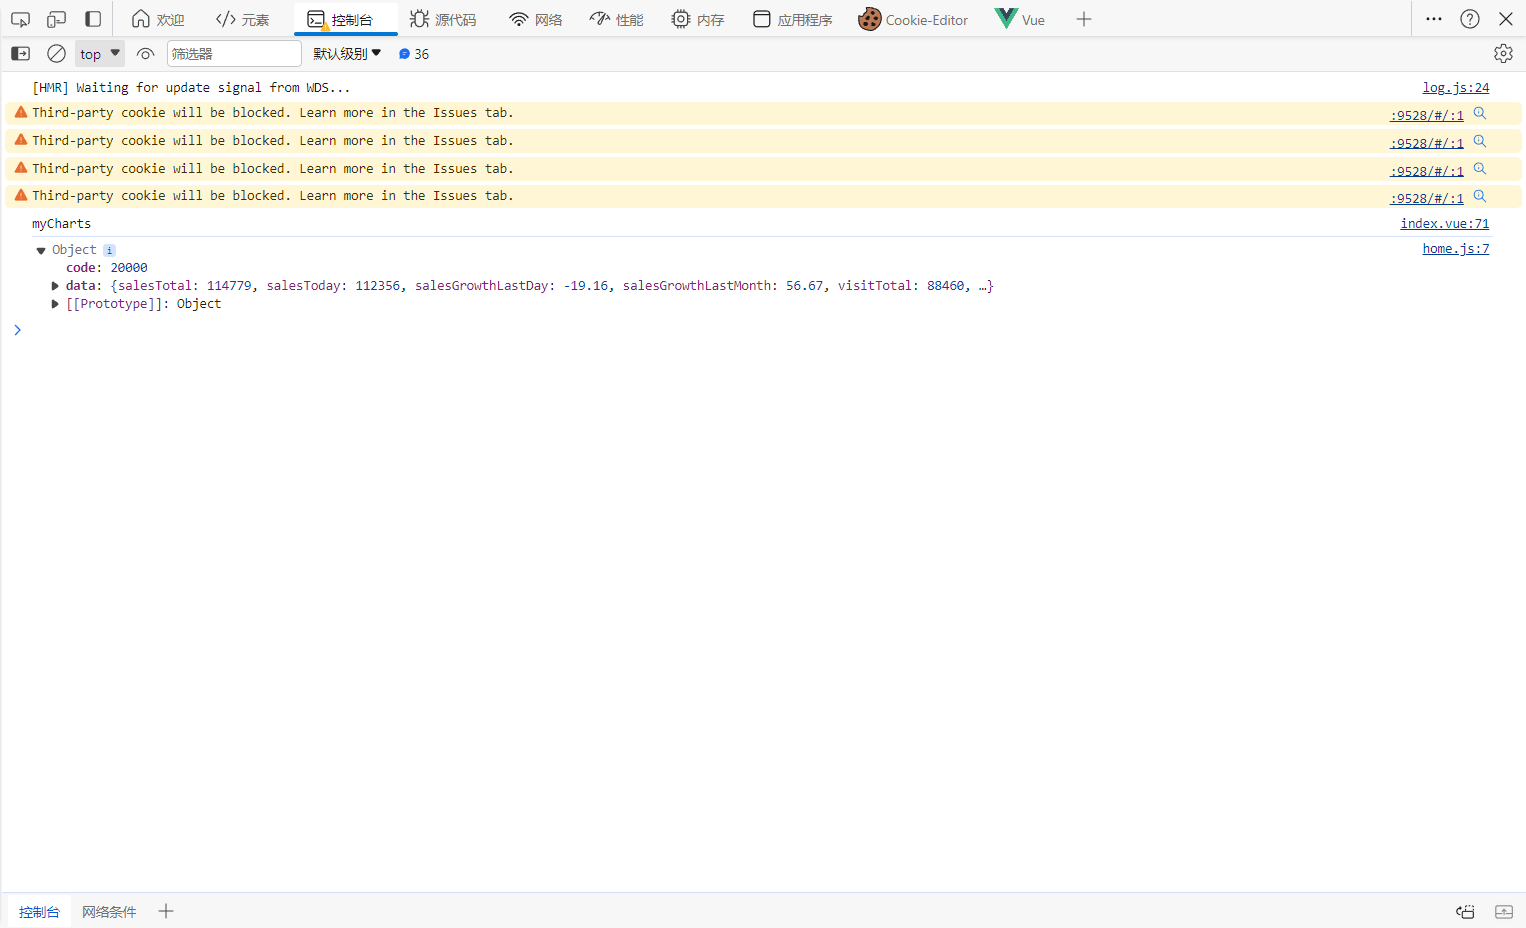
data是一个对象我们存储他,提交他
展示数据
先存储
在子组件当中,监听title属性,并相应的修改销售额或者访问量的图标信息
顶部是mounted,所有第一次没有数据,没有数据因此不显示,因此我们需要监听这个listState。如果有数据立即展示出来


 1014
1014

 被折叠的 条评论
为什么被折叠?
被折叠的 条评论
为什么被折叠?
 到【灌水乐园】发言


