


1. 引言
这段代码是一个使用Tkinter库创建的图形用户界面(GUI)应用程序,用于实现一个简单的白银价格预测系统。它包含了文件上传、图片显示、数据预测和结果显示等功能。
2.安装必要的库和库的导入
(这里提供一个比较好的镜像源 https://pypi.mirrors.ustc.edu.cn/simple)
-
tkinter: 这是Python的标准GUI库。通常,它已经预装在Python的官方安装包中,所以您可能不需要单独安装它。如果没有,您可以使用包管理器如
pip来安装它pip install tk -
PIL (Python Imaging Library): 用于图像处理。这个库经常以
Pillow作为更新和更活跃的分支存在,它提供了许多图像文件格式的处理能力。安装命令如下:pip install Pillow -
threading: 这是Python的标准库之一,用于实现多线程。它同样通常包含在Python的官方安装中,不需要单独安装。
-
pandas: 这是一个数据分析和操作库,非常适合处理CSV和Excel文件。安装命令如下:
pip install pandas -
from tkinter.ttk import Style: 这是
tkinter模块的子模块,提供了主题化控件,如进度条和树视图。它也通常包含在tkinter库中,不需要单独安装。 -
from tkinter import ttk:
ttk是Tkinter的一个主题化版本,提供了一些额外的控件,如树视图(Treeview)。同样,它通常包含在tkinter库中,不需要单独安装。 -
from model import train_and_predict: 这行代码导入了一个名为
train_and_predict的函数或类,它来自一个名为model的模块。这个模块不是Python标准库的一部分,是自己编写的,的第三方库。
3.做系统前的准备工作
3.1 基于Python编写多因子LSTM模型
- 添加数据或者找数据(我这里直接上传了我预处理后的数据,名为dataset.csv)
链接: https://download.csdn.net/download/weixin_65616971/89205631
- 写出代码并保存为modle.py文件(直接展示我的代码,不懂得自己研究哦!)
#!/usr/bin/env python
# coding: utf-8

# In[1]:

from tensorflow.keras.models import Model
import json
from math import sqrt
from keras.layers import LSTM, Dense, Dropout, Input
from keras.callbacks import EarlyStopping
from numpy import concatenate
from matplotlib import pyplot
from pandas import read_csv
from pandas import DataFrame
from pandas import concat
from sklearn.preprocessing import MinMaxScaler
from sklearn.preprocessing import LabelEncoder
from sklearn.metrics import mean_squared_error
from keras.models import Sequential
from keras.callbacks import ModelCheckpoint
from tensorflow.keras.optimizers import Adam
import numpy as np
import matplotlib.pyplot as plt
import pandas as pd
import seaborn as sns
import os
import math
from sklearn import metrics
from tensorflow.keras.models import load_model

def train_and_predict(file_path):
    plt.rcParams['font.sans-serif'] = ['SimHei']   # 解决中文显示问题
    plt.rcParams['axes.unicode_minus'] = False    # 解决中文显示问题

    data = pd.read_csv(file_path)
    data.sort_values('日期', inplace=True)

    xh_df_new = data[300:]
    xh_df_new.reset_index(drop=True, inplace=True)

    # 将一维数据转换为二维数组,然后转换为 DataFrame
    xhts_df = pd.DataFrame(np.array(xh_df_new['现货最高价']).reshape(-1, 1), columns=['现货最高价'])
    hjjg_df = pd.DataFrame(np.array(xh_df_new['黄金价格']).reshape(-1, 1), columns=['黄金价格'])
    GDP_df = pd.DataFrame(np.array(xh_df_new['GDP']).reshape(-1, 1), columns=['GDP'])
    bygp_df = pd.DataFrame(np.array(xh_df_new['白银股票']).reshape(-1, 1), columns=['白银股票'])

    # 合并这些 DataFrame 对象
    merged_df = pd.concat([xhts_df, hjjg_df, GDP_df, bygp_df], axis=1)

    # 创建 MinMaxScaler 对象
    scaler = MinMaxScaler()

    # 使用 fit_transform 方法对数据进行归一化
    scaled_df = scaler.fit_transform(merged_df)

    # 将归一化后的数据转换回 DataFrame
    scaled_df = pd.DataFrame(scaled_df, columns=merged_df.columns)

    # 取归一化后的数据的第30-600条
    X_train = []
    y_train = []
    for i in range(30, 600):
        X_train.append(scaled_df.iloc[i-30:i, :].values)  # 使用 .values 获取 numpy 数组
        y_train.append(scaled_df.iloc[i, 0])  # 假设我们只取 '现货最高价' 作为 y

    # 将 X_train 和 y_train 转换为 numpy 数组
    X_train, y_train = np.array(X_train), np.array(y_train)

    # 确保 X_train 是一个三维数组,每条数据有 30 个时间点,每个时间点有 4 个特征
    X_train = np.reshape(X_train, (X_train.shape[0], X_train.shape[1], len(scaled_df.columns)))

    # 使用 .iloc 来获取从索引600开始的、第一列的所有数据
    inputs = scaled_df.iloc[600:, 0].values

    # 将获取的数据重塑为 -1 表示自动计算行数,5 表示每行5个数据的二维数组
    inputs = inputs.reshape(-1, 1)


    # 创建 X_test 和 y_test
    inputs = scaled_df.iloc[600:].values
    # 确保inputs的形状是正确的
    assert inputs.shape[1] == 4  # 确认第二维确实是4个特征
    X_test = []
    y_test = []

    for i in range(30, 110):
        X_test.append(inputs[i-30:i, :])
        y_test.append(inputs[i, 0])

    X_test, y_test = np.array(X_test), np.array(y_test)
    X_test = np.reshape(X_test, (X_test.shape[0], X_test.shape[1], 4))

    # 将 y_test 重塑并逆归一化
    y_test = y_test.reshape(-1, 1)
    y_test_expanded = np.hstack([y_test, np.zeros((len(y_test), 3))])
    y_test_inversed = scaler.inverse_transform(y_test_expanded)
    y_test_feature = y_test_inversed[:, 0]

    # 加载之前保存的模型
    model = load_model(r'C:\Users\11506\Desktop\计算机\数据科学实训\multi_factor_lstm_model.keras')

    # 预测和逆归一化
    y_pred = model.predict(X_test)
    y_pred_reshaped = np.hstack([y_pred, np.zeros((len(y_pred), 3))])
    y_pred_inversed = scaler.inverse_transform(y_pred_reshaped)
    y_pred_selected_feature = y_pred_inversed[:, 0]

    # 评估模型
    rmse = np.sqrt(metrics.mean_squared_error(y_test, y_pred))
    mse = metrics.mean_squared_error(y_test, y_pred)
    r2 = metrics.r2_score(y_test, y_pred)


    return  mse, r2


# In[ ]:
这个也就是导入库中的from model import train_and_predict
4.创建窗口并且接入3中保存的modle.py文件
4.1 定义主函数
定义了一个名为 inputWin 的函数,其主要作用是创建和初始化一个图形用户界面(GUI)窗口,这个窗口是白银价格预测系统的一部分。下面是代码的逐行解释:
-
def inputWin()::定义了一个名为inputWin的函数。 -
global win1, filepath, progressbar, text_result, image_path, bg_image_tk:声明了六个全局变量,这意味着这些变量可以在函数外被访问和修改。 -
win1 = tk.Tk():创建了Tkinter的主窗口实例。 -
win1.title('白银价格预测系统 制作人:xxx'):设置了窗口的标题。 -
win1.geometry('670x470+374+182'):设置了窗口的几何属性,即宽度、高度以及相对于屏幕的位置。 -
custom_font = ("Arial", 16):定义了一个自定义字体,这里使用的是Arial字体,大小为16。 -
bg_image = Image.open(r'C:\Users\11506\Desktop\计算机\数据科学实训\back.png'):使用PIL库打开一个位于指定路径的背景图片文件。 -
bg_image_tk = ImageTk.PhotoImage(bg_image):将PIL图像转换为Tkinter兼容的PhotoImage对象。 -
bg_label = tk.Label(win1, image=bg_image_tk):创建了一个标签(Label),并将转换后的背景图片设置为该标签的图像。 -
bg_label.place(x=0, y=0, relwidth=1, relheight=1):将背景标签放置在窗口的(0,0)位置,并设置其宽度和高度相对于窗口的宽度和高度。 -
bg_label.image = bg_image_tk:设置标签的图像属性,确保在标签被删除时,关联的图片也能被垃圾回收。 -
y1=50:定义了一个变量y1,可能用于后续布局中定位元素的Y坐标偏移。 -
style = ttk.Style():创建了一个用于设置Tkinter主题和样式的Style对象。 -
style.theme_use("clam"):设置了Tkinter的主题为"clam"。 -
style.configure("Custom.Red.TButton", font=("Arial",18),padding=4,foreground="red"):配置了一个自定义的红色按钮样式。 -
style.configure("Custom.TButton", font=("Tahoma",18), padding=4):配置了一个自定义的按钮样式。 -
style.configure("Custom.Treeview", font=('Arial', 15)):配置了树视图(Treeview)的字体样式。 -
image_labels = []:初始化了一个空列表,可能用于后续存储图像标签的引用。 -
filepath = '':初始化了一个空字符串,用于存储文件路径。 -
image_path = '':初始化了另一个空字符串,可能用于存储图像文件的路径。
这个函数主要负责设置白银价格预测系统窗口的背景、样式和一些全局变量的初始状态。它不包含事件处理逻辑,如按钮点击等,这些通常会在函数外部定义,并在创建相应组件时关联到这些事件处理函数。
4.2添加你所需要的功能函数
(这里我只举例预测模型的功能)
def predict():
    global filepath, progressbar
    progressbar.start(8)

    def predict_task():
        mse, r2 = train_and_predict(filepath)
        win1.after(0, lambda: show_result(mse, r2))
        progressbar.stop()

    threading.Thread(target=predict_task).start()

def show_result(mse, r2):
    text_result.config(state=tk.NORMAL)
    text_result.insert(tk.END, f'预测结束!\n均方误差为{mse:.4f}\nR方为{r2:.4f}\n', "center")
    text_result.config(state=tk.DISABLED)
    progressbar["value"] = 400

# 然后在UI设置中,有关于开始预测按钮的定义:
btn_predict = ttk.Button(win1, text='开始预测', command=predict, style="Custom.TButton")
btn_predict.place(x=150, y=350+y1, width=250)

# 以及用于显示预测结果的文本框:
text_result = tk.Text(win1, height=5, width=40,font=custom_font)
text_result.configure(background='#CDC5BF', foreground='black')
text_result.tag_configure("center", justify="center")
text_result.place(x=150, y=410+y1, width=250, height=100)
在这段代码中:
-
predict函数是一个事件处理函数,当用户点击“开始预测”按钮时,此函数会被触发。它首先启动一个进度条,表示程序正在处理预测任务。然后,它创建一个新的线程来执行预测任务,以避免阻塞GUI的主线程。 -
predict_task函数是实际执行预测任务的函数。它调用train_and_predict函数(这个函数应该定义在model模块中,但在这里并未给出其实现),计算模型的均方误差(MSE)和R方(R^2)值。然后,它使用win1.after调用show_result函数来更新GUI,显示预测结果,并停止进度条。 -
show_result函数用于将预测结果格式化为字符串,并将其插入到文本框text_result中。文本框被配置为不可编辑状态,并且预测结果显示为居中。 -
btn_predict是触发predict函数的按钮,使用ttk.Button创建,并放置在窗口中的指定位置。 -
text_result是一个tk.Text控件,用作显示预测结果的文本框,它也被放置在窗口中的指定位置。
注意,为了使这段代码正常工作,您需要确保 train_and_predict 函数存在并且能够返回预测所需的MSE和R^2值,同时主程序中的其他部分(如全局变量的定义和主窗口 win1 的初始化)也应当适当设置。
5.最终我的展示代码
import tkinter as tk
from tkinter import filedialog
from tkinter.ttk import Progressbar,Treeview
from PIL import Image, ImageTk
from model import train_and_predict
import threading
from tkinter.ttk import Style
from tkinter import ttk
import pandas as pd

def inputWin():
    global win1, filepath, progressbar, text_result, image_path, bg_image_tk  # 声明bg_image_tk为全局变量

    win1 = tk.Tk()
    #win1.attributes('-fullscreen', True)  # 设置全屏显示
    win1.title('白银价格预测系统  制作人:Chen爱zheng')
    win1.geometry('670x470+374+182')
    # 设置窗口的背景颜色
    #win1.config(bg="#D3D3D3")  # 可以设置为任何合法的颜色名或颜色代码
    # 创建自定义字体对象
    custom_font = ("Arial", 16)  # 修改成你想要的字体和大小


    # Load the background image and keep a reference to the label
    global bg_label  # 声明bg_label为全局变量
    bg_image = Image.open(r'C:\Users\11506\Desktop\计算机\数据科学实训\back.png')
    bg_image_tk = ImageTk.PhotoImage(bg_image)
    bg_label = tk.Label(win1, image=bg_image_tk)
    bg_label.place(x=0, y=0, relwidth=1, relheight=1)
    bg_label.image = bg_image_tk

    y1=50

    style = ttk.Style()
    style.theme_use("clam")

    # 设置一个特定按钮的样式

    style.configure("Custom.Red.TButton", font=("Arial",18),padding=4,foreground="red")

    style.configure("Custom.TButton", font=("Tahoma",18), padding=4)
    # 设置表格中文字的大小为12
    style.configure("Custom.Treeview", font=('Arial', 15))


    image_labels = []
    filepath = ''
    image_path = ''

    def selectFile():
        global filepath
        filepath = filedialog.askopenfilename()
        entry_file.delete(0, tk.END)
        entry_file.insert(0, filepath)

    def selectImage():
        global image_path
        image_path = filedialog.askopenfilename(title="Select Image 1", filetypes=[("Image Files", "*.png;*.jpg;*.jpeg")])
        entry_image.delete(0, tk.END)
        entry_image.insert(0, image_path)

    def selectImage2():
        global image_path2
        image_path2 = filedialog.askopenfilename(title="Select Image 2", filetypes=[("Image Files", "*.png;*.jpg;*.jpeg")])
        entry_image2.delete(0, tk.END)
        entry_image2.insert(0, image_path2)

    def predict():
        global filepath, progressbar
        progressbar.start(8)

        def predict_task():
            mse, r2 = train_and_predict(filepath)
            win1.after(0, lambda: show_result(mse, r2))
            progressbar.stop()

        threading.Thread(target=predict_task).start()

    def show_result(mse, r2):
        text_result.config(state=tk.NORMAL)
        text_result.insert(tk.END, f'预测结束!\n均方误差为{mse:.4f}\nR方为{r2:.4f}\n', "center")
        text_result.config(state=tk.DISABLED)
        progressbar["value"] = 400

    def load_img2():
        global image_path2, win1, bg_label, image_labels

        if not image_path2:
            print("No image selected for image 2.")
            return

        try:
            img = Image.open(image_path2)

            # 获取图片的原始尺寸
            img_width, img_height = img.size

            # 设置缩放比例为0.5,等比例缩小图片
            scale_factor = 0.8
            new_width = int(img_width * scale_factor)
            new_height = int(img_height * scale_factor)

            # 创建一个缩小尺寸的图片
            img_resized = img.resize((new_width, new_height), Image.ANTIALIAS)

            # 将缩小尺寸的图片转换为 Tkinter 可以使用的 PhotoImage
            img_tk = ImageTk.PhotoImage(img_resized)

            img_tk = ImageTk.PhotoImage(img_resized)

            # Create a new Label widget to display the image and add it to the global list
            image_label2 = tk.Label(win1, image=img_tk)
            image_label2.image = img_tk
            image_label2.place(x=1350, y=400, width=new_width)  # Adjust placement as needed
            image_labels.append(image_label2)  # Add to the global list

        except Exception as e:
            print(f"Failed to load image 2: {e}")

    def load_img():
        global image_path, win1, bg_label, image_labels  # 声明全局变量,以确保可以访问bg_label和image_labels

        if not image_path:
            print("No image selected for image 1.")
            return

        try:
            # 移除所有已存在的图片Label控件,除了背景标签bg_label
            for widget in win1.winfo_children():
                if isinstance(widget, tk.Label) and hasattr(widget, 'image') and widget != bg_label:
                    widget.destroy()
                    if widget in image_labels:
                        image_labels.remove(widget)  # 从全局列表中移除该Label

            img = Image.open(image_path)

            # 获取图片的原始尺寸
            img_width, img_height = img.size

            # 设置缩放比例为0.5,等比例缩小图片
            scale_factor = 0.8
            new_width = int(img_width * scale_factor)
            new_height = int(img_height * scale_factor)

            # 创建一个缩小尺寸的图片
            img_resized = img.resize((new_width, new_height), Image.ANTIALIAS)

            # 将缩小尺寸的图片转换为 Tkinter 可以使用的 PhotoImage
            img_tk = ImageTk.PhotoImage(img_resized)

            # 创建一个新的 Label 控件来显示图片,并添加到全局列表image_labels
            image_label = tk.Label(win1, image=img_tk)
            image_label.image = img_tk
            image_label.place(x=660, y=400, width=new_width)  # 根据需要调整位置
            image_labels.append(image_label)  # 添加到全局列表

        except Exception as e:
            print(f"Failed to load image 1: {e}")

    def display_csv_content():
        global filepath, treeview, win1
        if not filepath:
            print("No CSV file selected.")
            return

        try:
            df = pd.read_csv(filepath)

            # Create Treeview if it's not defined
            if not hasattr(display_csv_content, 'treeview'):
                treeview = Treeview(win1, columns=['#1', '#2', '#3', '#4', '#5', '#6'], show='headings',style='Custom.Treeview')
                treeview.heading('#1', text='日期')
                treeview.heading('#2', text='现货最高价')
                treeview.heading('#3', text='现货最低价')
                treeview.heading('#4', text='黄金价格')
                treeview.heading('#5', text='USD/CNY')
                treeview.heading('#6', text='GDP')

                # 设置Treeview的样式
                treeview_style = ttk.Style()
                treeview_style.configure('Custom.Treeview.Heading', font=('Tahoma', 18))  # 设置列标题的字体

                # 固定表格的位置和大小
                treeview.place(x=660, y=20, width=1200, height=370)  # 根据需要调整位置和大小

                # Set column width (optional)
                treeview.column('#1', width=100,anchor=tk.CENTER)
                treeview.column('#2', width=100,anchor=tk.CENTER)
                treeview.column('#3', width=100,anchor=tk.CENTER)
                treeview.column('#4', width=100,anchor=tk.CENTER)
                treeview.column('#5', width=100,anchor=tk.CENTER)
                treeview.column('#6', width=100,anchor=tk.CENTER)

            # Clear previous content
            treeview.delete(*treeview.get_children())

            # Insert new content
            for index, row in df.iterrows():
                treeview.insert('', 'end', values=row.tolist())

        except Exception as e:
            print(f"Failed to display CSV content: {e}")


        # 添加一个退出按钮
    def on_closing():
        if win1.state() == 'zoomed':  # 如果窗口是全屏的
            win1.attributes('-fullscreen', False)  # 退出全屏
            win1.iconify()  # 窗口最小化
        else:
            win1.destroy()  # 如果不是全屏的,则关闭窗口


    # 按钮定义及布局
    btn_upfile = ttk.Button(win1, text='上传文件', command=selectFile, style="Custom.Red.TButton")
    btn_upfile.place(x=150, y=50, width=250)

    # 上传文件文本框
    entry_file = ttk.Entry(win1, width=50)
    entry_file.place(x=150, y=100, width=250)

    btn_display_csv = ttk.Button(win1, text="显示CSV内容", command=display_csv_content, style="Custom.TButton")
    btn_display_csv.place(x=150, y=150, width=250)

    btn_predict = ttk.Button(win1, text='开始预测', command=predict, style="Custom.TButton")
    btn_predict.place(x=150, y=350+y1, width=250)

    # 预测文本框
    text_result = tk.Text(win1, height=5, width=40,font=custom_font)
    text_result.configure(background='#CDC5BF', foreground='black')
    text_result.tag_configure("center", justify="center")
    text_result.place(x=150, y=410+y1, width=250, height=100)


    # UI Elements
    btn_select_image = ttk.Button(win1, text='选择图片 1', command=selectImage, style="Custom.TButton")
    btn_select_image.place(x=50, y=220, width=200)

    entry_image = ttk.Entry(win1, width=50)
    entry_image.place(x=50, y=270, width=200)

    btn_show = ttk.Button(win1, text="显示图片 1", command=load_img, style="Custom.TButton")
    btn_show.place(x=300, y=170+y1, width=200)

    btn_select_image2 = ttk.Button(win1, text='选择图片 2', command=selectImage2, style="Custom.TButton")
    btn_select_image2.place(x=50, y=250+y1, width=200)

    entry_image2 = ttk.Entry(win1, width=50)
    entry_image2.place(x=50, y=350, width=200)

    btn_show = ttk.Button(win1, text="显示图片 2", command=load_img2, style="Custom.TButton")
    btn_show.place(x=300, y=250+y1, width=200)

    progressbar = ttk.Progressbar(win1, mode='indeterminate', length=400)
    progressbar.place(x=30, y=550+y1, width=500)

    btn_exit = ttk.Button(win1, text='退出', command=on_closing,style="Custom.Red.TButton")
    btn_exit.place(x=150, y=720+y1, width=250)  # 放置在预测文本框的正下方


    win1.mainloop()

def main():
    inputWin()


if __name__ == '__main__':
    main()
6.代码大概的思路和部分解释
1. 全局变量和窗口初始化
定义了一些全局变量,如win1(主窗口)、filepath(文件路径)、progressbar(进度条)等,并初始化了主窗口。
2. 背景图片设置
使用PIL库加载背景图片,并将其设置为窗口的背景。
3. 样式设置
使用ttk.Style设置了按钮和树状视图的样式。
4. 文件和图片选择功能
定义了selectFile、selectImage和selectImage2函数,允许用户通过文件对话框选择文件和图片。
5. 预测功能
predict函数启动进度条,并创建一个新线程来执行预测任务,避免阻塞主线程。
6. 预测任务执行
predict_task函数调用train_and_predict函数进行模型训练和预测,并将结果显示在文本框中。
7. 图片显示功能
load_img和load_img2函数用于加载和显示用户选择的图片。
8. CSV内容显示
display_csv_content函数读取用户选择的CSV文件,并将其内容显示在树状视图中。
9. 退出功能
on_closing函数定义了退出按钮的行为,可以最小化或关闭窗口。
10. 按钮和文本框布局
代码的最后部分定义了按钮和文本框的布局,使用place方法将它们放置在窗口中的指定位置。
11. 主函数
main函数调用inputWin来启动GUI。
12. 程序入口
如果直接运行这个脚本,将执行main函数,启动应用程序。
13.代码的构思和运用到的知识点
- Tkinter:用于创建跨平台的GUI应用程序。
- 线程:使用
threading库实现多线程,使得预测过程不会阻塞用户界面。 - PIL库:用于图像的加载和显示。
- pandas库:用于处理CSV文件,提供了强大的数据分析功能。
- 事件驱动编程:Tkinter应用程序基于事件驱动,用户的操作(如点击按钮)会触发相应的函数。
14.每个代码的含义
- 全局变量:用于在不同函数间共享数据。
- 样式配置:通过
ttk.Style配置了按钮和树状视图的外观。 - 文件和图片选择:使用
filedialog.askopenfilename允许用户选择文件或图片。 - 进度条:显示程序的运行状态,提高用户体验。
- 多线程:通过
threading.Thread实现,使得长时间运行的任务不会阻塞主界面。 - 图像处理:使用PIL库对图像进行缩放和显示。
- CSV显示:使用pandas读取CSV文件,并使用Treeview组件展示数据。
15.用法
- 运行脚本,将出现一个窗口。
- 点击“上传文件”按钮,选择一个文件,然后在下方文本框中显示路径。
- 选择图片,然后点击“显示图片”按钮来展示图片。
- 点击“显示CSV内容”按钮,如果选择的是CSV文件,将在树状视图中显示其内容。
- 点击“开始预测”按钮,程序将在后台进行预测,并通过进度条显示进度。
- 预测完成后,结果将在文本框中显示。
- 点击“退出”按钮,可以关闭程序。
16.结语
这段代码展示了如何使用Python的多个库来创建一个功能完整的GUI应用程序。通过多线程和事件驱动的编程,它提供了良好的用户体验。同时,它也是一个数据处理和机器学习模型预测的简单示例。
7.运行展示
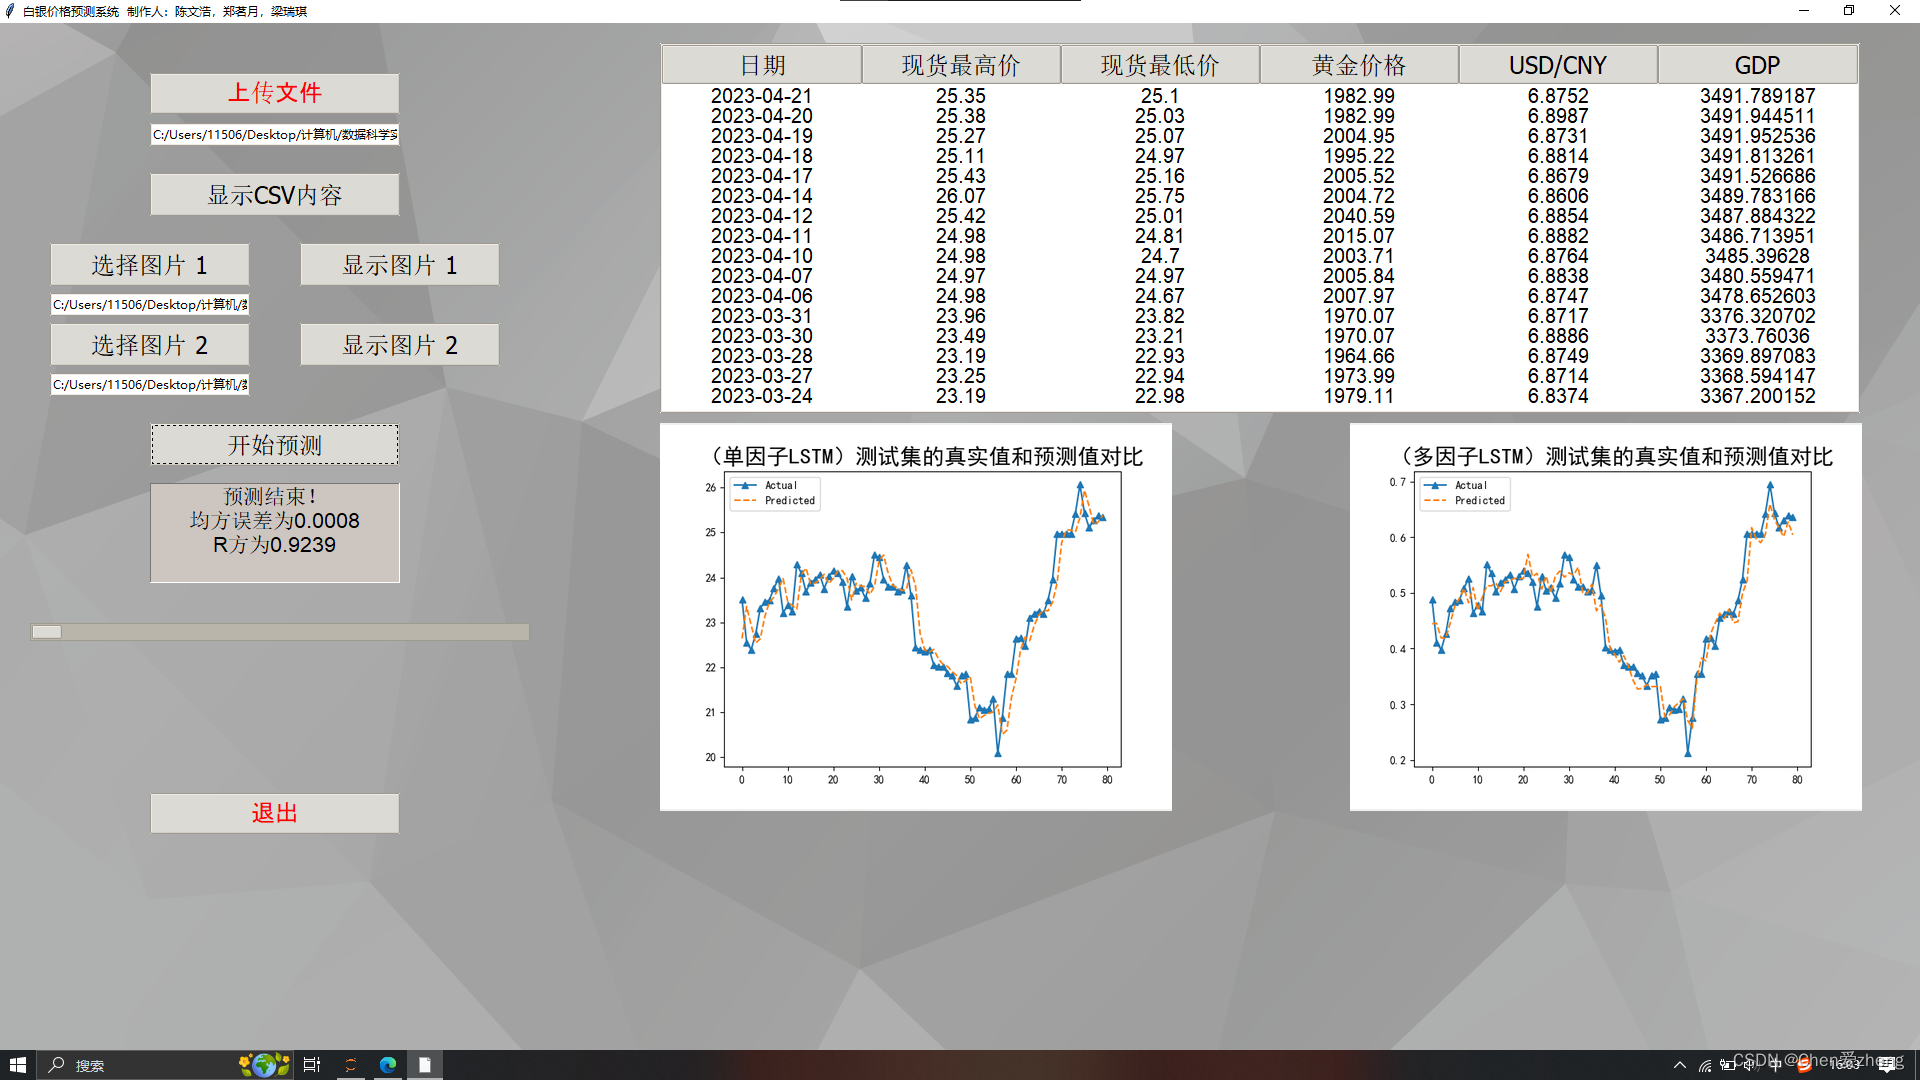
有问题欢迎留言一起学习哦!


 1823
1823


 被折叠的 条评论
为什么被折叠?
被折叠的 条评论
为什么被折叠?
 到【灌水乐园】发言


