


一、docker安装
1、centos7 安装docker: 安装依赖
yum install -y yum-utils device-mapper-persistent-data lvm22、安装docker
curl -fsSL https://get.docker.com | bash -s docker --mirror Aliyun3、设置开机启动
systemctl enable docker二、prometheus
1、下载Prometheus镜像
docker pull prom/prometheus2、创建Prometheus容器
docker run -itd --name=docker_prometheus --restart=always -p 9090:9090 prom/prometheus3、启动Prometheus
docker start docker_prometheus
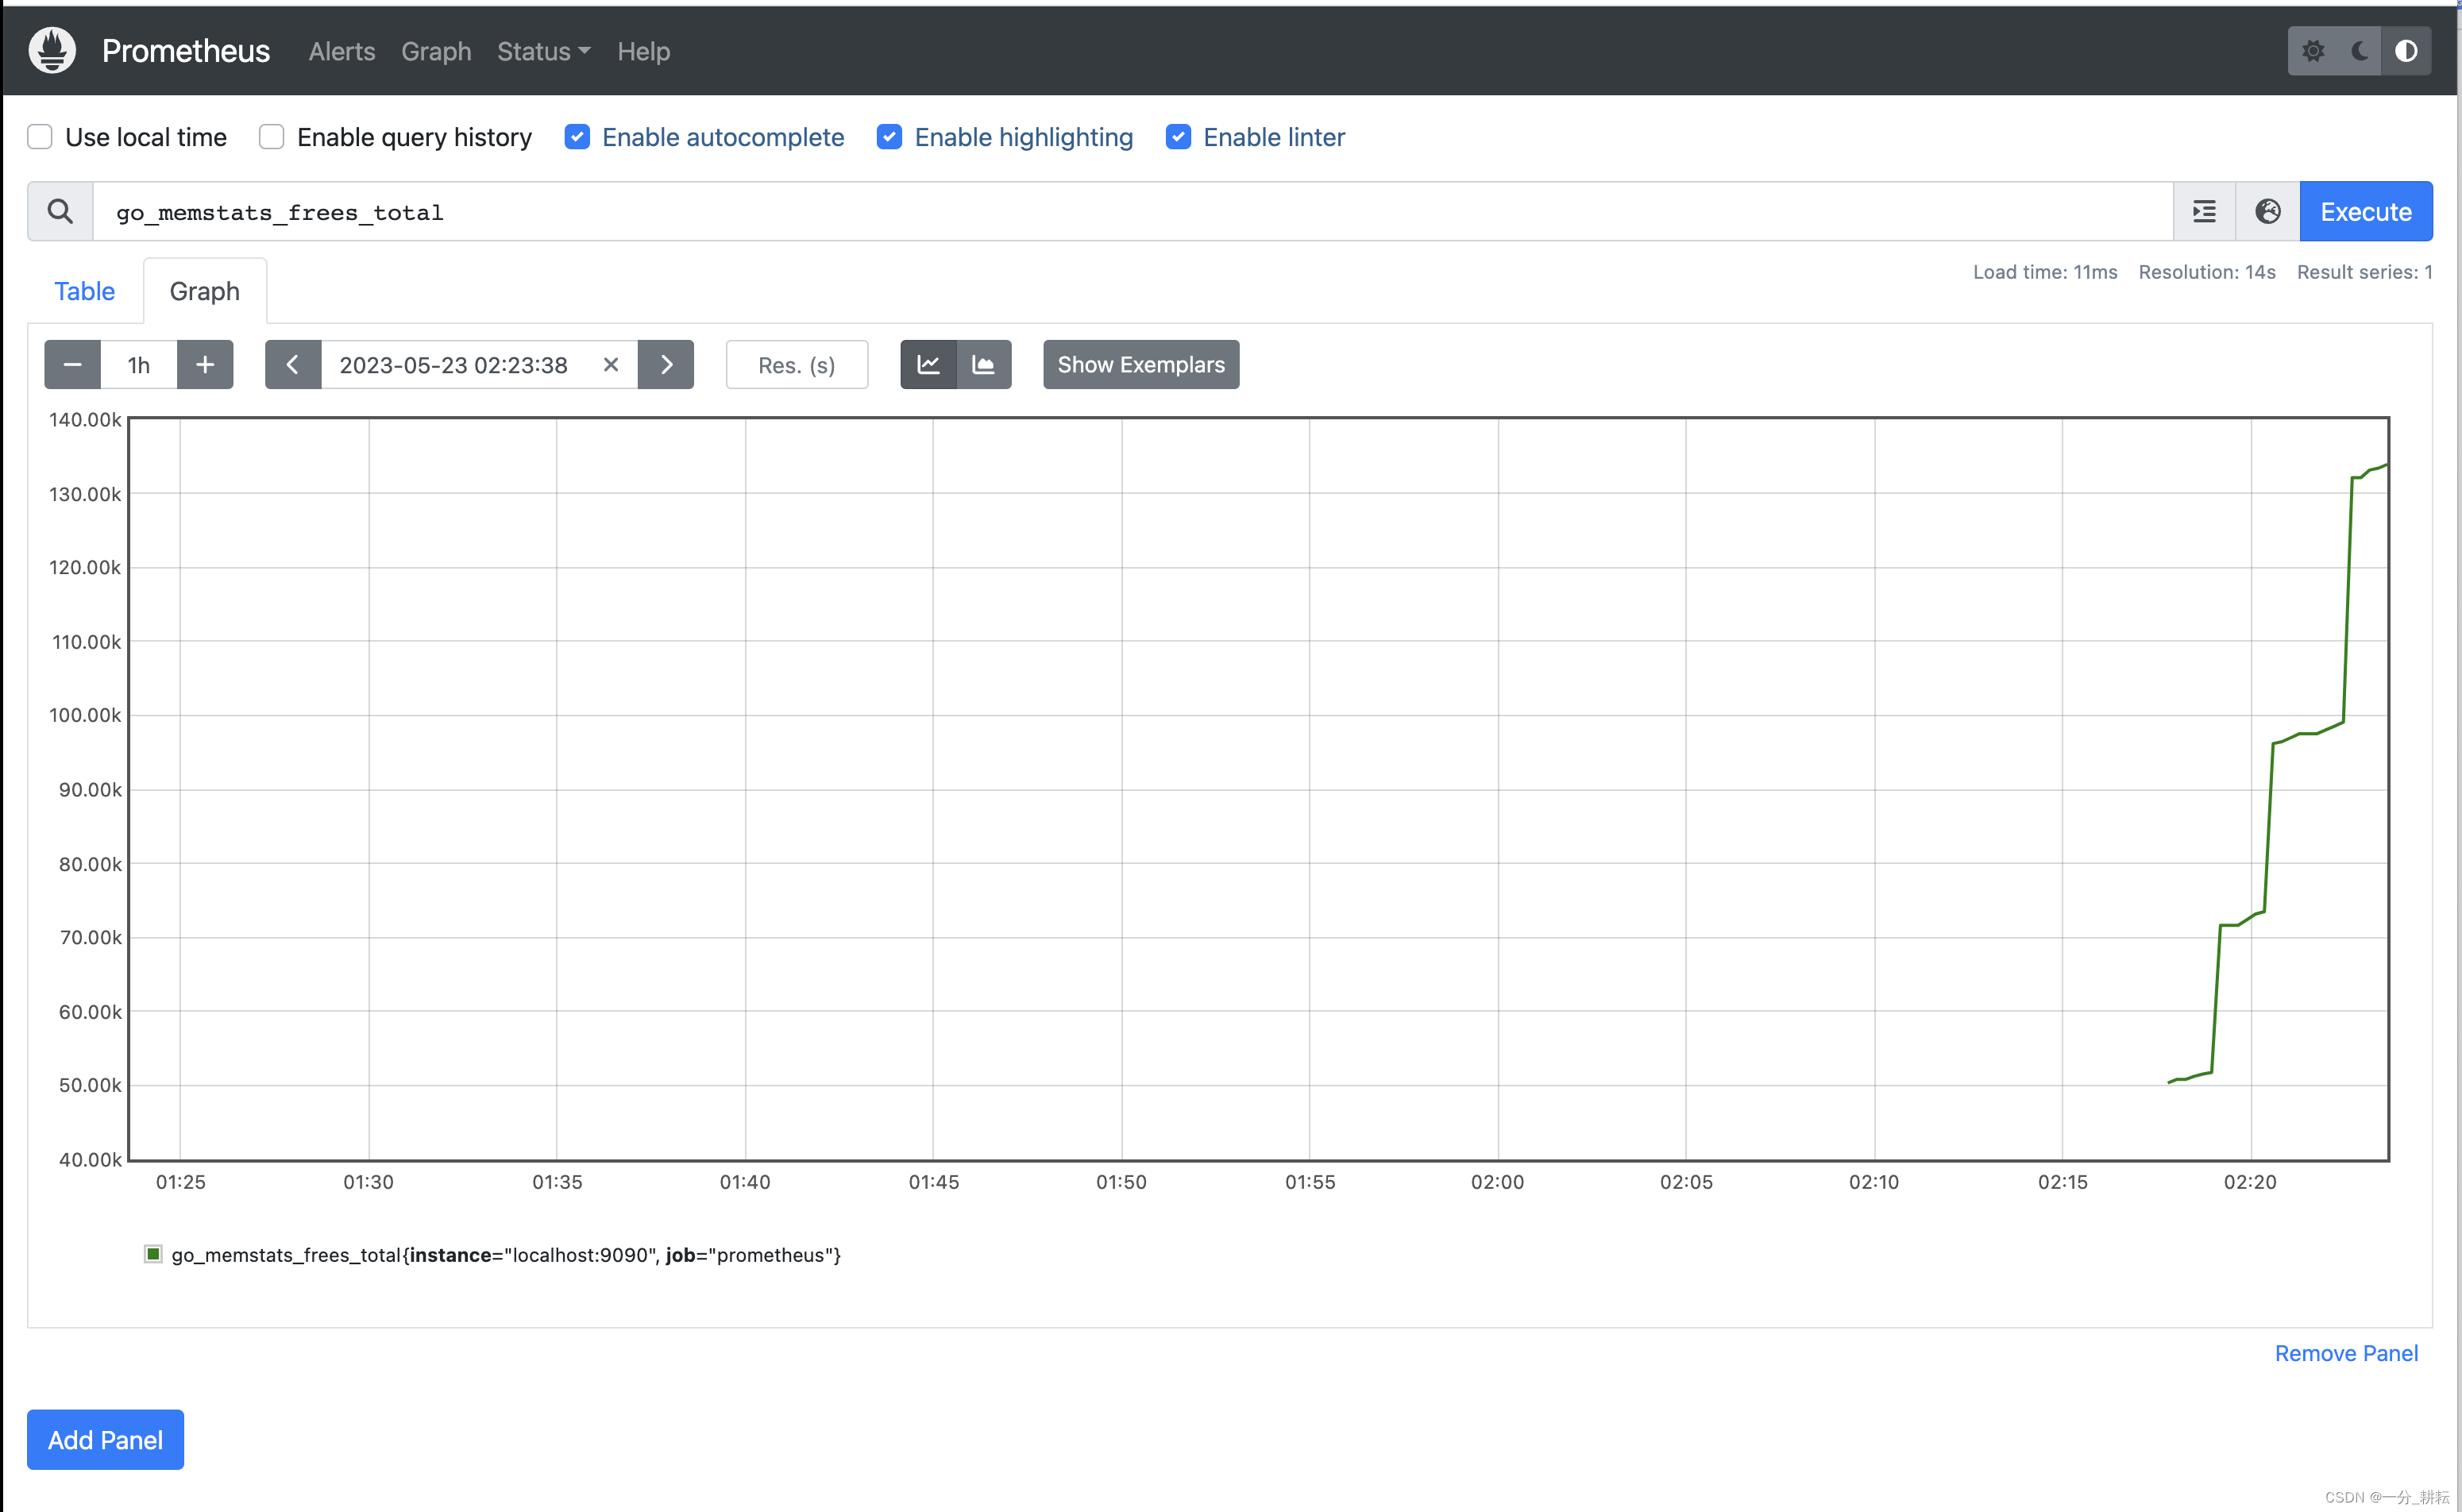
4、在浏览器输入 机器ip:9090 查看或 http://localhost:9090/
5、node_export部署在被监控的服务器
docker pull prom/node-exporter6、创建容器
docker run -itd --name=node-exporter --restart=always -p 9100:9100 -v "/proc:/host/proc:ro" -v "/sys:/host/sys:ro" -v "/:/rootfs:ro" prom/node-exporter7、启动容器
docker start node-exporter8、防火墙上开放指定9100端口
firewall-cmd --zone=public --add-port=9100/tcp --permanent  9、通过地址访问是否正常访问 地址:部署在被监控的服务器ip:9100

10、在宿主机修改Prometheus配置文件,增加被监控的服务器ip:9100收集器地址。
从Prometheus容器中拷贝配置文件到宿主机
docker cp docker_prometheus:/etc/prometheus/prometheus.yml $PWD11、编辑prometheus.yml文件,注意格式;想添加多个监控服务器时,可以在中括号中,用逗号 分隔写多个。
vim prometheus.yml
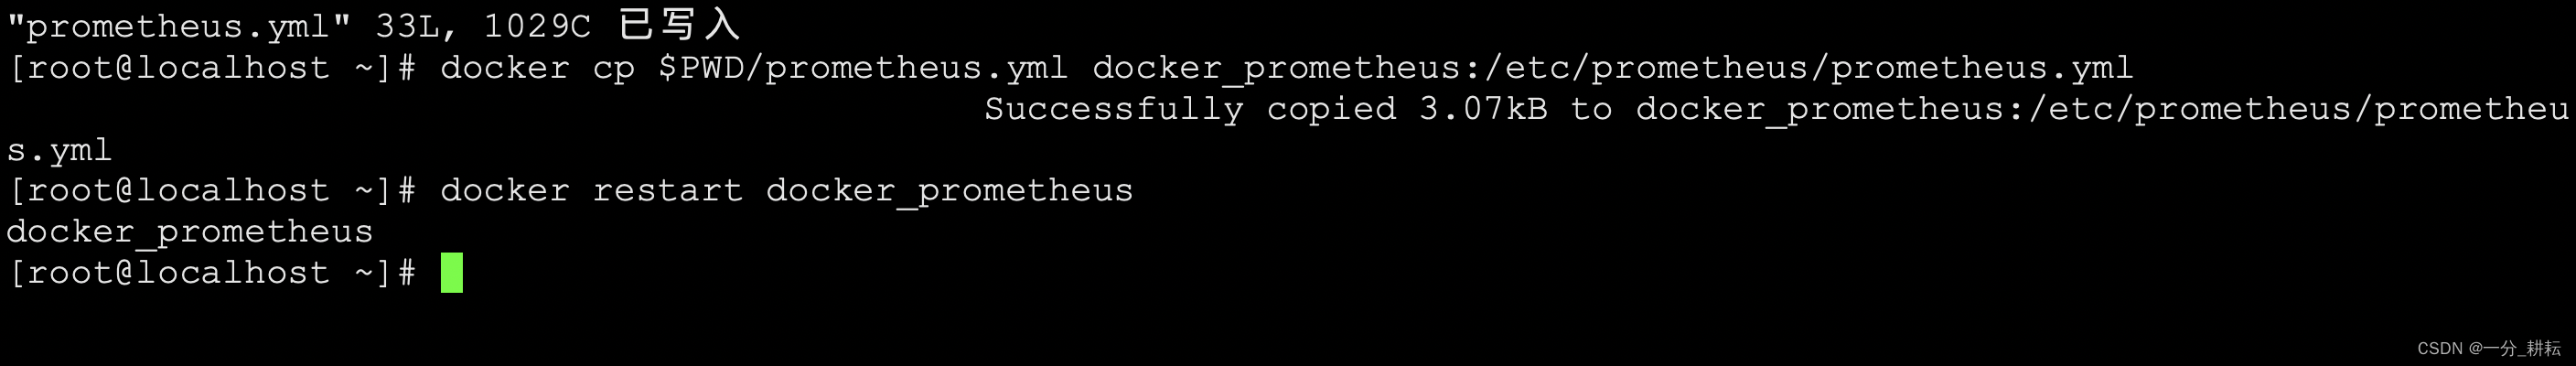
12、把修改后的Prometheus配置文件拷贝到容器中
docker cp $PWD/prometheus.yml docker_prometheus:/etc/prometheus/prometheus.yml13、重启Prometheus容器
docker restart docker_prometheus
三、grafana
1、下载grafana镜像
docker pull grafana/grafana2、创建容器
docker run -itd --name=grafana --restart=always -p 3000:3000 grafana/grafana3、启动容器
docker start grafana
4、通过浏览器访问,机器ip:3000 或 http://localhost:3000/
默认账号密码都是:admin

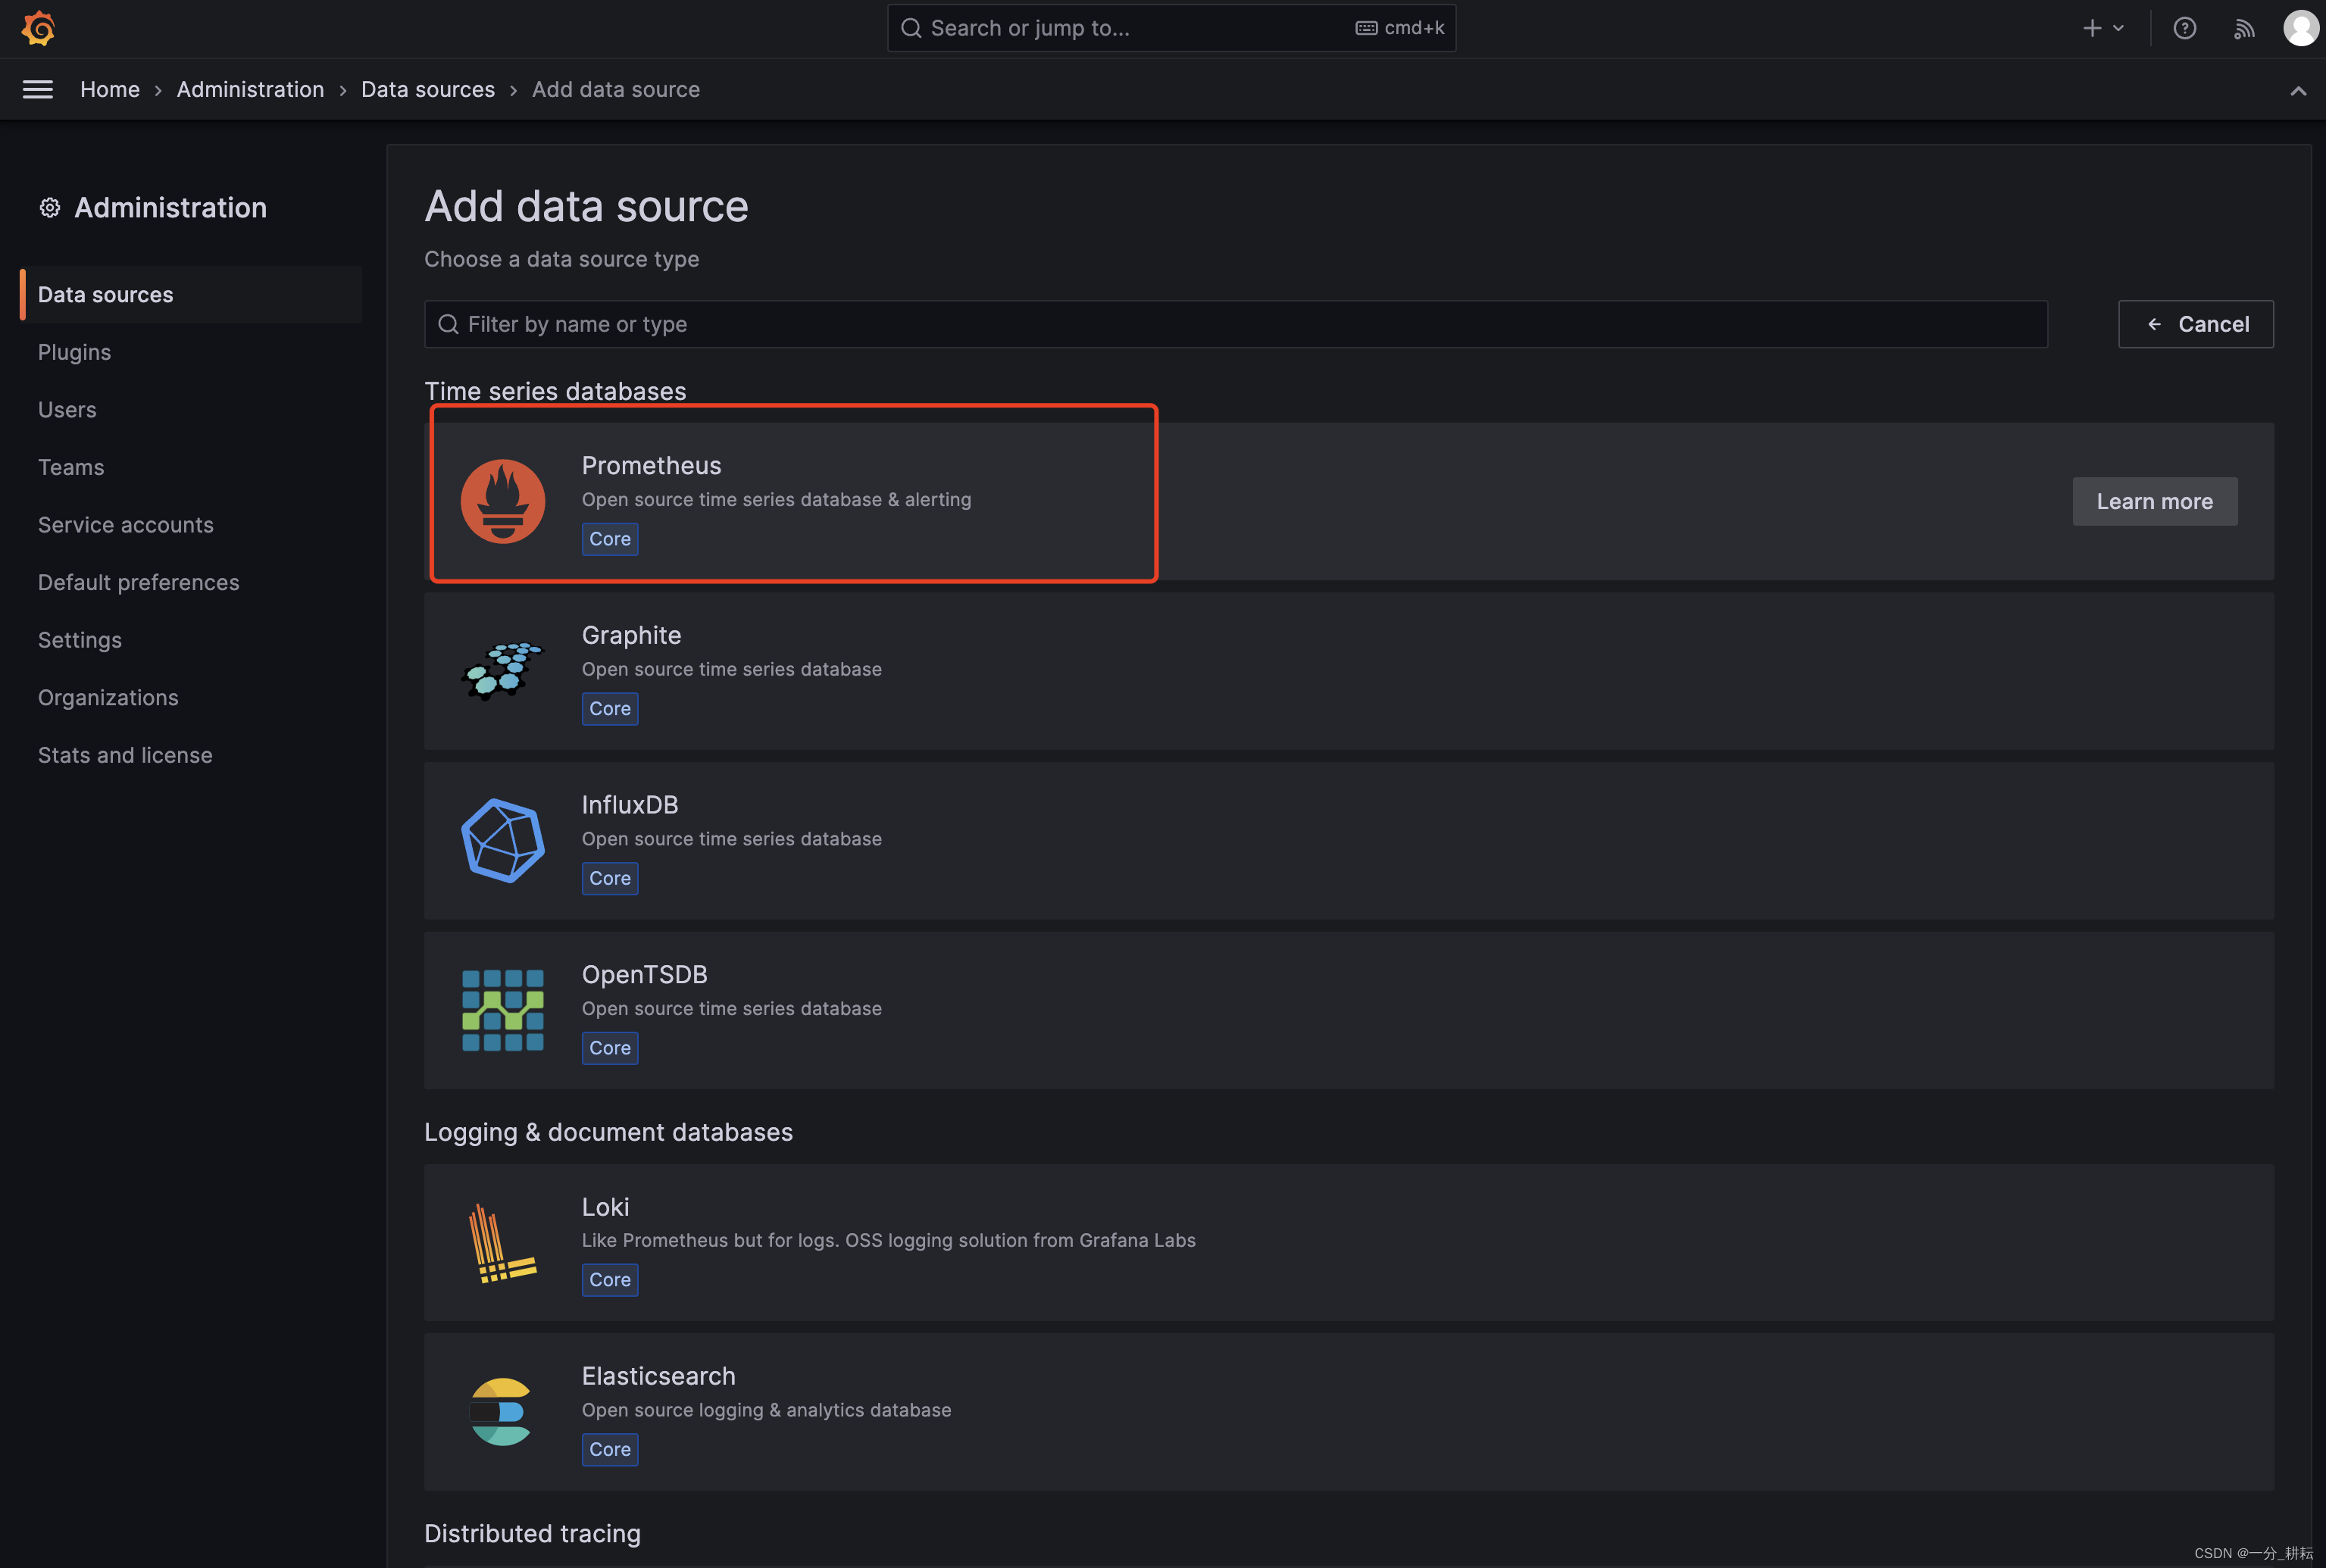
5、选择 "Add your first data source"

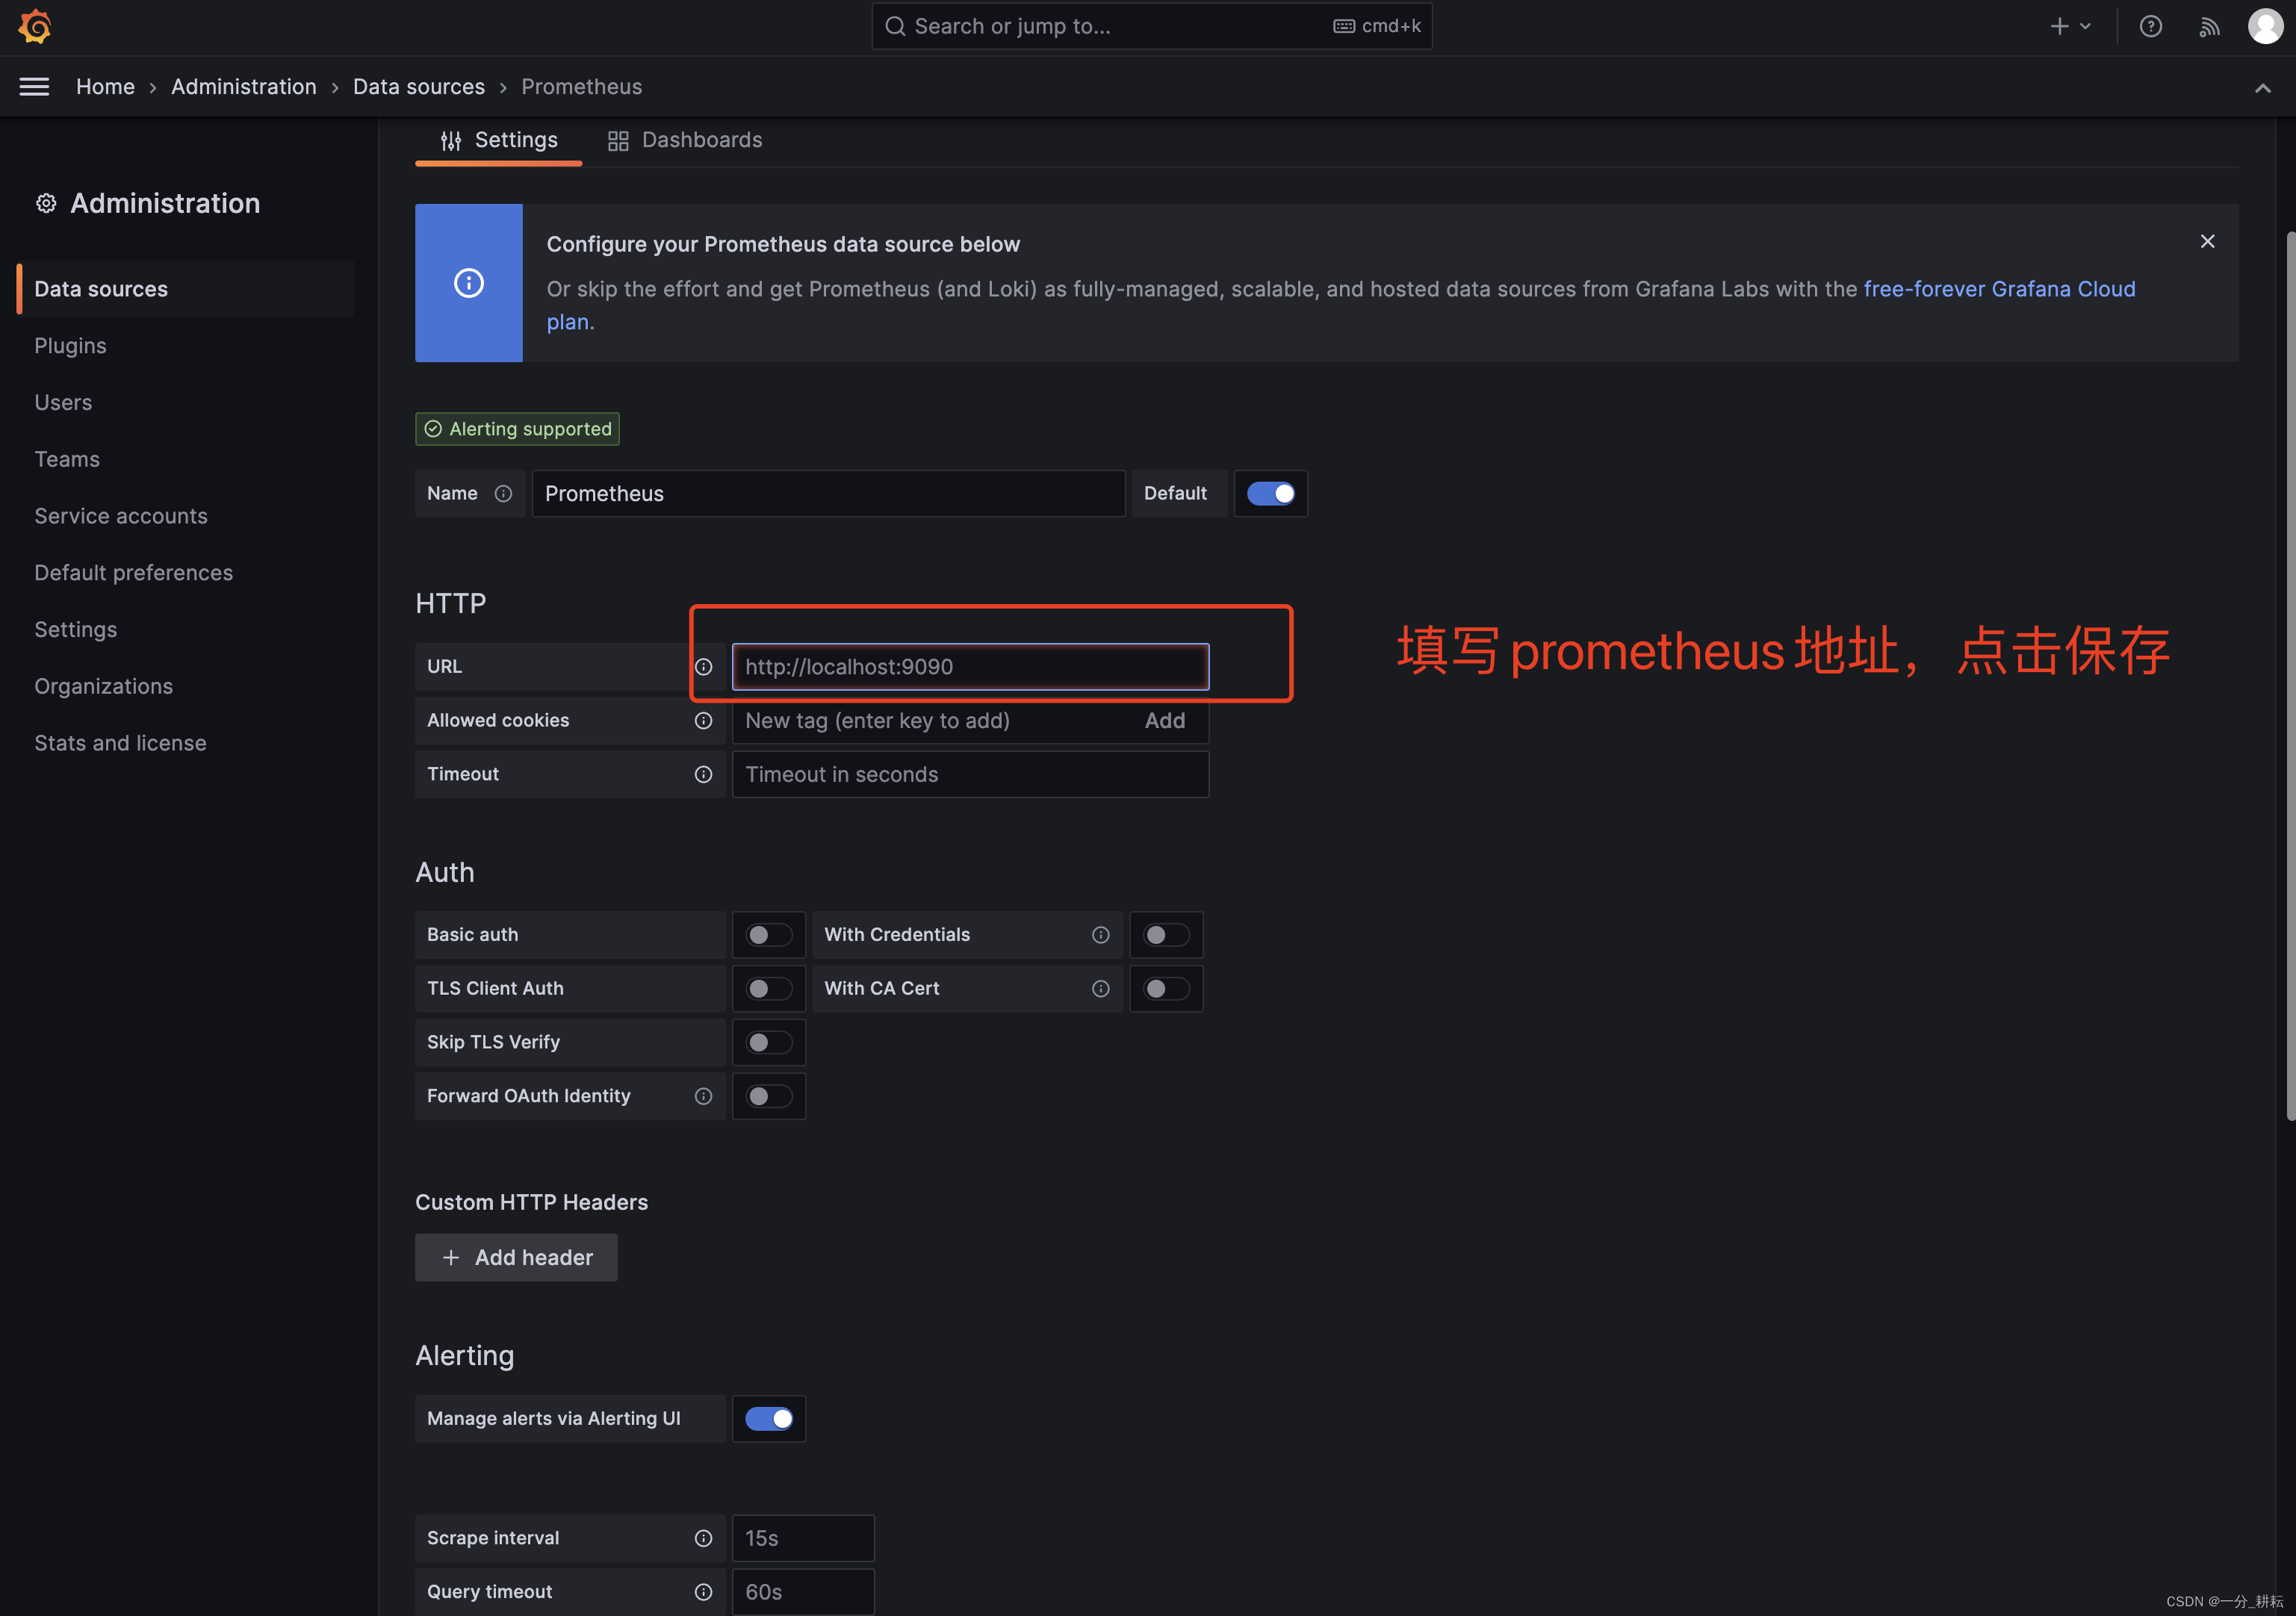
6、选择Prometheus填写相关信息
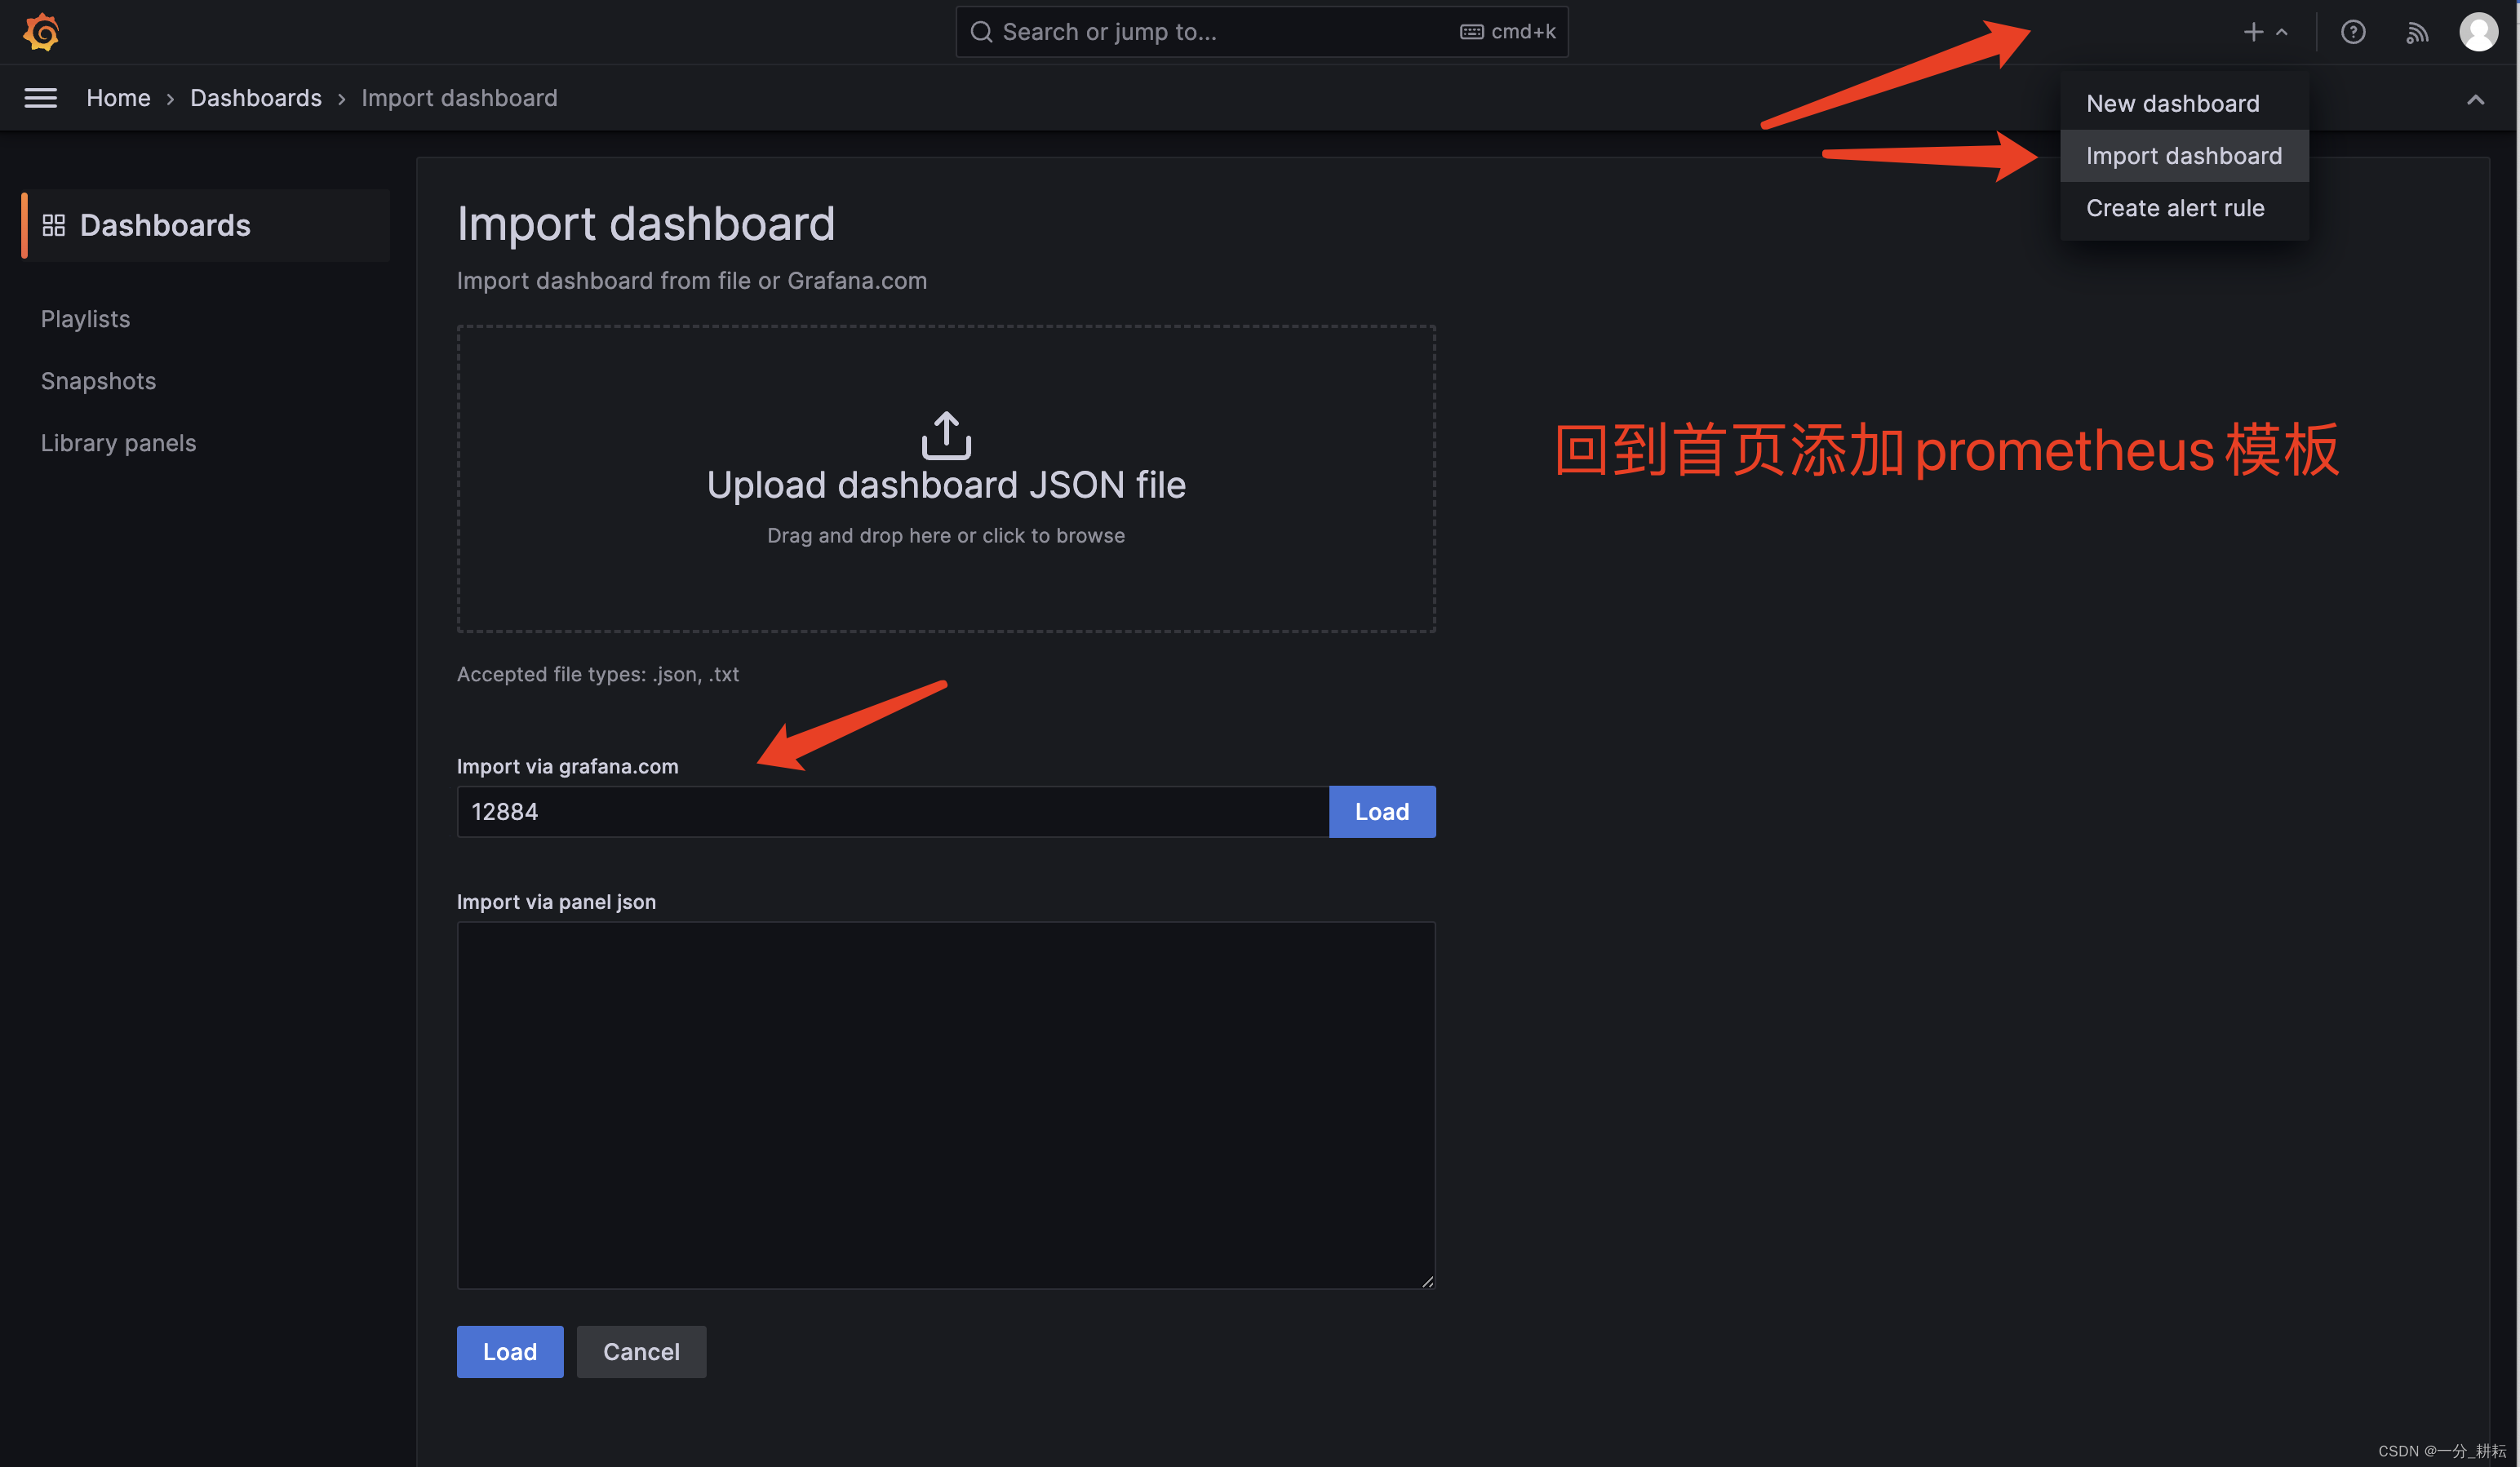
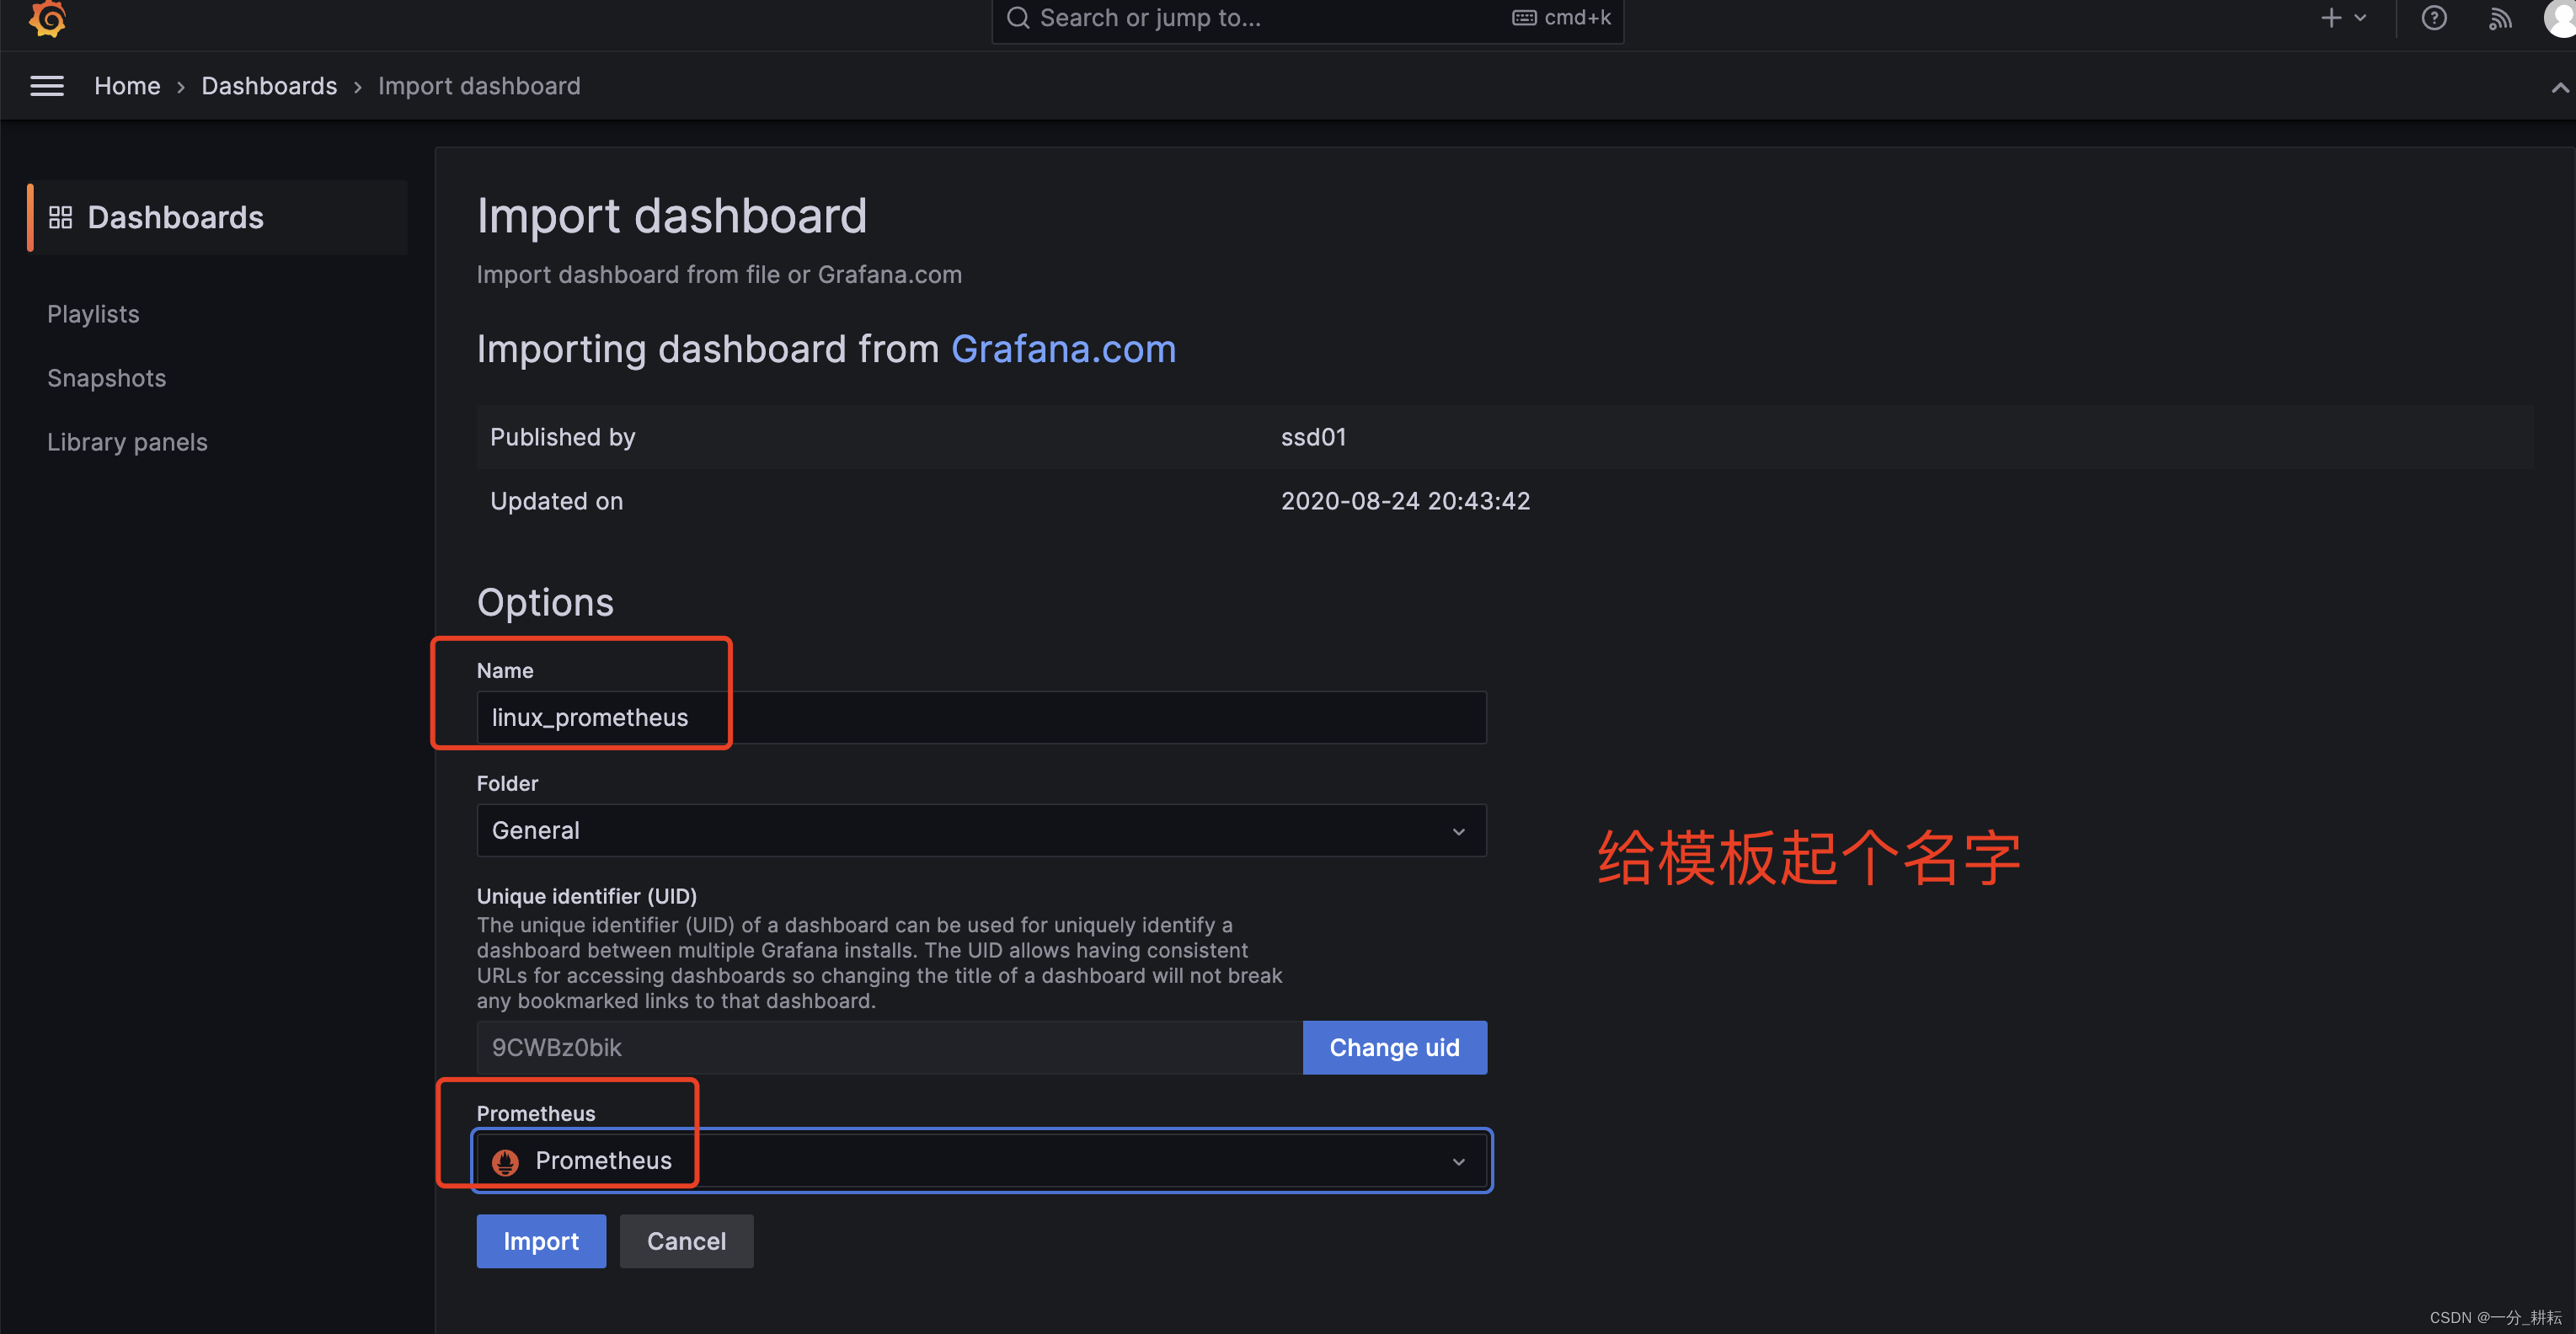
7、添加Prometheus模板
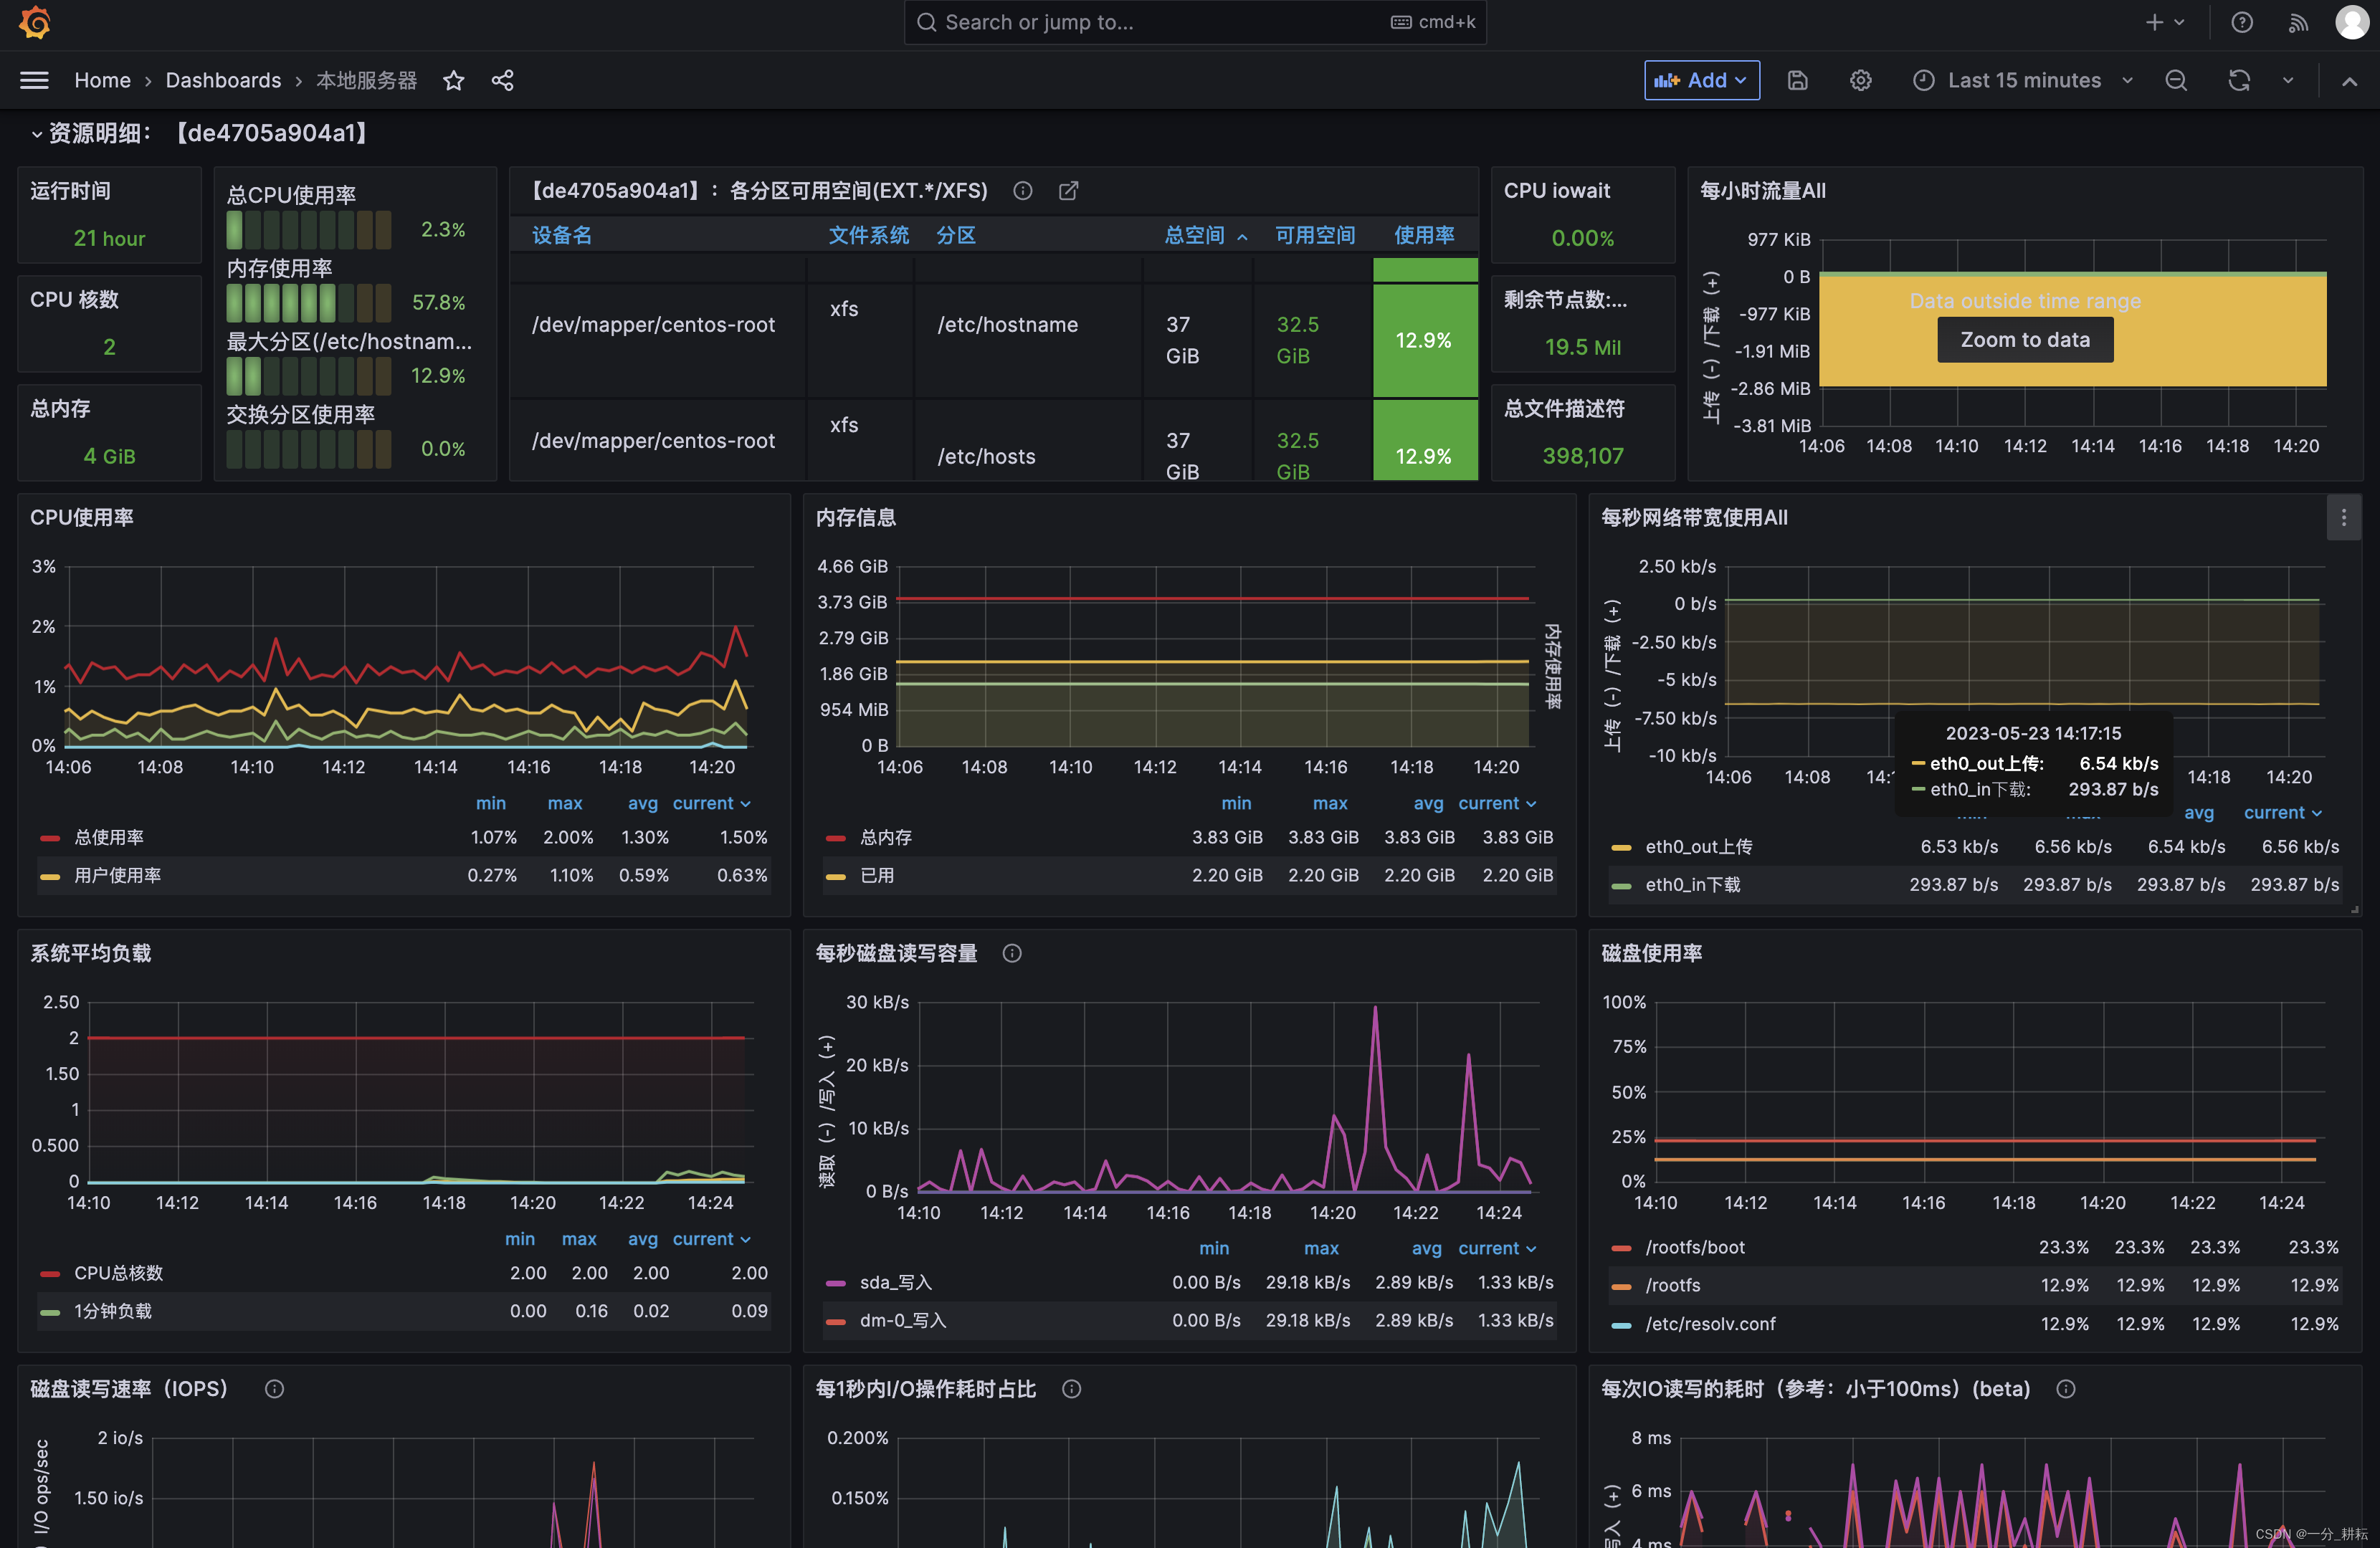
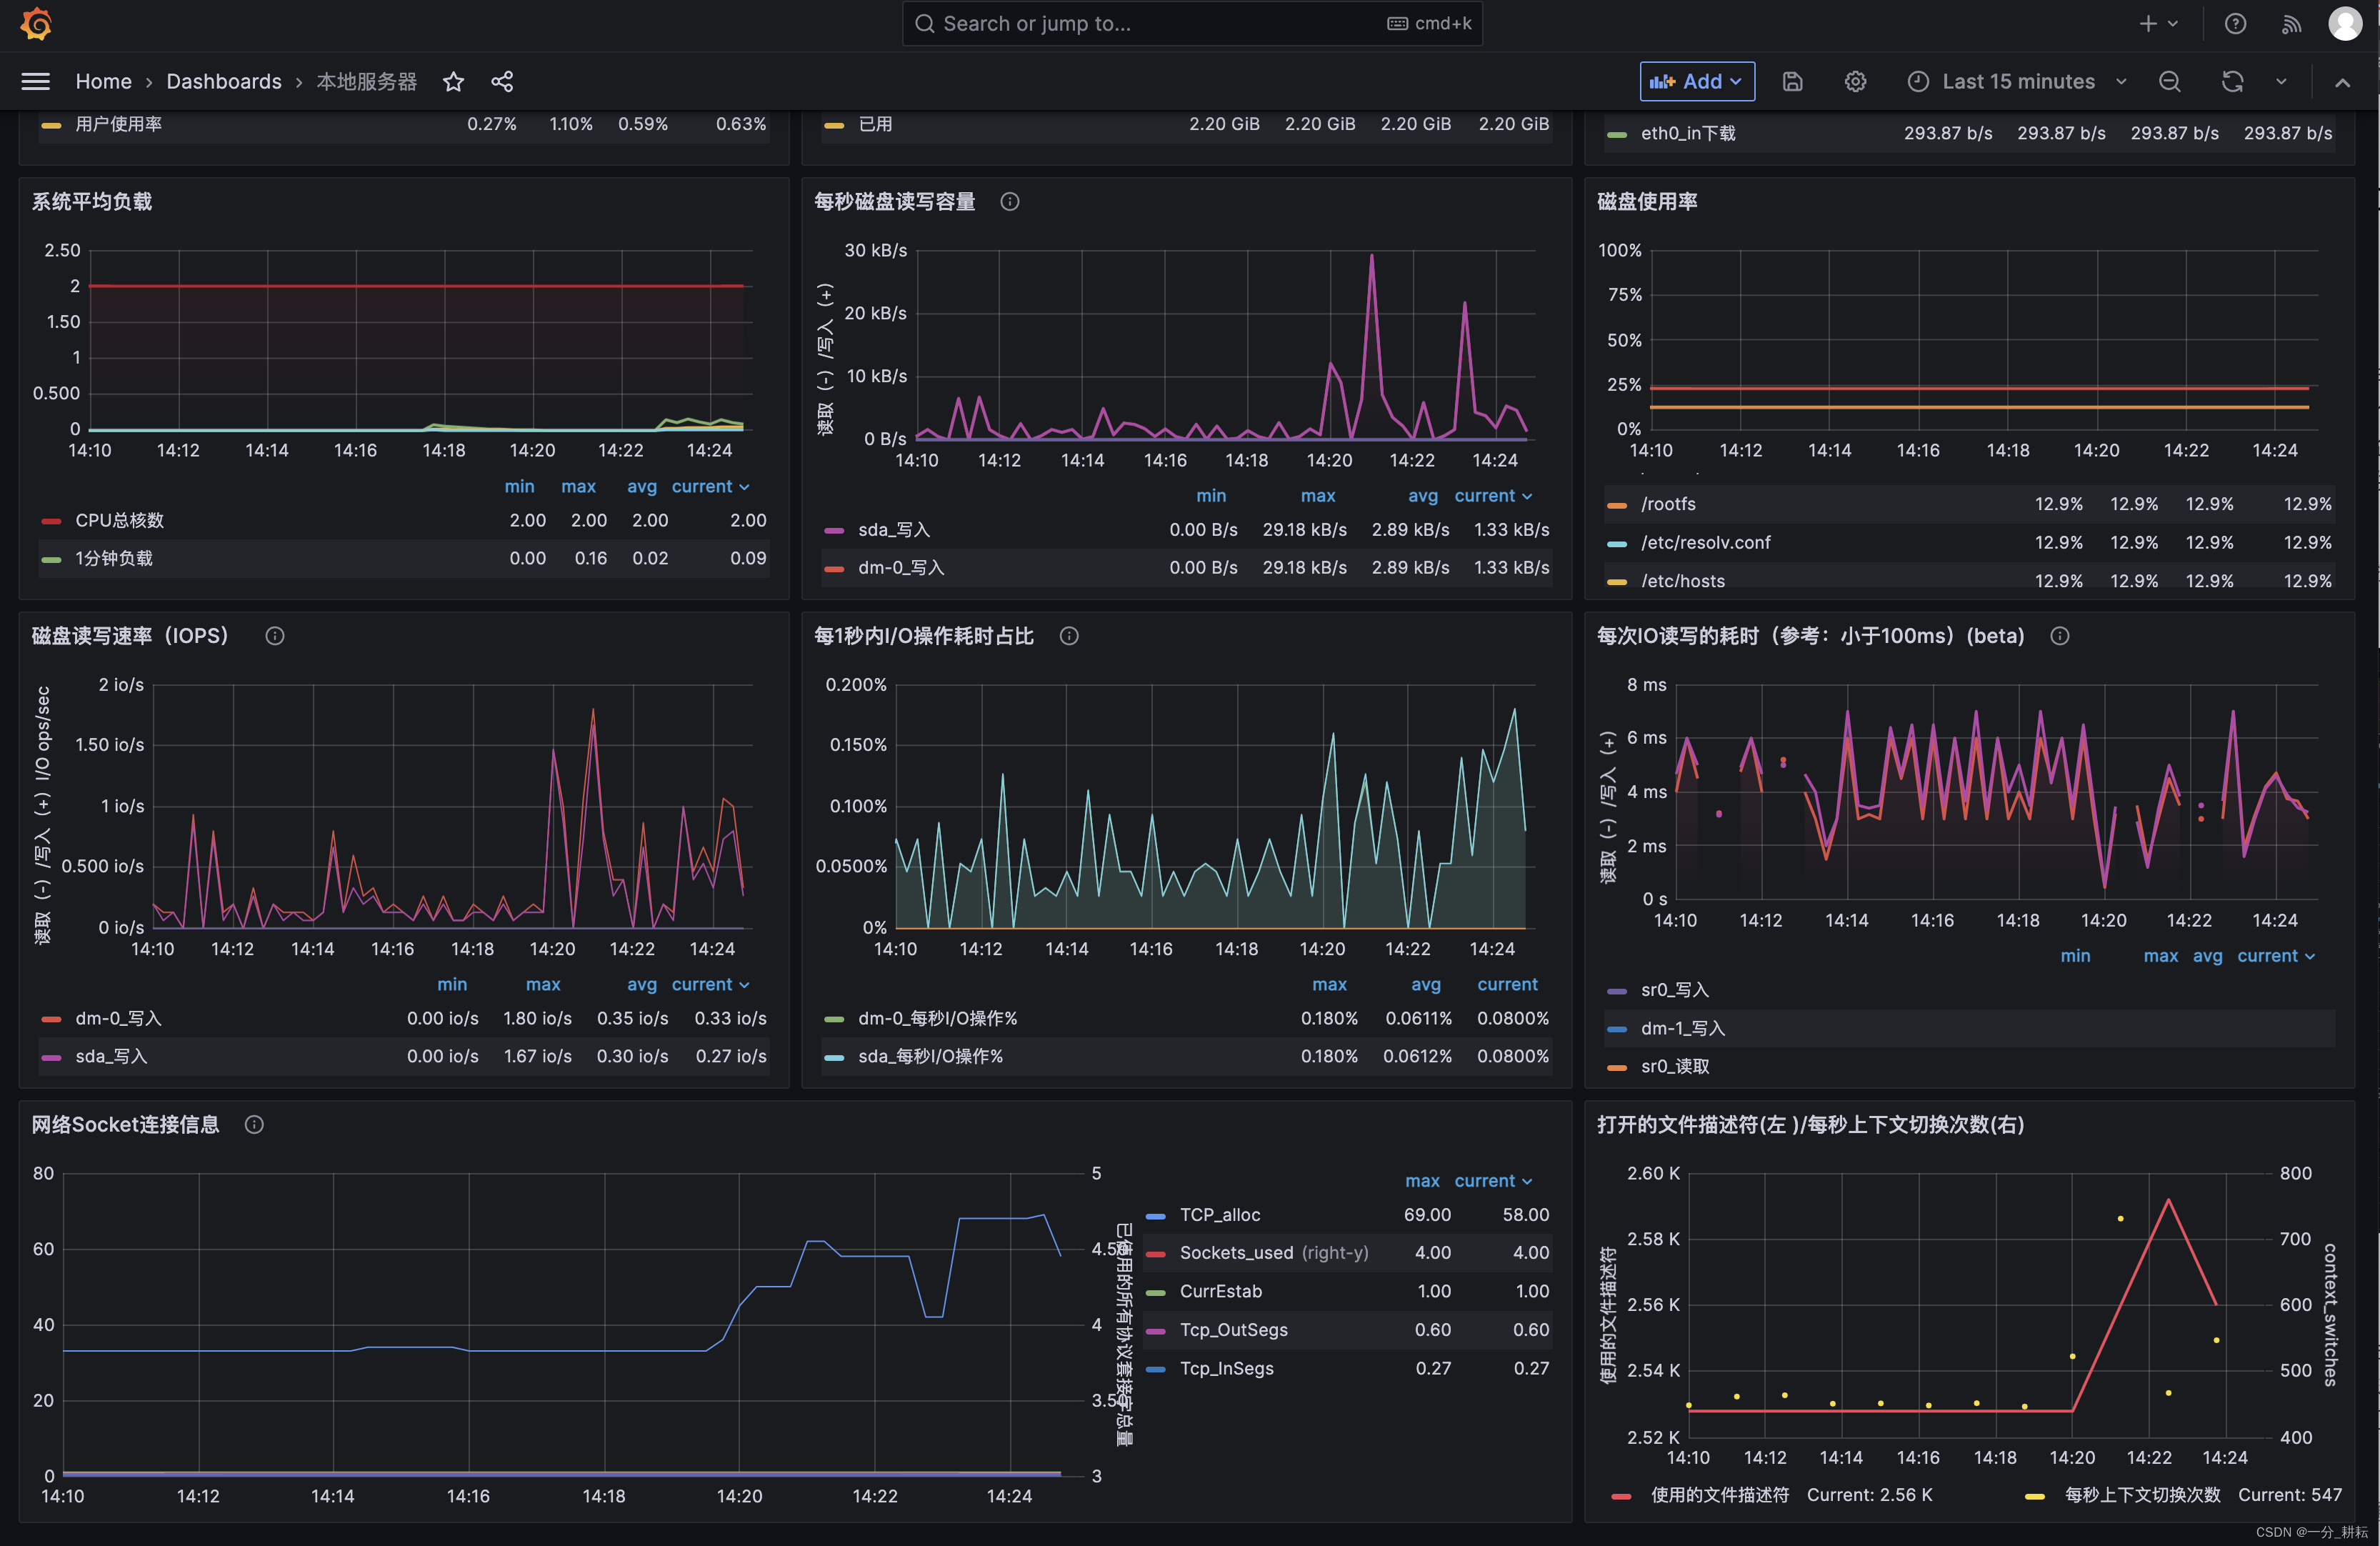
 8、成功展示来由Prometheus数据
关联文章


 7258
7258


 被折叠的 条评论
为什么被折叠?
被折叠的 条评论
为什么被折叠?
 到【灌水乐园】发言


