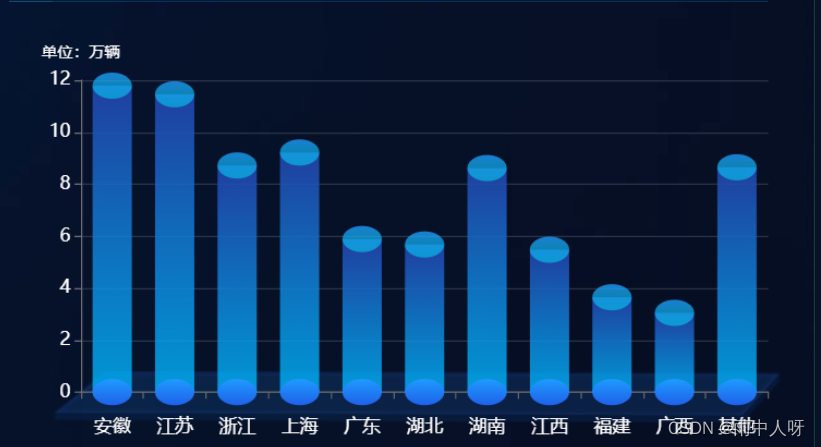
vue中使用echarts记录属性3立体柱形图

环境:vue2 + element-ui

echarts版本:5.4.0

安装:

npm install echarts --save

需要的页面引用:

import * as echarts from 'echarts';

 先上一个效果图(有借鉴copy网上的内容,忘了哪个了)

页面准备容器

<div id="fftjChart"></div>

js部分,我是在父组件中拿到的数据,传递给子组件

<script>
import * as echarts from "echarts";
export default {
// 组件传参,拿到父组件传递的数据
  props: {
    greenTraffic: {
      type: Array,
      default() {
        return [];
      },
    },
  },
  data() {
    return {
      arrX: [],
      arrY: [],
    };
  },
  watch: {
// 侦听父组件的数据,发生变化后处理数据后重新渲染dom
    greenTraffic: {
      handler(val) {
        this.arrX = [];
        this.arrY = [];
        if (Array.isArray(val) && val.length) {
          val.forEach((item) => {
            this.arrX.push(item.trafficKey);
            this.arrY.push((Number(item.trafficValue) / 10000).toFixed(2));
          });
        }
        this.drawFftjChart();
      },
      deep: true,
    },
  },
  mounted() {
    this.drawFftjChart();
  },
  methods: {
    drawFftjChart() {
      let yData = this.arrY;
      var fftjChart = echarts.init(document.getElementById("fftjChart"));
      fftjChart.setOption({
        grid: { // 容器距离
          left: "5%",
          right: "5%",
          // top: "5%",
          bottom: "5%",
          containLabel: true,
        },
        tooltip: {
          trigger: "item",
          formatter: function (parms) {
            return (
              parms.marker + " " + parms.name + ":" + parms.value + "万辆"
            );
          },
        },
        xAxis: {
          type: "category", // category(坐标轴类型)
          data: this.arrX,
          axisTick: {
            // 坐标轴刻度相关配置
            show: true, // 是否显示坐标轴刻度
          },
          axisLine: {
            // 坐标轴轴线相关配置
            lineStyle: {
              // 坐标轴轴线样式
              color: "#666666", // 坐标轴轴线颜色
            },
          },
          axisLabel: {
            // 坐标轴刻度标签相关配置
            color: "#fff",
            fontSize: 14,
            margin: 20,
          },
        },
        yAxis: {
          type: "value", // value(数值轴,适用于连续数据)
          name: "单位:万辆",
          nameTextStyle: {
            color: "#fff",
            fontSize: 12,
          },
          axisTick: {
            // 坐标轴刻度相关配置
            show: true, // 是否显示坐标轴刻度
          },
          axisLine: {
            // 坐标轴轴线相关配置
            show: true, // 是否显示坐标轴轴线
          },
          axisLabel: {
            // 坐标轴刻度标签相关配置
            color: "#fff",
            fontSize: 14,
          },
          splitLine: {
            // 坐标轴在 grid 区域中的分隔线
            lineStyle: {
              // 分割线配置
              color: "rgba(255,255,255,0.15)", // 分割线颜色
            },
          },
        },
        series: [
          // 底部的椭圆形(象形柱图):pictorialBar
          {
            type: "pictorialBar", // pictorialBar(象形柱图)
            label: {
              // 图形上的文本标签,可用于说明图像的一些数据信息,比如值,名称等
              // show: true, //是否显示标签
              position: ["17", "-30"], // 标签的位置(可以是绝对的像素值或者百分比['50%','50%',也可以是top,left等])
              color: "#01E4FF",
              fontSize: 14,
            },
            symbolSize: [30, 20], // 图形的大小用数组分别比表示宽和高,也乐意设置成10相当于[10,10]
            symbolOffset: [0, 10], // 图形相对于原本位置的偏移
            z: 12, // 象形柱状图组件的所有图形的 z 值.控制图形的前后顺序.z 值小的图形会被 z 值大的图形覆盖.
            itemStyle: {
              // 图形样式
              // echarts.graphic.LinearGradient(echarts内置的渐变色生成器)
              // 4个参数用于配置渐变色的起止位置,这4个参数依次对应右 下 左 上
              color: new echarts.graphic.LinearGradient(0, 0, 0, 1, [
                // 这里 offset: 0 1 ,表示从下往上的渐变色
                {
                  offset: 0, // 0%处的颜色
                  color: "rgba(31,155,255,1)",
                },
                {
                  offset: 1, // 100%处的颜色
                  color: "#1F61EA",
                },
              ]),
            },
            data: yData,
          },
          // 中间的长方形柱状图(柱状图):bar
          {
            type: "bar", // 柱状图
            barWidth: 30, // 柱条的宽度,不设时自适应
            barGap: "0%", // 柱子与柱子之间的距离
            itemStyle: {
              // 图形样式
              // color支持(rgb(255,255,255)、rgba(255,255,255,1)、#fff,也支持渐变色和纹理填充)
              // 下面就是使用线性渐变
              color: {
                x: 0,
                y: 0,
                x2: 0,
                y2: 1,
                type: "linear",
                global: false,
                colorStops: [
                  {
                    offset: 0, // 0%处的颜色
                    color: "rgba(34,68,172,0.9)",
                  },
                  {
                    offset: 1, // 100%处的颜色
                    color: "rgba(0,183,255,0.8)",
                  },
                ],
              },
            },
            data: yData,
          },
          // 顶部的椭圆形(象形柱图):pictorialBar
          {
            type: "pictorialBar",
            symbolSize: [30, 20],
            symbolOffset: [0, -10],
            z: 12,
            symbolPosition: "end",
            itemStyle: {
              color: new echarts.graphic.LinearGradient(
                0,
                0,
                0,
                1,
                [
                  {
                    offset: 0,
                    color: "rgba(31,155,255,0.8)",
                  },
                  {
                    offset: 1,
                    color: "rgba(0,229,255,0.5)",
                  },
                ],
                false
              ),
            },
            data: yData,
          },
        ],
      });
      window.addEventListener("resize", () => {
        fftjChart.resize();
      });
    },
  },
};
</script>

下一篇整理,3D饼状图

工作记录,有不足之处还请见谅,还望指出,感谢!

  • 1
    点赞
  • 2
    收藏
    觉得还不错? 一键收藏
  • 0
    评论
### 回答1: 在Vue使用echarts预警变色,可以通过以下步骤实现: 1. 安装echarts ``` npm install echarts --save ``` 2. 在Vue组件引入echarts ``` import echarts from 'echarts' ``` 3. 在Vue组件定义echarts表的配置项和数据 ``` data() { return { chartData: { xAxis: { type: 'category', data: ['Mon', 'Tue', 'Wed', 'Thu', 'Fri', 'Sat', 'Sun'] }, yAxis: { type: 'value' }, series: [{ data: [120, 200, 150, 80, 70, 110, 130], type: 'bar' }] } } } ``` 4. 在Vue组件的mounted钩子函数初始化echarts表,并设置预警变色 ``` mounted() { const chart = echarts.init(this.$refs.chart) chart.setOption(this.chartData) chart.setOption({ series: [{ itemStyle: { normal: { color: function(params) { if (params.data >= 150) { return '#FF5722' } else { return '#2196F3' } } } } }] }) } ``` 以上代码,我们通过设置itemStyle.normal.color属性来设置每个数据项的颜色。在这里,我们设置当数据项的值大于等于150时,颜色为橙色;否则,为蓝色。 5. 在Vue组件的template添加echarts表 ``` <template> <div ref="chart" style="height: 400px;"></div> </template> ``` 通过以上步骤,我们就可以在Vue使用echarts预警变色了。 ### 回答2: 在Vue使用Echarts预警变色的方法如下: 1. 首先,在Vue项目安装echarts插件。可以使用npm或者yarn命令安装,例如:npm install echarts --save 2. 在Vue组件导入echarts并创建一个echarts实例。 3. 在data定义柱的数据和预警的阈值。 4. 在mounted或者created生命周期钩子函数使用echarts的setOption方法设置柱的配置。 5. 在柱的配置,设置柱子的颜色。 6. 在柱的配置,根据预警标准,判断柱子是否需要变色,并设置相应的颜色。 下面是一个简单的示例代码,在Vue组件实现柱的预警变色: <template> <div id="chart"></div> </template> <script> import echarts from 'echarts' export default { data() { return { chartData: [120, 200, 150, 80, 70, 110, 130], // 柱的数据 warningThreshold: 100 // 预警阈值 } }, mounted() { this.renderChart() }, methods: { renderChart() { let chart = echarts.init(document.getElementById('chart')) chart.setOption({ xAxis: { type: 'category', data: ['A', 'B', 'C', 'D', 'E', 'F', 'G'] }, yAxis: { type: 'value' }, series: [ { type: 'bar', data: this.chartData, itemStyle: { normal: { color: function(params) { // 根据预警阈值判断柱子是否需要变色 if (params.value >= this.warningThreshold) { return 'red' } else { return 'blue' } }.bind(this) } } } ] }) } } } </script> 以上代码使用echarts.init方法创建了一个echarts实例,并将其渲染到指定的DOM元素。在配置项的series属性,定义了一系列柱的配置,其的itemStyle属性用于设置柱子的颜色。通过判断柱子的值是否大于等于预警阈值,并返回相应的颜色来实现预警变色的效果。需要注意的是,在itemStyle的color配置项使用了bind方法绑定了this指向,以便在其访问this.warningThreshold。 通过上述步骤,就可以在Vue实现echarts的预警变色功能。 ### 回答3: 在Vue使用echarts预警变色可以通过以下步骤实现: 1. 首先,引入echarts并在Vue组件进行相关配置。可以使用npm安装echarts,并在Vue组件引入echarts: ``` import echarts from 'echarts' ``` 2. 在Vue组件,创建一个DOM元素作为echarts表的容器。可以使用Vue的ref属性来获取该元素的引用,并定义一个变量来保存echarts实例: ``` <template> <div ref="chartContainer"></div> </template> <script> export default { data() { return { chart: null } }, mounted() { this.initChart() }, methods: { initChart() { this.chart = echarts.init(this.$refs.chartContainer) // 省略其他配置 } } } </script> ``` 3. 在echarts的配置选项,通过设置itemStyle来实现预警柱的颜色变化。可以根据需求设置不同的阈值和预警颜色: ``` initChart() { this.chart = echarts.init(this.$refs.chartContainer) const option = { // 省略其他配置 series: [{ type: 'bar', data: [10, 20, 30, 40, 50], itemStyle: { normal: { color: function(params) { // 根据条件判断是否触发预警变色 if (params.value > 30) { return 'red'; // 设置预警颜色为红色 } else { return 'blue'; // 设置其他柱的颜色 } } } } }] } this.chart.setOption(option) } ``` 以上就是在Vue使用echarts预警变色的简单实现方式。根据具体需求,可以根据实际情况调整代码和配置,实现更灵活的柱预警变色效果。

“相关推荐”对你有帮助么?

  • 非常没帮助
  • 没帮助
  • 一般
  • 有帮助
  • 非常有帮助
提交
评论
添加红包

请填写红包祝福语或标题

红包个数最小为10个

红包金额最低5元

当前余额3.43前往充值 >
需支付:10.00
成就一亿技术人!
领取后你会自动成为博主和红包主的粉丝 规则
hope_wisdom
发出的红包
实付
使用余额支付
点击重新获取
扫码支付
钱包余额 0

抵扣说明:

1.余额是钱包充值的虚拟货币,按照1:1的比例进行支付金额的抵扣。
2.余额无法直接购买下载,可以购买VIP、付费专栏及课程。

余额充值