const option4 = computed(() => {
const otherData = shouldPower.value;
const defaultOption = {
grid: {
top: '20%',
left: 0,
},
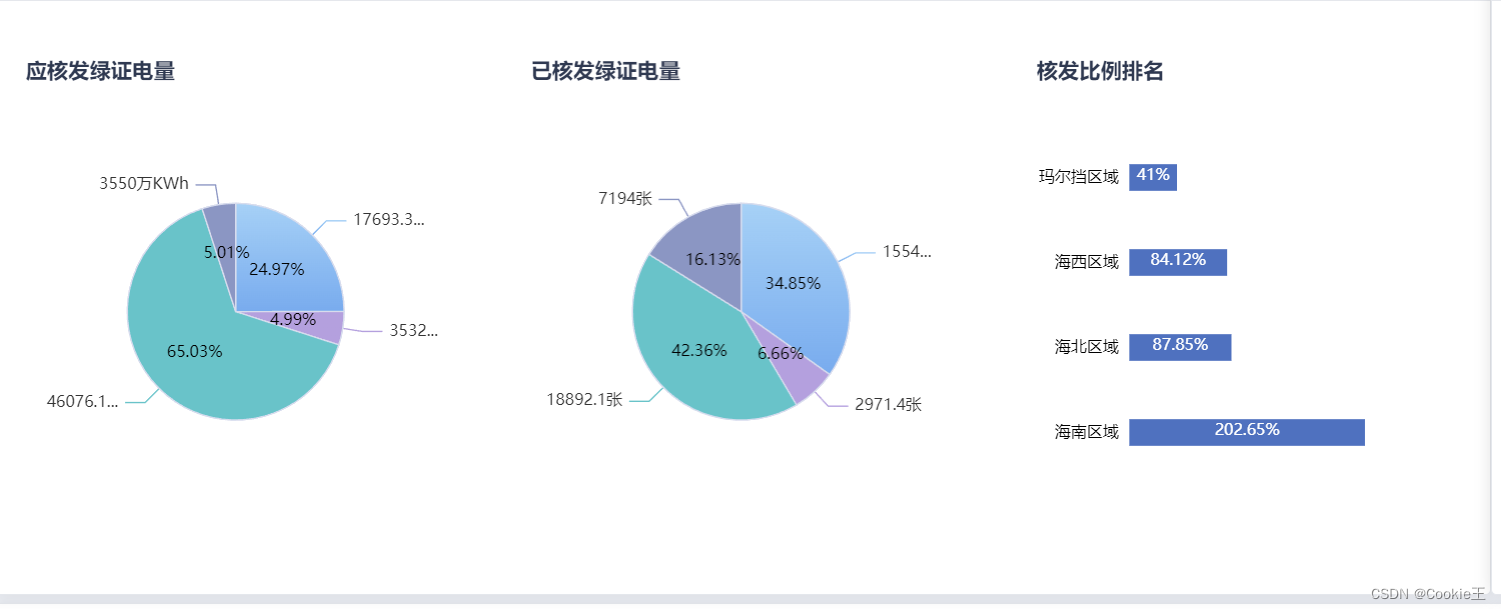
title: {
text: '应核发绿证电量',
left: 'left',
textStyle: {
fontSize: 16, // 设置字体大小为12
},
},
tooltip: {
trigger: 'item',
},
series: [
{
type: 'pie',
radius: '50%',
label: {
show: true,
formatter: '{d}%',
position: 'inside',
color: '#000',
},
data: otherData,
},
{
type: 'pie',
radius: '50%',
label: {
show: true,
formatter: '{c}万KWh',
},
data: otherData,
},
],
};
return defaultOption;
});
const option5 = computed(() => {
const otherData = approvePower.value;
const defaultOption = {
grid: {
top: '20%',
left: 0,
},
title: {
text: '已核发绿证电量',
left: 'left',
textStyle: {
fontSize: 16, // 设置字体大小为12
},
},
tooltip: {
trigger: 'item',
},
series: [
{
type: 'pie',
radius: '50%',
label: {
show: true,
formatter: '{d}%',
position: 'inside',
color: '#000',
},
data: otherData,
},
{
type: 'pie',
radius: '50%',
label: {
show: true,
formatter: '{c}张',
},
data: otherData,
},
],
};
return defaultOption;
});
const option6 = computed(() => {
const defaultOption = {
title: {
text: '核发比例排名',
left: 'left',
textStyle: {
fontSize: 16, // 设置字体大小为12
},
},
grid: {
left: '2%',
containLabel: true,
},
yAxis: {
type: 'category',
data: listname.value,
axisLine: {
lineStyle: {
color: '#000',
},
show: false,
},
axisTick: {
show: false, // 隐藏 Y 轴刻度
},
axisLabel: {
width: '60', // 将内容的宽度固定
color: '#000',
// overflow: 'truncate', // 超出的部分截断
// truncate: '...', // 截断的部分用...代替
},
},
xAxis: {
type: 'value',
axisLine: {
show: false, // 隐藏 X 轴线
},
axisTick: {
show: false, // 隐藏 X 轴刻度
},
splitLine: {
show: false, // 隐藏 X 轴分割线
},
axisLabel: {
show: false, // 隐藏 Y 轴标签
},
},
// grid: {
// bottom: '10%', // 调整底部边距为 10%
// },
series: [
{
data: reatios.value,
type: 'bar',
barWidth: 20,
itemStyle: {
color: '#4472C5', // 设置柱子颜色为蓝色
},
label: {
show: true,
position: 'insideBottom',
align: 'center',
color: '#fff',
formatter: '{c}%',
},
},
],
};
return defaultOption;
});


 1371
1371


 被折叠的 条评论
为什么被折叠?
被折叠的 条评论
为什么被折叠?
 到【灌水乐园】发言


