


For detailed code of this project, you can refer to my repository: GitHub - weixinyu/udacity_starbucks_data_analysisContribute to weixinyu/udacity_starbucks_data_analysis development by creating an account on GitHub. https://github.com/weixinyu/udacity_starbucks_data_analysis
1. Project Definition
1.1 Project Overview
Once every few days, Starbucks sends out an offer to users of the mobile app. An offer can be merely an advertisement for a drink or an actual offer such as a discount or BOGO (buy one get one free). Some users might not receive any offer during certain weeks. Not all users receive the same offer, and that is the challenge to solve with this data set.
The task of this project is to combine transaction, demographic and offer data to predict whether someone will respond to an offer. This data set is a simplified version of the real Starbucks app because the underlying simulator only has one product whereas Starbucks sell dozens of products.
1.2 Description of Input Data
The data is contained in three files:
- portfolio.json - containing offer ids and meta data about each offer (duration, type, etc.)
- profile.json - demographic data for each customer
- transcript.json - records for transactions, offers received, offers viewed, and offers completed
Here is the schema and explanation of each variable in the files:
portfolio.json:
- id (string) - offer id
- offer_type (string) - type of offer ie BOGO, discount, informational
- difficulty (int) - minimum required spend to complete an offer
- reward (int) - reward given for completing an offer
- duration (int) - time for offer to be open, in days
- channels (list of strings)
profile.json:
- age (int) - age of the customer
- became_member_on (int) - date when customer created an app account
- gender (str) - gender of the customer (note some entries contain 'O' for other rather than M or F)
- id (str) - customer id
- income (float) - customer's income
transcript.json:
- event (str) - record description (ie transaction, offer received, offer viewed, etc.)
- person (str) - customer id
- time (int) - time in hours since start of test. The data begins at time t=0
- value - (dict of strings) - either an offer id or transaction amount depending on the record
1.3 Strategy for solving the problem
This project is to build a model that can predict whether someone will respond to an offer or not? The following strategy will be followed:
- First, this project will assess and clean the data, then split the data into training and testing set.
- Second, calculate the baseline scores with a model predicting true for all data.
- Third, this project will try to train the three classifiers on the training data(1%, 10% and 100%): Decision Tree Classifier, Random Forest Classifier and AdaBoost Classifier. Then verify them on the testing data and find the best model.
- Forth, tune the hyperparameters of the best model and keep the best parameters.
1.4 Metrics with justification
This project will use the accuracy and F1 score as the metrics for binary classification problem, because accuracy is the direct metric that shows how well a model classifies correctly, and F1 score is a balanced metric considering both the precision and recall, which is very helpful when the data is not balanced.
2. Analysis
2.1 EDA
Firstly, the info and first few lines are printed to get a general view of the data.
Portfolio data:
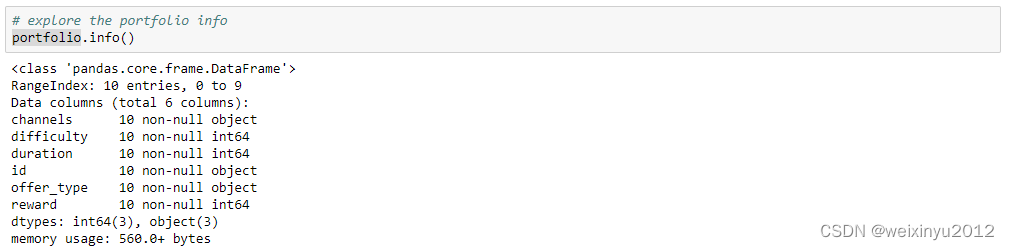
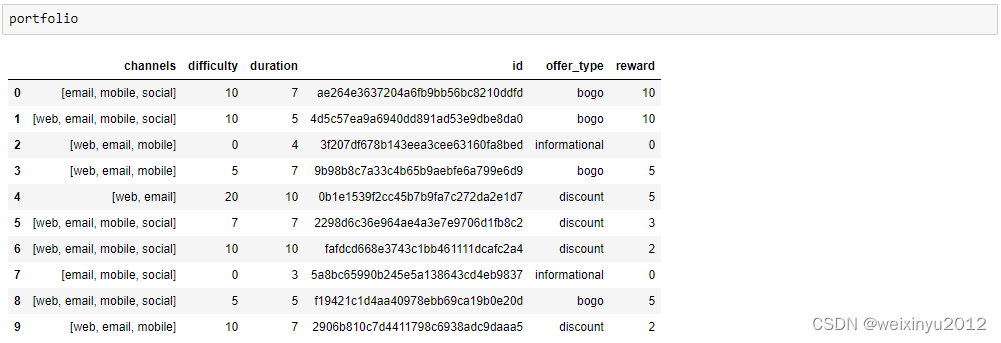
From the general view of offer portfolio data, we can need the following cleaning steps:
- One hot encode channels column
- One hot encode offer_type column
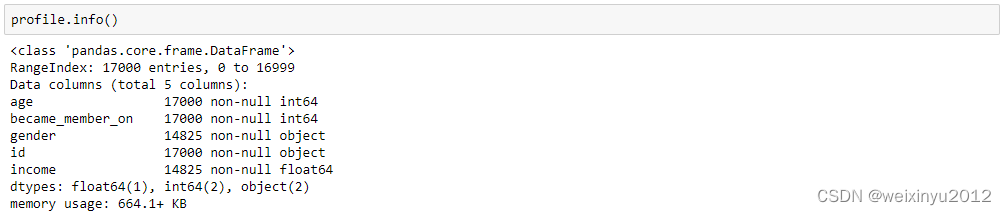
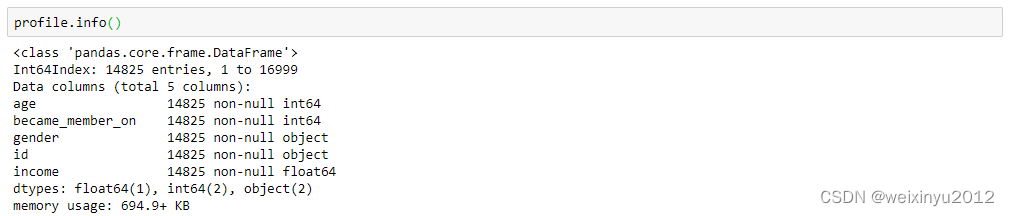
Profile data:

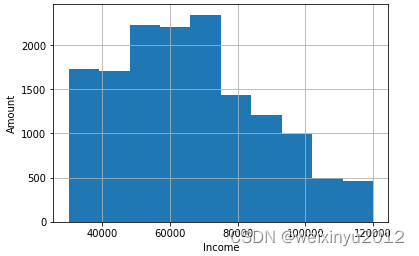
The histogram of income column is:
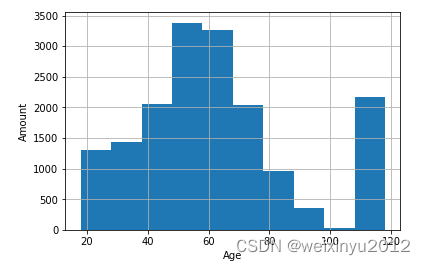
From the general view of profile data, we can need the following cleaning steps:
- Deal with the NAN value in gender and income column
- Deal with 2175 abnormal data with age 118
- One hot encode gender column
- Extract year that the customer became a member
- One hot encode the year that the customer became a member
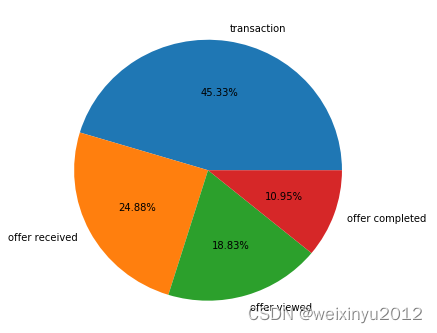
Transcript data:
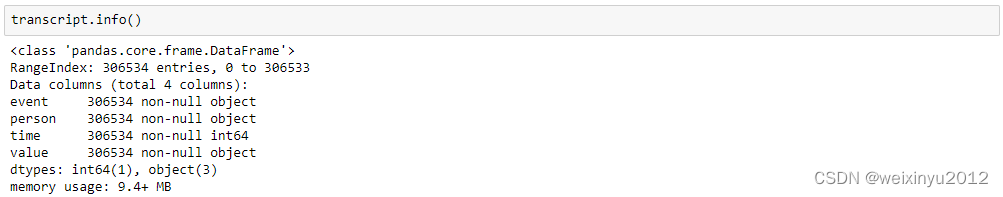
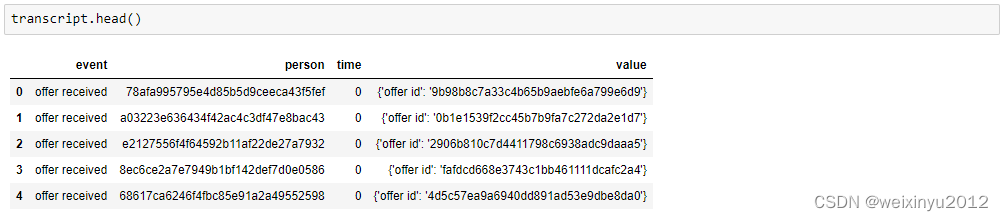
We can only see one event in the first few lines, so we print statistics of events:
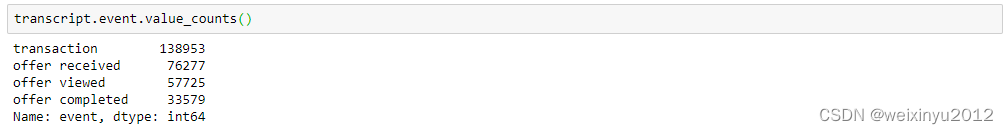
There are four events listed here, so we will further explore them:
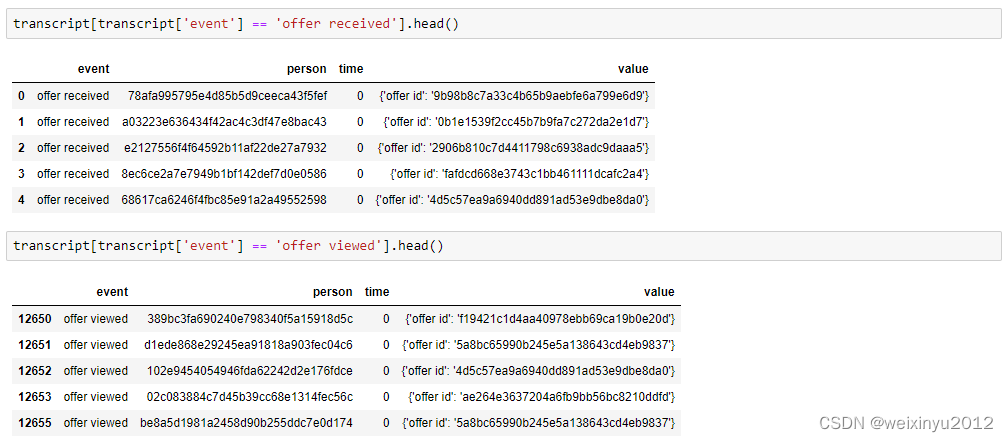

We can find that different columns of different event are empty and should be removed.
Then we explore the transcripts of one specific customer:
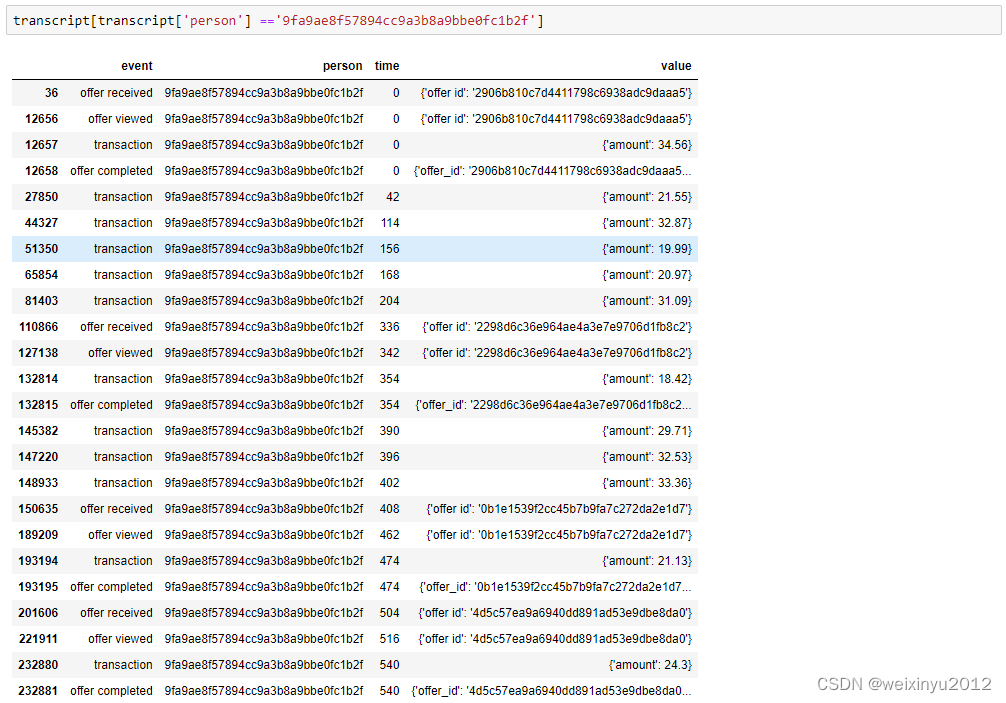
From this example, we can summarize the actions of a valid response to the offer:
1. Receive a offer;
2. View the offer in the valid duration;
3. Complete the offer in the valid duration;
So we will use this process to give labels to whether someone responds to a offer or not.
Almost half of the data are transactions and they are not important to our analysis, so we need to split the data.
From the general view of transcript data, we can need the following cleaning steps:
- Extract values from dict in the value column
- Split the transcript by events
- Turn time column into days. The duration in portfolio is in days, and the time for each transcript is in hours, we need to make them in the same units.
- Drop the transcripts without customer profile data.
3. Methodology
3.1 Data Preprocessing
3.1.1 Clean portfolio data
The following steps are needed for the portfolio data cleaning:
- One hot encode channels column
- Transform channel columns from list to string
- One hot encode with get_dummies and drop the original column
- One hot encode offer_type column
- One hot encode with get_dummies and drop the original column
3.1.2 Clean profile data
The following steps are needed for the profile data cleaning:
- Deal with the NAN value in gender and income column
- Investigate on the statistics of NAN and find gender and income are always NAN at the same time, and these are important features for a customer. So we decide to remove these 2175 items
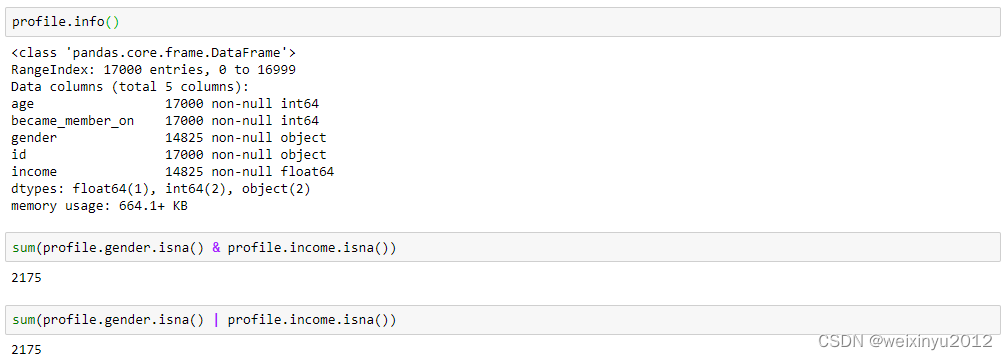
- Deal with 2175 abnormal data with age 118
- This issue is also resolved by previous action
- Extract year that the customer became a member
- Transform the became_member_on column to a datetime object
- Extract year from it
- One hot encode the year that the customer became a member
- One hot encode with get_dummies and drop the original column
- One hot encode gender column
- One hot encode with get_dummies and drop the original column
3.1.3 Clean transcript data
The following steps are needed for the transcript data cleaning:
- Extract values from dict in the value column
- Extract offer id and reward from transcript
- Combine the offer_id and offer id
- Drop the transcripts without customer profile data
- Filter out the transcripts with customer info
- Turn time column into days
- Turn hours into days and drop the original column
- Split the transcript by events
- Filter out offer received transcript and drop empty column
- Filter out offer viewed transcript and drop empty column
- Filter out offer completed transcript and drop empty column
3.1.4 Integrate data
Then we can integrate all these dataframes and add one column ‘respond’ according to what we defined in the previous section:
- Receive a offer;
- View the offer in the valid duration;
- Complete the offer in the valid duration;
3.1.5 Feature engineering
First, we drop the columns that are not important to our problem, so we remove the offer_id, person, days columns.
Then we perform MinMax scaling on numerical features and normalization ensures that each feature is treated equally.
3.2 Modeling
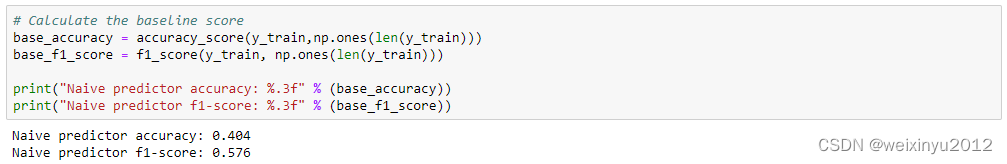
Here we choose to use a model that always respond to an offer as the control group, and compare with the accuracy and F-score of it as the baseline:
Then we try three classification models on our dataset. Here we choose Decision Tree, Random Forest, and AdaBoost because they all have their own advantages:
- Decision Tree is easy to build model, explain the rules, and visualize the results. With the decision tree, It is easy to explain the logic and our dataset is not complicated.
- Random forest can classify data with huge amount of features without dimension reduction. It can help justify the importance of features.
- Adaboost is a classifier with high precision. It is easy to understand the model and not easy to overfit.
We will train these three models on 1% 10% and 100% of the training data, and then verify the performance on training and testing dataset with accuracy and f1 score. The training time is also recorded for reference. Here I use some template and demo code from the Introduction to Machine Learning of Pytorch Program.
3.3 Hyperparameter Tuning
From the plot and result above, we can find that all three models work better than the baseline. Among them three, when adaboost classifier on the whole training set, both the accuracy(0.70) and f1 scores(0.69) of the test result are the best. So we will choose the adaboost classifier for the next section.
In this section, we will tune the hyperparameters of adaboost classifier with grid search (`GridSearchCV`), tunning on three parameters:
learning_rate: 1, 0.1, 0.01
n_estimators: 50, 100, 150, 200, 250, 300
algorithm:'SAMME', 'SAMME.R'.
3.4 Result
The following result is got from the hyperparameter tuning:
And the parameters of the best model is:

-
3.5 Comparison Table
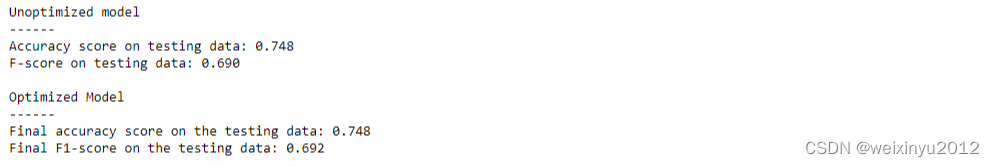
- The following table compare the parameters-tuned model with the baseline and unoptimized model:

From the table, we can find:
- The optimized model's accuracy and F-score on the testing data are: 0.748 and 0.692.
- The F1 score is a little better than the unoptimized model and both F1 score and accuracy are far better than the baseline scores.
4. Conclusion
4.1 Reflection
To predict whether someone will respond to an offer or not, we follow four steps to complete it:
- First, assess and clean the data, then split the data into training and testing set.
- Second, calculate the baseline scores with a model predicting true for all data, and get accuracy 0.404 and f1 score 0.576.
- Third, try to train the three classifiers on the training data(1%, 10% and 100%): Decision Tree Classifier, Random Forest Classifier and AdaBoost Classifier. Then verify them on the testing data and find out that the adaboost classifier is the best model.
- Forth, tune 3 hyperparameters of the adaboost classifier and compare the scores with unoptimized model and baseline.
Then we use the feature_importances_ attribute to rank the importance of each feature:
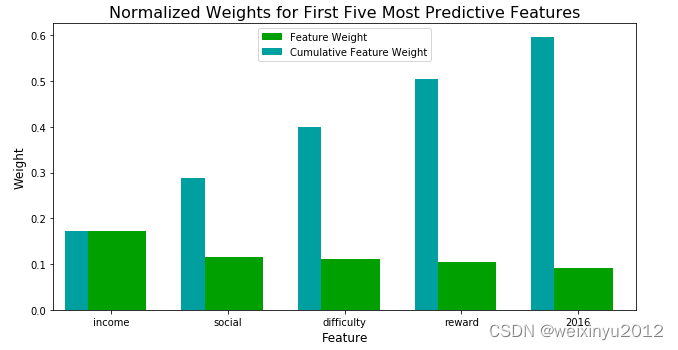
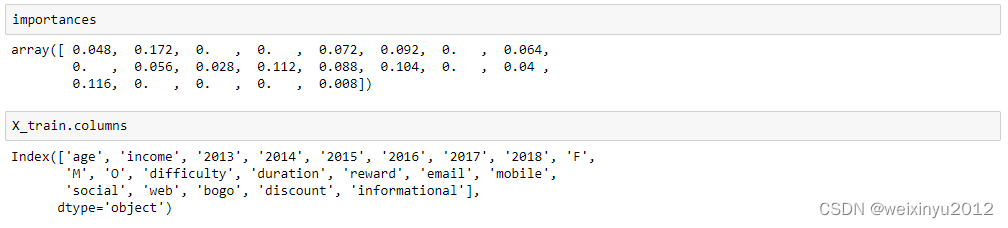
From the above plot and statistics, we can illustrate that the income is the most important feature for predicting whether someone will respond to an offer or not.
Then all the second, third, forth are the properties of offer.
It's quite interesting that Age and Gender are not important features for this prediction.
4.2 Improvement
From the above section, we can find that several features contribute nearly no importance to the prediction, we can remove them.I suppose the potential solution result scores may be a little worse than the current model, but not too much. This can greatly reduce the training time.
Other classification models such as GradientBoostingClassifier, SGDClassifier, KNeighborsClassifier can also be tried on this data set. The result may be a little higher or lower than the current model, but not too much.
4.3 Acknowledgement
My thanks would go to the Udacity Platform and mentors, because I have benifited the knowledge from Udacity programs Data Scientist and Intro to Machine Learning with Pytorch and use some demo codes from them. My thanks also goes to mentors, who give me valuable advice during my learning journey.
References:
[1]1. Supervised learning — scikit-learn 1.2.1 documentation
[2]机器学习---sklearn_愿做春风的博客-CSDN博客_sklearn
[3]python - datetime to string with series in pandas - Stack Overflow
[4]sklearn.metrics.f1_score — scikit-learn 1.2.1 documentation
[5]https://learn.udacity.com/nanodegrees/nd229/parts/cd0025/lessons/
[6]sklearn.grid_search.GridSearchCV — scikit-learn 0.17.1 documentation
[7]sklearn.metrics.make_scorer — scikit-learn 1.2.1 documentation
[8]sklearn.ensemble.AdaBoostClassifier — scikit-learn 1.3.dev0 documentation
[9]sklearn.ensemble.AdaBoostClassifier — scikit-learn 1.3.dev0 documentation


 被折叠的 条评论
为什么被折叠?
被折叠的 条评论
为什么被折叠?
 到【灌水乐园】发言


