


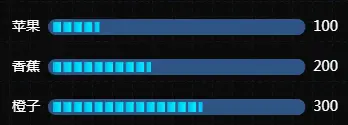
效果:
代码:
<template>

    <div class="chart" id="chart"></div>

</template>

<script>
	import * as echarts from 'echarts';
    export default {

        name : "Bar",

        data() {

            return {

            };

        },

        mounted() {

            this.bar();

        },

        methods: {

            bar() {

                this.myChart = this.$echarts.init(document.getElementById("chart"));

                var data = [100, 200, 300];

                var titlename = ["苹果", "香蕉", "橙子"];

                var option = {

                    backgroundColor:"#17326b",//如果设置图片背景,在外层div设置css样式

                    grid: {

                        left: "10",

                        top: "10",

                        right: "0",

                        bottom: "10",

                        containLabel: true,

                    },

                    xAxis: {

                        type: "value",

                        splitLine: { show: false },

                        axisLabel: { show: false },

                        axisTick: { show: false },

                        axisLine: { show: false },

                    },

                    yAxis: [

                        {

                            type: "category",

                            axisTick: { show: false },

                            axisLine: { show: false },

                            axisLabel: {

                                color: "black",

                                fontSize: 12,

                                textStyle: {

                                    color: "#fff",

                                },

                            },

                            data: titlename,

                            // max:10, 设置y刻度最大值,相当于设置总体行高

                            inverse: true,//横向进度条的关键

                        },

                        {

                            type: "category",

                            axisTick: { show: false },

                            axisLine: { show: false },

                            axisLabel: {

                                color: "black",

                                fontSize: 12,

                                textStyle: {

                                    color: "#fff",

                                },

                            },

                            data: data,

                            // max:10,

                            inverse: true,

                        },

                    ],

                    series: [

                        {

                            name: "条",

                            type: "pictorialBar",

                            symbolRepeat: "fixed",

                            symbolMargin: 1,

                            symbol: "rect",//内部类型(方块,圆,svg,base64图片)

                            symbolClip: true,

                            symbolSize: [6, 8],//进度条的宽高

                            symbolOffset: [5,0],//柱子的位置偏移

                            data: data,

                            z: 2,

                            // barCategoryGap:0,

                            itemStyle: {

                                normal: {

                                    barBorderRadius: 7,

                                    //柱体的颜色

                                    //右,下,左,上(1,0,0,0)表示从正右开始向左渐变

                                    color: function (params) {

                                        //  console.log(params);

                                        var colorList = [

                                            ["#02f0fe", "#02B8EC"],

                                            ["#02f0fe", "#02B8EC"],

                                            ["#02f0fe", "#02B8EC"],

                                            ["#02f0fe", "#02B8EC"],

                                            ["#02f0fe", "#02B8EC"],

                                        ];

                                        var colorItem = colorList[params.dataIndex];

                                        return new that.$echarts.graphic.LinearGradient(

                                            1,

                                            0,

                                            0,

                                            0,

                                            [

                                                {

                                                    offset: 0,

                                                    color: colorItem[0],

                                                },

                                                {

                                                    offset: 1,

                                                    color: colorItem[1],

                                                },

                                            ],

                                            false

                                        );

                                    },

                                },

                            },

                            zlevel: 1,

                        },

                        {

                            name: "进度条背景",

                            type: "bar",

                            barGap: "-100%",

                            barWidth:16,

                            symbolOffset: [5, 0],//柱子的位置

                            data: [100, 100, 100],

                            color: "#2e5384",

                            itemStyle: {

                                normal: {

                                    barBorderRadius:4,

                                },

                            },

                        },

                    ],

                };

                this.myChart.setOption(option);

                //尺寸自适应

                window.addEventListener("resize", () => { this.myChart.resize();});

            },

        }

</script>

<style>

    .panel {

        height: 340px;

        background: rgba(255, 255, 255, 0.04);

        padding: 10px;

    }

</style>


 1843
1843


 被折叠的 条评论
为什么被折叠?
被折叠的 条评论
为什么被折叠?
 到【灌水乐园】发言


