


初学线性回归,在网上搜索了一圈没找到一个满意的可视化图像,决定自己手写一个。
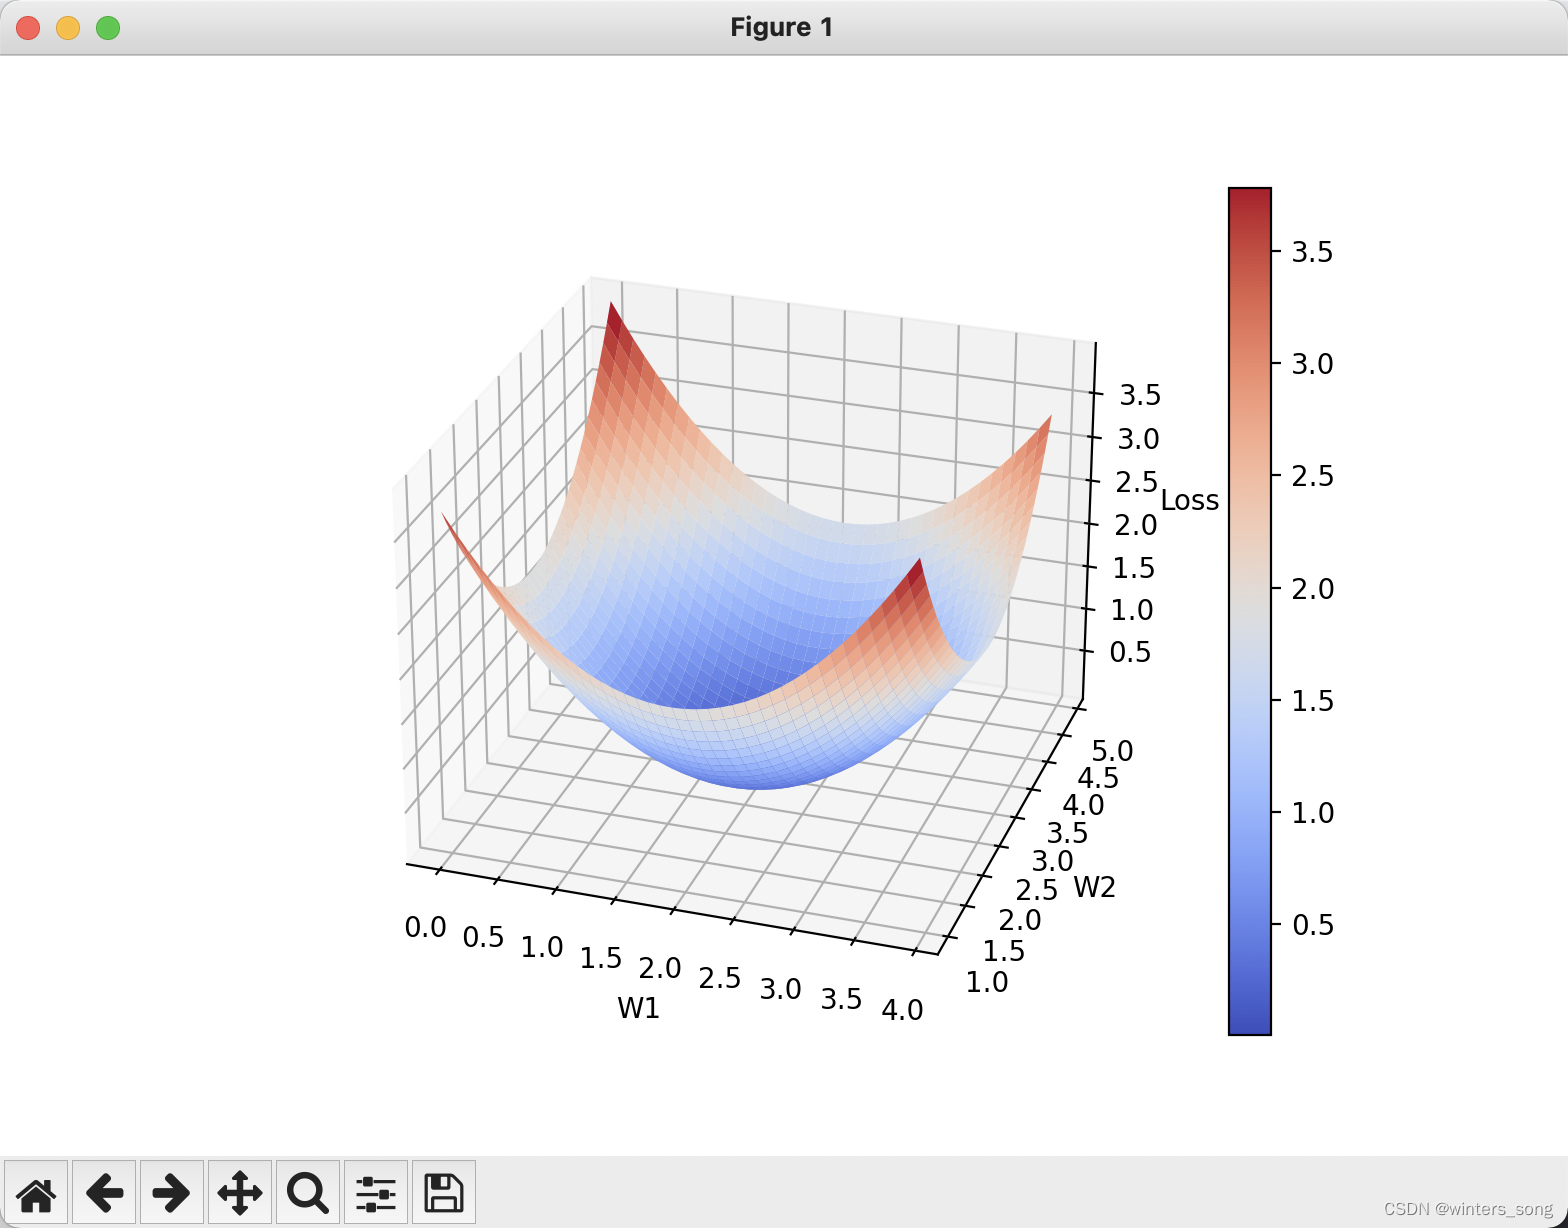
数学模型: y = W1 * x1 + W2 * x2 + b
损失函数:均方误差
真实结果:y = 2 * x1 + 3 * x2 + 4.2
目标:绘制 W1和W2取不同值时的损失函数图像
import torch
import matplotlib.pyplot as plt


def synthetic_data(w, b, num_examples):  # @save
    """生成y=Xw+b+噪声  : 期望,标准差,size(样本量,权重数)"""
    X = torch.normal(0, 1, (num_examples, len(w)))
    y = torch.matmul(X, w) + b
    y += torch.normal(0, 0.01, y.shape)
    return X, y.reshape((-1, 1))


def linreg(X, w, b):
    """线性回归模型"""
    return torch.matmul(X, w) + b


def squared_loss(y_hat, y):  #@save
    """均方损失"""
    return (y_hat - y
最低0.47元/天 解锁文章


 被折叠的 条评论
为什么被折叠?
被折叠的 条评论
为什么被折叠?
 到【灌水乐园】发言


