


- excel基础了解
2007版本的Excel软件默认使用xlsx格式,2003版本默认使用xls格式。
xls格式文件使用了一种具有特定规律的二进制格式,其核心结构是Excel特有的复合文档类型结构。
xlsx文件与之不同,它的核心结构式XML数据集结构,相比于xls,xlsx结构更加清晰,相同数据占用空间更小。
xlrd读取Excel文件数据
xlrd读取Excel数据
import xlrd
book = xlrd.open_workbook('data/people.xls')
xlrd读取工作表数据
xlrd读取数据表第一个sheet方式
sheet = book.sheets()[0]
print(sheet)
Sheet 0:<Sheet1>
sheet = book.sheet_by_index(0) # 读取工作表时,通过下标读取
print(sheet)
Sheet 0:<Sheet1>
sheet = book.sheet_by_name('Sheet1') # 读取工作表时,通过表名读取
print(sheet)
Sheet 0:<Sheet1>
xlrd读取数据表sheet列表
sheets = book.sheets()
print(sheets)
[Sheet 0:<Sheet1>, Sheet 1:<Sheet2>, Sheet 2:<Sheet3>]
xlrd读取单元格数据
- 方法
sheet.cell(row,col)
row 行

col 列

row 与 col下标都是从0开始
sheet.cell(0,1)text:'city'
sheet.cell(1,0)text:'张三'
xlwt将数据写入Excel文件
step1 创建xls文件对象
import xlwt
book = xlwt.Workbook()
step2 新建工作表
sheet = book.add_sheet('Sheet1')step3 写入数据
sheet.write(0,0,'二两')step4 保存为xls文件
book.save('data/people2.xls')xlutils复制Excel
场景:
excel文件的工作表中本来就存在数据,追加数据
xlutils的copy方法可以将xlrd所属对象转为xlwt所属对象,从而实现直接修改工作表中已有数据。
使用copy方法直接复制
import xlrd
from xlutils.copy import copy
rd_book = xlrd.open_workbook('data/people.xls')

# 拷贝Book对象为Workbook对象
wt_book = copy(rd_book)
wt_sheet = wt_book.get_sheet(0)
wt_sheet.write(1,0,'修改内容')

# 另存为或覆盖
wt_book.save('data/people.xls')
使用openpyxl支持xlsx格式文件
- 场景
xlwt只支持生成xls格式的Excel,无法将数据写入xlsx格式的excel文件中。
import openpyxl
# 创建工作簿对象
wb = openpyxl.Workbook()
# sheet工作簿对象
ws = wb.active
# 使用create_sheet()来创建一个新的worksheet
# 1表示所在的顺序
ws2 = wb.create_sheet('NewTitle',1)
# 第一行第一列
ws2.cell(row=1,column=1,value='First')
# 修改Title
wb.save('data/openpyxl_test.xlsx')
注意: 与xlrd、xlwt不同,openpyxl的下标是从1开始的
使用openpyxl读取数据
使用openpyxl读入数据并进行修改
import openpyxl
# 打开已有的xlsx文件
wb = openpyxl.load_workbook('data/openpyxl_test.xlsx')
# 返回该Excel文件所有的sheet
print(wb.sheetnames)
ws = wb['NewTitle']
# 改变标签栏颜色
ws.sheet_properties.tabColor = '99CCCC'
ws.cell(row=1,column=1,value='new first')
wb.save('data/openpyxl_test2.xlsx') # 另存为
wb.save('data/openpyxl_test.xlsx') # 覆盖保存
['Sheet', 'NewTitle']
字母列号与数字列号之间的转换
from openpyxl.utils import get_column_letter, column_index_from_string

# 根据列的数字返回字母
print(get_column_letter(2))  # B
# 根据字母返回列的数字
print(column_index_from_string('D'))  # 4
B
4
openpyxl修改工作表中的样式
import openpyxl
from openpyxl.styles import Font,colors,Alignment
# 创建Excel文件对象
wb = openpyxl.Workbook()
ws = wb.active
rows = [
    ['ID','name','age'],
    [1,'张三',28],
    [2,'李四',25],
    [3,'王五',40],
    [4,'赵六',23],
]

for row in rows:
    # 添加多行
    ws.append(row)
# 设置字体
font = Font(name='微软雅黑',size=25,italic=True,color=colors.BLACK,bold=True)
ws['A1'].font = font

ws['A1'].font = font
# 第5行行高,下标从1开始
ws.row_dimensions[5].height = 40
# A列列宽
ws.column_dimensions['A'].width = 30
# 合并单元格,在左上角写入数据即可
# 合并一行中的几个单元格
ws.merge_cells('A7:C7')
# 合并一个矩形区域中的单元格
ws.merge_cells('A9:C13')
ws['A9'] = '合并单元格'
wb.save('data/openpyxl_test3.xlsx')
使用openpyxl读取大批量数据
当我们处理特别大的Excel时,就需要使用openpyxl的只读(read_only)或只写(write_only),在只读或者只写模式下,openpyxl可以使用恒定内存来处理无限的数据,其原理就是先处理一部分,处理完成后,释放其内存,然后再读入部分数据进行处理
openpyxl读取具有100万条数据的Excel
from openpyxl import load_workbook
# read_only 设置为True
wb = load_workbook(filename = 'data/openpyxl_big.xlsx',read_only = True)
ws = wb['big_sheet']

for row in ws.rows:
    for cell in row:
        print(cell.value)
name
city
company
修改内容
北京
华胜
李四
上海
贝尔
王五
长沙
阿里
麻子
深圳
华为
**注意:**设置read_only为True,则开启只读模式
如何将100万条数据写入Excel
from openpyxl import Workbook
from openpyxl.cell import WriteOnlyCell
from openpyxl.comments import Comment
from openpyxl.styles import Font

# write_only 设置为True
wb = Workbook(write_only=True) # 设置write_only为True,则开启只写模式
ws = wb.create_sheet() # 只写模式下,不会包含任何工作表,要使用create_sheet()方法创建

cell = WriteOnlyCell(ws,value='只写状态下写入的内容')
cell.font = Font(name='微软雅黑',size = 36)
# 插入Excel批注
cell.comment = Comment(text='这是一个批注',author='二两') # 只写状态下,单元格想要具有样式或注释,请使用openpyxl.cell.WriteOnlyCell()
# 在只写工作簿中,只能使用append()
ws.append([cell,3.14,None]) # 只写模式下,只能使用append()不能在任意位置使用cell()或iter_rows()
wb.save('data/openpyxl_write_only_file.xlsx')
实战 - 使用 python 与 Excel 实现日历
解析:
插入文字并修改样式
为每个月建立一个sheet,然后将每个月的日期填入其中,这种重复性的操作必然要使用for或while
设置Excel底色
向Excel中插入图片
步骤:
1、 获得每月的日期并填入Excel中
2、修改单元格样式
3、修改部分Excel背景填充色
4、插入图片
使用calendar来获取日期
使用calender,calender是python中专门用于处理日历逻辑的内置库,使用非常方便
import calendar
calendar.monthcalendar(2023,10)
[[0, 0, 0, 0, 0, 0, 1],
[2, 3, 4, 5, 6, 7, 8],
[9, 10, 11, 12, 13, 14, 15],
[16, 17, 18, 19, 20, 21, 22],
[23, 24, 25, 26, 27, 28, 29],
[30, 31, 0, 0, 0, 0, 0]]
三层for迭代完成日期获取与填充
# 一周的第一天,6表示星期日为一周的第一天,0表示星期一
calendar.setfirstweekday(firstweekday=6)

wb = openpyxl.Workbook()

for i in range(1,13): # 第一层迭代,遍历月份
    # 添加工作簿
    sheet = wb.create_sheet(index = 0 ,title = str(i) + '月')

    # 获取具体日期时间
    for j in range(len(calendar.monthcalendar(2023,i))): # 第二层迭代遍历周
        for k in range(len(calendar.monthcalendar(2023,i)[j])): # 第三层迭代遍历天,从而获得最终的日期
            value = calendar.monthcalendar(2023,i)[j][k]

            if value == 0:
                value = ''
                sheet.cell(row = j + 9 , column = k + 1 ).value = value
            else :
                sheet.cell(row = j + 9 , column = k + 1 ).value = value
                # 设置字体
                sheet.cell(row = j + 9 , column = k + 1 ).font = Font(u'微软雅黑',size=11)
修改单元格式,美化显示
# 单元格文字设置,右对齐,垂直居中
align = Alignment(horizontal='right',vertical='center')

# 添加星期几信息行
days = ['星期日','星期一','星期二','星期三','星期四','星期五','星期六',]
num = 0
for k3 in range(1,8): # (A~G)填写内容,设置列宽
    sheet.cell(row = 8 , column = k3 ).value = days[num]
    # 右对齐 + 居中
    sheet.cell(row = 8 , column = k3).alignment = align
    sheet.cell(row = 8 , column = k3).font = Font(u'微软雅黑',size = 11)

    # get_column_letter 数字转字母 get_column_letter(1) --> 'A'
    c_char = get_column_letter(k3)
    # 设置列宽
    sheet.column_dimensions[c_char].width = 12
    num += 1

for k4 in range(8,14):
    # 设置行高
    sheet.row_dimensions[k4].height = 30
修改部分Excel背景填充色
使用for迭代定位出单元格的位置,然后为其fill属性赋值就完成了单元格背景色的填充
from openpyxl.styles import  PatternFill
# 单元格填充色属性设置
fill = PatternFill('solid',fgColor='99CCCC')

# 对单元格进行颜色填充
for k1 in range(1,50):
    for k2 in range(1,50):
        sheet.cell(row=k1,column=k2).fill = fill
轻松向Excel中插入图片
直接使用add_image就可以向Excel中添加图片
from openpyxl.drawing.image import Image
# 添加图片
img = Image('data/1.png')
newsize = (490,490)
img.width,img.height = newsize
# 与顶部有些距离,好看一些
sheet.add_image(img,"I2")
保存工作簿
wb.save('data/openpyxl_rili.xlsx')完整代码
########################################
# 三层for迭代完成日期获取与填充
########################################

# 一周的第一天,6表示星期日为一周的第一天,0表示星期一
calendar.setfirstweekday(firstweekday=6)

wb = openpyxl.Workbook()

for i in range(1,13): # 第一层迭代,遍历月份
    # 添加工作簿
    sheet = wb.create_sheet(index = 0 ,title = str(i) + '月')

    # 获取具体日期时间
    for j in range(len(calendar.monthcalendar(2023,i))): # 第二层迭代遍历周
        for k in range(len(calendar.monthcalendar(2023,i)[j])): # 第三层迭代遍历天,从而获得最终的日期
            value = calendar.monthcalendar(2023,i)[j][k]

            if value == 0:
                value = ''
                sheet.cell(row = j + 9 , column = k + 1 ).value = value
            else :
                sheet.cell(row = j + 9 , column = k + 1 ).value = value
                # 设置字体
                sheet.cell(row = j + 9 , column = k + 1 ).font = Font(u'微软雅黑',size=11)

    ########################################
    # 修改单元格式,美化显示
    ########################################

    # 单元格文字设置,右对齐,垂直居中
    align = Alignment(horizontal='right',vertical='center')

    # 添加星期几信息行
    days = ['星期日','星期一','星期二','星期三','星期四','星期五','星期六',]
    num = 0
    for k3 in range(1,8): # (A~G)填写内容,设置列宽
        sheet.cell(row = 8 , column = k3 ).value = days[num]
        # 右对齐 + 居中
        sheet.cell(row = 8 , column = k3).alignment = align
        sheet.cell(row = 8 , column = k3).font = Font(u'微软雅黑',size = 11)

        # get_column_letter 数字转字母 get_column_letter(1) --> 'A'
        c_char = get_column_letter(k3)
        # 设置列宽
        sheet.column_dimensions[c_char].width = 12
        num += 1

    for k4 in range(8,14):
        # 设置行高
        sheet.row_dimensions[k4].height = 30

    ########################################
    # 修改部分Excel背景填充色
    ########################################

    from openpyxl.styles import  PatternFill
    # 单元格填充色属性设置
    fill = PatternFill('solid',fgColor='99CCCC')

    # 对单元格进行颜色填充
    for k1 in range(1,50):
        for k2 in range(1,50):
            sheet.cell(row=k1,column=k2).fill = fill

    ########################################
    # 轻松向Excel中插入图片
    ########################################

    from openpyxl.drawing.image import Image
    # 添加图片
    img = Image('data/1.png')
    newsize = (490,490)
    img.width,img.height = newsize
    # 与顶部有些距离,好看一些
    sheet.add_image(img,"I2")

wb.save('data/openpyxl_rili.xlsx')
什么是Pandas
场景:
python 可以通过Excel中的数据自动做图
知识点:
-
pandas 是一个强大的分析结构化数据的工具集;它的使用基础是Numpy(提供高性能的矩阵运算);用于数据挖掘、数据分析和数据清洗功能等功能,因为Pandas操作Excel依赖于xlrd与xlwt,所以想要使用Pandas操作excel,需要先安装xlrd与xlwt
-
DataFrame类似于Excel中的一个工作表,它也有行与列的概念,pandas可以很方便的将Excel工作表与DataFrame相互转换
-
DataFrame 中的一行或一列其实就是Series,它类似于Excel工作表的一行或一列
Series 与 DataFrame
创建Series
import pandas as pd

s1 = pd.Series([1,2,3],index = [1,2,3], name = 'A')
print(s1)
1 1
2 2
3 3
Name: A, dtype: int64
s1.indexIndex([1, 2, 3], dtype='int64')
s1.name'A'
s1[1]1
创建DataFrame
import pandas as pd
s1 = pd.Series([1,2,3],index = [1,2,3],name = 'A')
s2 = pd.Series([10,20,30],index = [1,2,3],name = 'B')
s3 = pd.Series([100,200,300],index = [1,2,3],name = 'C')
# 以list的形式,则会将s1,s2,s3当做行加入DF中,其中的name就是行号
df = pd.DataFrame([s1,s2,s3])df| 1 | 2 | 3 | |
|---|---|---|---|
| A | 1 | 2 | 3 |
| B | 10 | 20 | 30 |
| C | 100 | 200 | 300 |
# 将s1,s2,s3当做列加入DF中,index作为行号
df2 = pd.DataFrame({s1.name: s1, s2.name: s2, s3.name: s3})df2| A | B | C | |
|---|---|---|---|
| 1 | 1 | 10 | 100 |
| 2 | 2 | 20 | 200 |
| 3 | 3 | 30 | 300 |
Pandas 读写 Excel
Pandas 将数据写入Excel
import pandas as pd

# DataFrame 数据帧相当于 工作簿中的一个工作表
df = pd.DataFrame({
    'id':[1,2,3],
    'name':['张三','李四','王五'],
    'age':[28,25,30]
})

# 自定义索引,不然pandas会使用默认的索引,这会导致生成的工作表也会存在这些索引
df = df.set_index('id')
print(df)

df.to_excel('data/pandas_people.xlsx')
print('Done!')
name age
id
1 张三 28
2 李四 25
3 王五 30
Done!
Pandas 数据读取Excel
读入时,设置不同的参数会有不同的效果
# header = 2 表示从第三行开始(从0开始),跳过了前两行,sheet_name 指定读取的工作表
people = pd.read_excel('data/pandas_people.xlsx',header=2,sheet_name = 'Sheet1')
# 输出列名
print(people.columns)
Index([2, '李四', 25], dtype='object')
# 如果读入的Excel中没有开头标题,则可以将header=None,人为的进行设置
people = pd.read_excel('data/pandas_people.xlsx',header=None)
people.columns = ['id','name','age']
print(people.columns)
Index(['id', 'name', 'age'], dtype='object')
# 指定Id列为索引
people = pd.read_excel('data/pandas_people.xlsx',index_col='id')
# 输出前5行,此时就不会产生默认索引了
print(people.head)
<bound method NDFrame.head of name age
id
1 张三 28
2 李四 25
3 王五 30>
# skiprows开头跳过几行,usecols使用那些列中的数据,dtype设置某一列的类型
peoples = pd.read_excel('data/pandas_people.xlsx',skiprows=4,usecols='E:H',dtype={'ID':str,'gender':str,'birthday':str})
Pandas修改Excel数据
知识点:
如果dypte不设置,pandas遇到NaN数据就会将其转为float64,我们无法直接将其指定为整型,所以这里折中的先将其指定为str类型
通过at方法直接定位DataFrame中元素的位置,然后直接赋值修改
from datetime import datetime,date
startday = datetime.now()

import pandas as pd

peoples = pd.read_excel('data/pandas_people1.xlsx',skiprows=4,usecols='B:D',
                       dtype={'ID':str,'gender':str,'birthday':str})

# 直接在DataFrame上操作
for i in peoples.index:
    peoples.at[i,'ID'] = i + 1
    peoples.at[i,'gender'] = 'Male' if i % 2 == 0 else 'Female'
    peoples.at[i,'birthday'] = date(startday.year + i,startday.month,startday.day)

print(peoples)

# inplace表示就地修改DataFrame,不必再重新创建一个新的DtaFrame来存储修改后的状态
peoples.set_index('ID',inplace=True)

peoples.to_excel('data/pandas_people2.xlsx')
id name age ID gender birthday
0 1 张三 28 1.0 Male 2023-10-09
1 2 李四 25 2.0 Female 2024-10-09
2 3 王五 30 3.0 Male 2025-10-09
修改Excel中的数据
peoples = pd.read_excel('data/pandas_people.xlsx',index_col='id')
# 加工资
def add_1000(x):
    return x + 1000

# 1.直接对series相加
peoples['money'] = peoples['money'] + 1000
# 2.apply会逐个元素的去调用函数
peoples['money'] = peoples['money'].apply(add_1000)
# 3.通过匿名函数的方式
peoples['money'] = peoples['money'].apply(lambda x:x+1000)

peoples.to_excel('data/pandas_people3.xlsx')
Pandas排序Excel数据
对Excel排序对Pandas而言其实是对DataFrame排序,直接使用sort_values()方法就好
import pandas as pd

peoples = pd.read_excel('data/pandas_people3.xlsx',index_col = 'id')

# sort_values 安值排序,by针对哪一列
# ascending为False则从大到小
peoples.sort_values(by='money',inplace=True,ascending=False)
print(peoples)
name age money
id
3 王五 30 3300
2 李四 25 3200
1 张三 28 3100
Pandas多列排序
import pandas as pd

peoples = pd.read_excel('data/pandas_people3.xlsx',index_col = 'id')

# 对多列进行排序,by与ascending都传入对应顺序的list,pandas会先对jake从小到大排序
# 这样no,就对不满意的人排在前面,方便开除他,然后对money排序,此时会在jake排序的基础上进行排序

peoples.sort_values(by=['age','money'],inplace=True,ascending=[True,False])
print(peoples)
name age money
id
2 李四 25 3200
1 张三 28 3100
3 王五 30 3300
Pandas 过滤Excel数据
快速过滤Excel中不满足条件的数据
import pandas as pd

# 定义过滤方法
def age_50_to_90(a):
    return 50 <= a <=90

def level_a(s):
    return 40 <= s <= 100

students = pd.read_excel('data/pandas_people.xlsx',index_col = 'id')

# 使用DataFrame的loc(location)去定位出过滤后的数据
# 利用Series的apply去运用过滤方法,将数据进行过滤

students = students.loc[students['age'].apply(age_50_to_90)].loc[students['money'].apply(level_a)]
绘制柱状图与叠加柱状图
知识点:
matplotlib是一个python的包
用于绘制2D绘图,要绘制3D图像需要安装支持库
非常强大非常流行、有很多扩展
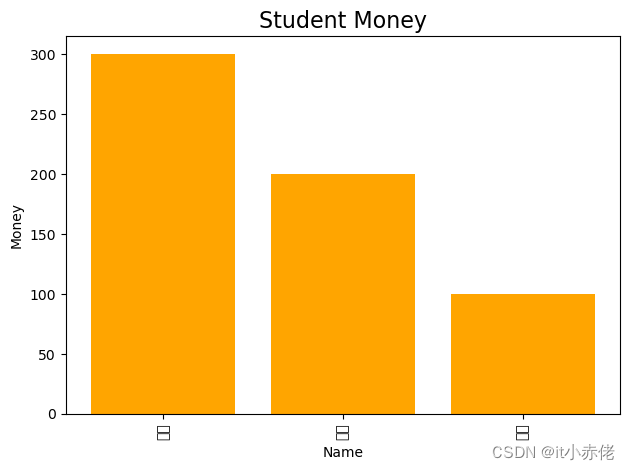
pandas + matplotlib绘制柱状图
import pandas as pd
import matplotlib.pyplot as plt

students = pd.read_excel('data/pandas_people.xlsx')
# sort_values排序,inplace原地修改,ascending False从小到大
students.sort_values(by='money',inplace=True,ascending=False)

# 直接使用plt.bar()绘制柱状图
plt.bar(students.name,students.money,color='orange')

# 设置标题、x轴名称与y轴名称,fontsize设置字号
plt.title('Student Money',fontsize = 16)
plt.xlabel('Name')
plt.ylabel('Money')

# 因为x轴字体太长,利用rotation将其旋转90度,方便显示
plt.xticks(students.name,rotation=90)
# 紧凑型布局(因为x轴文字比较长,为了让其显示全,使用紧凑型布局)
plt.tight_layout()
plt.show()
C:\Users\Administrator\AppData\Local\Temp\ipykernel_16600\2570441082.py:19: UserWarning: Glyph 29579 (\N{CJK UNIFIED IDEOGRAPH-738B}) missing from current font.
plt.tight_layout()
C:\Users\Administrator\AppData\Local\Temp\ipykernel_16600\2570441082.py:19: UserWarning: Glyph 20116 (\N{CJK UNIFIED IDEOGRAPH-4E94}) missing from current font.
plt.tight_layout()
C:\Users\Administrator\AppData\Local\Temp\ipykernel_16600\2570441082.py:19: UserWarning: Glyph 26446 (\N{CJK UNIFIED IDEOGRAPH-674E}) missing from current font.
plt.tight_layout()
C:\Users\Administrator\AppData\Local\Temp\ipykernel_16600\2570441082.py:19: UserWarning: Glyph 22235 (\N{CJK UNIFIED IDEOGRAPH-56DB}) missing from current font.
plt.tight_layout()
C:\Users\Administrator\AppData\Local\Temp\ipykernel_16600\2570441082.py:19: UserWarning: Glyph 24352 (\N{CJK UNIFIED IDEOGRAPH-5F20}) missing from current font.
plt.tight_layout()
C:\Users\Administrator\AppData\Local\Temp\ipykernel_16600\2570441082.py:19: UserWarning: Glyph 19977 (\N{CJK UNIFIED IDEOGRAPH-4E09}) missing from current font.
plt.tight_layout()
D:\Program Files\Anaconda3\lib\site-packages\IPython\core\pylabtools.py:152: UserWarning: Glyph 29579 (\N{CJK UNIFIED IDEOGRAPH-738B}) missing from current font.
fig.canvas.print_figure(bytes_io, **kw)
D:\Program Files\Anaconda3\lib\site-packages\IPython\core\pylabtools.py:152: UserWarning: Glyph 20116 (\N{CJK UNIFIED IDEOGRAPH-4E94}) missing from current font.
fig.canvas.print_figure(bytes_io, **kw)
D:\Program Files\Anaconda3\lib\site-packages\IPython\core\pylabtools.py:152: UserWarning: Glyph 26446 (\N{CJK UNIFIED IDEOGRAPH-674E}) missing from current font.
fig.canvas.print_figure(bytes_io, **kw)
D:\Program Files\Anaconda3\lib\site-packages\IPython\core\pylabtools.py:152: UserWarning: Glyph 22235 (\N{CJK UNIFIED IDEOGRAPH-56DB}) missing from current font.
fig.canvas.print_figure(bytes_io, **kw)
D:\Program Files\Anaconda3\lib\site-packages\IPython\core\pylabtools.py:152: UserWarning: Glyph 24352 (\N{CJK UNIFIED IDEOGRAPH-5F20}) missing from current font.
fig.canvas.print_figure(bytes_io, **kw)
D:\Program Files\Anaconda3\lib\site-packages\IPython\core\pylabtools.py:152: UserWarning: Glyph 19977 (\N{CJK UNIFIED IDEOGRAPH-4E09}) missing from current font.
fig.canvas.print_figure(bytes_io, **kw)
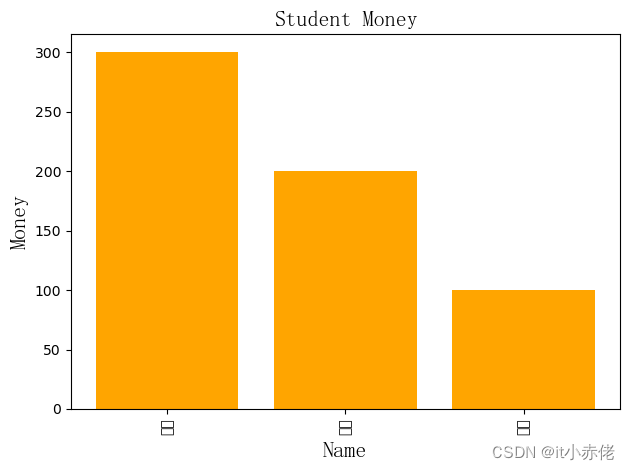
title、x轴以及y轴替换为中文显示
matplotlib默认字符集是不支持中文的,所以需要修改字符集
import pandas as pd
import matplotlib.pyplot as plt

students = pd.read_excel('data/pandas_people.xlsx')
# sort_values排序,inplace原地修改,ascending False从小到大
students.sort_values(by='money',inplace=True,ascending=False)

# 直接使用plt.bar()绘制柱状图
plt.bar(students.name,students.money,color='orange')

# 添加中文字体支持
from matplotlib.font_manager import FontProperties
# SimSun.ttc 简体字
font = FontProperties(fname=r'c:\windows\fonts\SimSun.ttc',size=16)

# 设置标题、x轴名称与y轴名称,fontsize设置字号
plt.title('Student Money',fontsize = 16,fontproperties=font)
plt.xlabel('Name',fontproperties=font)
plt.ylabel('Money',fontproperties=font)

# 因为x轴字体太长,利用rotation将其旋转90度,方便显示
plt.xticks(students.name,rotation=90)
# 紧凑型布局(因为x轴文字比较长,为了让其显示全,使用紧凑型布局)
plt.tight_layout()
plt.show()
C:\Users\Administrator\AppData\Local\Temp\ipykernel_16600\1332766611.py:24: UserWarning: Glyph 29579 (\N{CJK UNIFIED IDEOGRAPH-738B}) missing from current font.
plt.tight_layout()
C:\Users\Administrator\AppData\Local\Temp\ipykernel_16600\1332766611.py:24: UserWarning: Glyph 20116 (\N{CJK UNIFIED IDEOGRAPH-4E94}) missing from current font.
plt.tight_layout()
C:\Users\Administrator\AppData\Local\Temp\ipykernel_16600\1332766611.py:24: UserWarning: Glyph 26446 (\N{CJK UNIFIED IDEOGRAPH-674E}) missing from current font.
plt.tight_layout()
C:\Users\Administrator\AppData\Local\Temp\ipykernel_16600\1332766611.py:24: UserWarning: Glyph 22235 (\N{CJK UNIFIED IDEOGRAPH-56DB}) missing from current font.
plt.tight_layout()
C:\Users\Administrator\AppData\Local\Temp\ipykernel_16600\1332766611.py:24: UserWarning: Glyph 24352 (\N{CJK UNIFIED IDEOGRAPH-5F20}) missing from current font.
plt.tight_layout()
C:\Users\Administrator\AppData\Local\Temp\ipykernel_16600\1332766611.py:24: UserWarning: Glyph 19977 (\N{CJK UNIFIED IDEOGRAPH-4E09}) missing from current font.
plt.tight_layout()
D:\Program Files\Anaconda3\lib\site-packages\IPython\core\pylabtools.py:152: UserWarning: Glyph 29579 (\N{CJK UNIFIED IDEOGRAPH-738B}) missing from current font.
fig.canvas.print_figure(bytes_io, **kw)
D:\Program Files\Anaconda3\lib\site-packages\IPython\core\pylabtools.py:152: UserWarning: Glyph 20116 (\N{CJK UNIFIED IDEOGRAPH-4E94}) missing from current font.
fig.canvas.print_figure(bytes_io, **kw)
D:\Program Files\Anaconda3\lib\site-packages\IPython\core\pylabtools.py:152: UserWarning: Glyph 26446 (\N{CJK UNIFIED IDEOGRAPH-674E}) missing from current font.
fig.canvas.print_figure(bytes_io, **kw)
D:\Program Files\Anaconda3\lib\site-packages\IPython\core\pylabtools.py:152: UserWarning: Glyph 22235 (\N{CJK UNIFIED IDEOGRAPH-56DB}) missing from current font.
fig.canvas.print_figure(bytes_io, **kw)
D:\Program Files\Anaconda3\lib\site-packages\IPython\core\pylabtools.py:152: UserWarning: Glyph 24352 (\N{CJK UNIFIED IDEOGRAPH-5F20}) missing from current font.
fig.canvas.print_figure(bytes_io, **kw)
D:\Program Files\Anaconda3\lib\site-packages\IPython\core\pylabtools.py:152: UserWarning: Glyph 19977 (\N{CJK UNIFIED IDEOGRAPH-4E09}) missing from current font.
fig.canvas.print_figure(bytes_io, **kw)
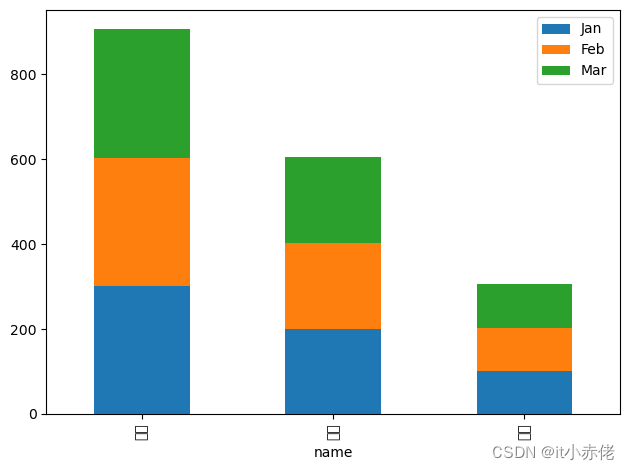
绘制竖立的叠加柱状图
绘制竖立的叠加柱状图依旧使用bar()方法吗,只是多了stacked函数
import pandas as pd
import matplotlib.pyplot as plt

users = pd.read_excel('data/pandas_people.xlsx')

# 新计算出一个总量,用于排序
users['Total'] = users['Jan'] + users['Feb'] + users['Mar']
# 排序
users.sort_values(by='Total',inplace=True,ascending=False)

# 竖立的叠加柱状图,利用stacked就可以实现叠加形式
users.plot.bar(x='name',y=['Jan','Feb','Mar'],stacked=True)

# 紧凑型布局(因为x轴文字比较长,为了让其显示全,使用紧凑型布局)
plt.tight_layout()
plt.show()
C:\Users\Administrator\AppData\Local\Temp\ipykernel_16600\2459268171.py:15: UserWarning: Glyph 29579 (\N{CJK UNIFIED IDEOGRAPH-738B}) missing from current font.
plt.tight_layout()
C:\Users\Administrator\AppData\Local\Temp\ipykernel_16600\2459268171.py:15: UserWarning: Glyph 20116 (\N{CJK UNIFIED IDEOGRAPH-4E94}) missing from current font.
plt.tight_layout()
C:\Users\Administrator\AppData\Local\Temp\ipykernel_16600\2459268171.py:15: UserWarning: Glyph 26446 (\N{CJK UNIFIED IDEOGRAPH-674E}) missing from current font.
plt.tight_layout()
C:\Users\Administrator\AppData\Local\Temp\ipykernel_16600\2459268171.py:15: UserWarning: Glyph 22235 (\N{CJK UNIFIED IDEOGRAPH-56DB}) missing from current font.
plt.tight_layout()
C:\Users\Administrator\AppData\Local\Temp\ipykernel_16600\2459268171.py:15: UserWarning: Glyph 24352 (\N{CJK UNIFIED IDEOGRAPH-5F20}) missing from current font.
plt.tight_layout()
C:\Users\Administrator\AppData\Local\Temp\ipykernel_16600\2459268171.py:15: UserWarning: Glyph 19977 (\N{CJK UNIFIED IDEOGRAPH-4E09}) missing from current font.
plt.tight_layout()
D:\Program Files\Anaconda3\lib\site-packages\IPython\core\pylabtools.py:152: UserWarning: Glyph 29579 (\N{CJK UNIFIED IDEOGRAPH-738B}) missing from current font.
fig.canvas.print_figure(bytes_io, **kw)
D:\Program Files\Anaconda3\lib\site-packages\IPython\core\pylabtools.py:152: UserWarning: Glyph 20116 (\N{CJK UNIFIED IDEOGRAPH-4E94}) missing from current font.
fig.canvas.print_figure(bytes_io, **kw)
D:\Program Files\Anaconda3\lib\site-packages\IPython\core\pylabtools.py:152: UserWarning: Glyph 26446 (\N{CJK UNIFIED IDEOGRAPH-674E}) missing from current font.
fig.canvas.print_figure(bytes_io, **kw)
D:\Program Files\Anaconda3\lib\site-packages\IPython\core\pylabtools.py:152: UserWarning: Glyph 22235 (\N{CJK UNIFIED IDEOGRAPH-56DB}) missing from current font.
fig.canvas.print_figure(bytes_io, **kw)
D:\Program Files\Anaconda3\lib\site-packages\IPython\core\pylabtools.py:152: UserWarning: Glyph 24352 (\N{CJK UNIFIED IDEOGRAPH-5F20}) missing from current font.
fig.canvas.print_figure(bytes_io, **kw)
D:\Program Files\Anaconda3\lib\site-packages\IPython\core\pylabtools.py:152: UserWarning: Glyph 19977 (\N{CJK UNIFIED IDEOGRAPH-4E09}) missing from current font.
fig.canvas.print_figure(bytes_io, **kw)
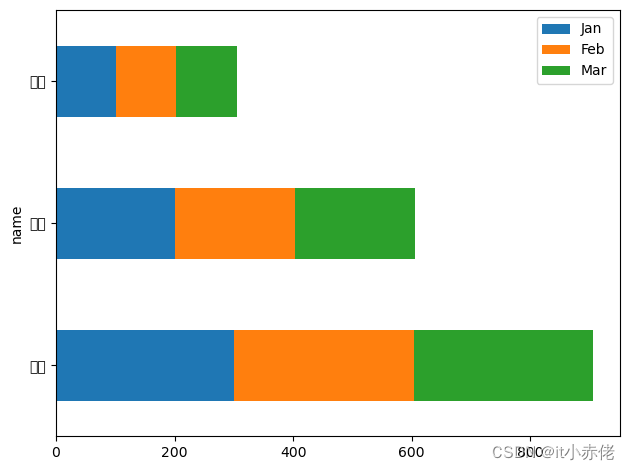
绘制竖立的叠加柱状图
import pandas as pd
import matplotlib.pyplot as plt

users = pd.read_excel('data/pandas_people.xlsx')

# 新计算出一个总量,用于排序
users['Total'] = users['Jan'] + users['Feb'] + users['Mar']
# 排序
users.sort_values(by='Total',inplace=True,ascending=False)

# 水平的叠加柱状图,barh中的h表示horizontal水平的
# 使用stacked就可以实现叠加形式
users.plot.barh(x='name',y=['Jan','Feb','Mar'],stacked=True)

# 紧凑型布局(因为x轴文字比较长,为了让其显示全,使用紧凑型布局)
plt.tight_layout()
plt.show()
C:\Users\Administrator\AppData\Local\Temp\ipykernel_16600\1615121703.py:16: UserWarning: Glyph 29579 (\N{CJK UNIFIED IDEOGRAPH-738B}) missing from current font.
plt.tight_layout()
C:\Users\Administrator\AppData\Local\Temp\ipykernel_16600\1615121703.py:16: UserWarning: Glyph 20116 (\N{CJK UNIFIED IDEOGRAPH-4E94}) missing from current font.
plt.tight_layout()
C:\Users\Administrator\AppData\Local\Temp\ipykernel_16600\1615121703.py:16: UserWarning: Glyph 26446 (\N{CJK UNIFIED IDEOGRAPH-674E}) missing from current font.
plt.tight_layout()
C:\Users\Administrator\AppData\Local\Temp\ipykernel_16600\1615121703.py:16: UserWarning: Glyph 22235 (\N{CJK UNIFIED IDEOGRAPH-56DB}) missing from current font.
plt.tight_layout()
C:\Users\Administrator\AppData\Local\Temp\ipykernel_16600\1615121703.py:16: UserWarning: Glyph 24352 (\N{CJK UNIFIED IDEOGRAPH-5F20}) missing from current font.
plt.tight_layout()
C:\Users\Administrator\AppData\Local\Temp\ipykernel_16600\1615121703.py:16: UserWarning: Glyph 19977 (\N{CJK UNIFIED IDEOGRAPH-4E09}) missing from current font.
plt.tight_layout()
D:\Program Files\Anaconda3\lib\site-packages\IPython\core\pylabtools.py:152: UserWarning: Glyph 29579 (\N{CJK UNIFIED IDEOGRAPH-738B}) missing from current font.
fig.canvas.print_figure(bytes_io, **kw)
D:\Program Files\Anaconda3\lib\site-packages\IPython\core\pylabtools.py:152: UserWarning: Glyph 20116 (\N{CJK UNIFIED IDEOGRAPH-4E94}) missing from current font.
fig.canvas.print_figure(bytes_io, **kw)
D:\Program Files\Anaconda3\lib\site-packages\IPython\core\pylabtools.py:152: UserWarning: Glyph 26446 (\N{CJK UNIFIED IDEOGRAPH-674E}) missing from current font.
fig.canvas.print_figure(bytes_io, **kw)
D:\Program Files\Anaconda3\lib\site-packages\IPython\core\pylabtools.py:152: UserWarning: Glyph 22235 (\N{CJK UNIFIED IDEOGRAPH-56DB}) missing from current font.
fig.canvas.print_figure(bytes_io, **kw)
D:\Program Files\Anaconda3\lib\site-packages\IPython\core\pylabtools.py:152: UserWarning: Glyph 24352 (\N{CJK UNIFIED IDEOGRAPH-5F20}) missing from current font.
fig.canvas.print_figure(bytes_io, **kw)
D:\Program Files\Anaconda3\lib\site-packages\IPython\core\pylabtools.py:152: UserWarning: Glyph 19977 (\N{CJK UNIFIED IDEOGRAPH-4E09}) missing from current font.
fig.canvas.print_figure(bytes_io, **kw)
绘制饼图
import pandas as pd
import matplotlib.pyplot as plt

# 饼图会以索引作为饼图中每一块的显示标签,所以这里使用,index_col 指定索引
students = pd.read_excel('data/pandas_people4.xlsx',index_col='From')

# pie绘制饼图,饼图只需要使用一列数据,所以直接使用Series绘制则可
# counterclock为False,让饼图顺时针方式显示
# startangle起始位置,这样最大的部分就从-270度的位置开始绘制
students[2019].plot.pie(fontsize=8,counterclock=False,startangle=-270)
plt.title('title',fontsize=16,fontweight='bold')
plt.ylabel(2019,fontsize=12,fontweight='bold')
plt.show()
绘制折线图
import pandas as pd
import matplotlib.pyplot as plt

weeks = pd.read_excel('data/pandas_people5.xlsx',index_col='id')

# 绘制折线图,直接调用plot则可
weeks.plot(y=['age','Score'])
plt.title('Title',fontsize=16,fontweight='bold')
plt.xticks(weeks.index,fontsize=8)
plt.show()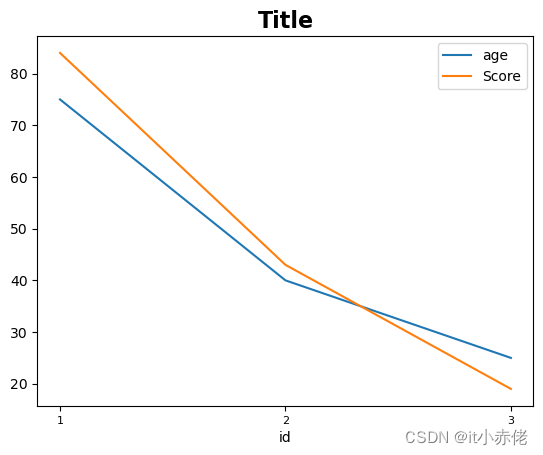
绘制区域叠加折线图
import pandas as pd
import matplotlib.pyplot as plt

weeks = pd.read_excel('data/pandas_people5.xlsx',index_col = 'id')

# 绘制叠加折线图(获得当前时刻的最高点,并且知道每一部分做了多少贡献)
weeks.plot.area(y=['age','Score'])

plt.title('Title',fontsize = 16,fontweight='bold')
plt.xticks(weeks.index,fontsize=8)
plt.show()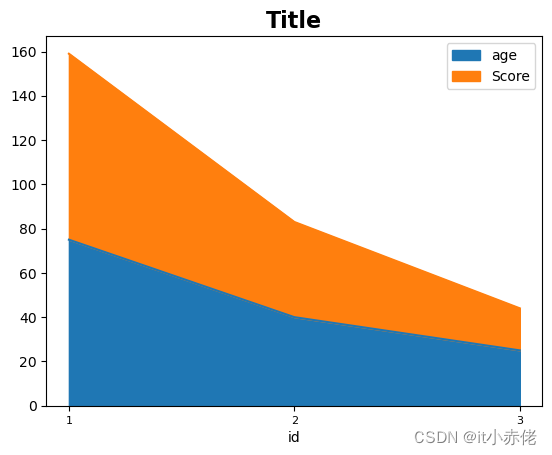
注意:
柱状图侧重于个体的描述,能准确的知道每个项目的大小。
饼状图侧重于描述在这个系统中,每个个体所占的权重。
折线图侧重于描述数据变化的趋势。
多表联合操作
场景:
利用Pandas 的多表联合操作可以轻松代替Excel中的vlookup功能,并且通过类似的方式,可以轻易实现跨文件的多表联合操作
使用DataFrame的merge()方法合并多表
语法:
all_df = students.marge(scores,how='left',on='ID',).fillna(0)
marge横向合并两个Dataframe
合并时students在left而scores在right,如果不指定how,那么合并时,students与socers就是取交集的效果,这里指定left,那么合并时,students中无论是否存在与socres对应的值都会保留
on用于设置合并的列,集students与socres以ID作为合并的列(两者都有ID这一列),如果students与socres中不存在相同名称的列,可以使用left_on = ID,right_on = ID ,这里因为都是叫ID,所以直接使用on=ID则可
import pandas as pd

students = pd.read_excel('data/students.xlsx',sheet_name = 'name')
scores = pd.read_excel('data/score.xlsx',sheet_name = 'score')

table = students.merge(scores,how='left',on='ID',).fillna(0)

table.分数 = table.分数.astype(int)
print(table)
ID 名称 分数
0 1 Samantha Montoya 83
1 2 Ivan Montgomery 23
2 3 Mr. Nathan Price DDS 66
3 4 Kelsey Andersen 90
4 5 Allen Smith 0
5 6 Richard Martinez 78
6 7 Mark Dominguez 71
7 8 William Leonard 86
8 9 Richard Roy 97
9 10 Craig Davis 43
合并时如果没有同名列 - 使用left_on 与 reight_on分别定义名称
# 读入时将ID设置为了index,此时列中就不存在ID了
students = pd.read_excel('data/students.xlsx',sheet_name='name',index_col = 'ID')
scores = pd.read_excel('data/score.xlsx',sheet_name = 'score',index_col='ID')

# 列中没有ID了,此时就无法使用on=ID,则使用left_on = students.index,right_on = scores.index的方式代替
table = students.merge(scores,how='left',left_on = students.index,right_on = scores.index).fillna(0)

table.分数 = table.分数.astype(int)
print(table)
key_0 名称 分数
0 1 Samantha Montoya 83
1 2 Ivan Montgomery 23
2 3 Mr. Nathan Price DDS 66
3 4 Kelsey Andersen 90
4 5 Allen Smith 0
5 6 Richard Martinez 78
6 7 Mark Dominguez 71
7 8 William Leonard 86
8 9 Richard Roy 97
9 10 Craig Davis 43
使用join()方法来合并DataFrame
语法:
all_df = students.join(scores,how='left',on='ID').fillna(0)
使用join 来进行横向拼接,join只有on方法,没有left_on 或right_on,join默认就是使用index来进行两个DataFrame的拼接,如果要非Index,就可以通过on去指定
# 读入时将ID设置为了index,此时列中就不存在ID了
students = pd.read_excel('data/students.xlsx',sheet_name='name',index_col = 'ID')
scores = pd.read_excel('data/score.xlsx',sheet_name = 'score',index_col='ID')

# 使用join来进行横向拼接,join只有on方法,没有left_on或right_on
# join默认就是使用index来进行两个DataFrame的拼接
# 如果要非index,可以通过On去指定
table = students.join(scores,how='left').fillna(0)
table.分数 = table.分数.astype(int)
print(table)
名称 分数
ID
1 Samantha Montoya 83
2 Ivan Montgomery 23
3 Mr. Nathan Price DDS 66
4 Kelsey Andersen 90
5 Allen Smith 0
6 Richard Martinez 78
7 Mark Dominguez 71
8 William Leonard 86
9 Richard Roy 97
10 Craig Davis 43
拆分数据
DataFrame拆分数据 - 类似表格中的数据分列
import pandas as pd

names = pd.read_excel('data/students.xlsx',index_col='ID')
# print(names)
# 将完整名字拆分成姓氏与名字
df = names['名称'].str.split(expand=True)
names['First Name'] = df[0]
names['Last Name'] = df[1]
print(names)
名称 First Name Last Name
ID
1 Samantha Montoya Samantha Montoya
2 Ivan Montgomery Ivan Montgomery
3 Mr. Nathan Price DDS Mr. Nathan
4 Kelsey Andersen Kelsey Andersen
5 Allen Smith Allen Smith
6 Richard Martinez Richard Martinez
7 Mark Dominguez Mark Dominguez
8 William Leonard William Leonard
9 Richard Roy Richard Roy
10 Craig Davis Craig Davis
求和、求平均
知识点:
axis 为 1 将作用于每行中的所有列
axis 为 0 将作用于每列中的所有行
测试:
import pandas as pd

df = pd.DataFrame([[1,1,1,1],[2,2,2,2],[3,3,3,3],[4,4,4,4]],columns=['col1','col2','col3','col4'])
df| col1 | col2 | col3 | col4 | |
|---|---|---|---|---|
| 0 | 1 | 1 | 1 | 1 |
| 1 | 2 | 2 | 2 | 2 |
| 2 | 3 | 3 | 3 | 3 |
| 3 | 4 | 4 | 4 | 4 |
# axis = 1  作用于行; mean对所选区域求平均数
df.mean(axis=1)
0 1.0
1 2.0
2 3.0
3 4.0
dtype: float64
# axis = 0  作用于列; mean对所选区域求平均数
df.mean(axis=0)
col1 2.5
col2 2.5
col3 2.5
col4 2.5
dtype: float64
# axis = 1 ; drop 删除区域 ; 删除每行的第4列
df.drop('col4',axis=1)| col1 | col2 | col3 | |
|---|---|---|---|
| 0 | 1 | 1 | 1 |
| 1 | 2 | 2 | 2 |
| 2 | 3 | 3 | 3 |
| 3 | 4 | 4 | 4 |
实现求和与求平均
### import pandas as pd

students = pd.read_excel('data/pandas_people6.xlsx',index_col='ID')
# students
# 对每一行中的每一列进行求和操作
row_sum = students[['体重','身高']].sum(axis = 1)
# 对每一行的每一列进行求平均操作
row_mean = students[['体重','身高']].mean(axis = 1)

# 为DataFrame添加新的一列
students['Total'] = row_sum
students['Average'] = row_mean

# axis默认为0,对每一列中的每一行进行求平均操作
col_mean =  students[['体重','身高','Total','Average']].mean()
col_mean['名称'] = 'Summary'

# axis默认为0,对每一列中的每一行进行求平均操作
col_sum =  students[['体重','身高','Total','Average']].sum()
col_sum['名称'] = 'Sum'

# 通过append()方法添加新的一行,ignore_index忽略index
students = students._append(col_mean,ignore_index=True)
# 通过append()方法添加新的一行,ignore_index忽略index
students = students._append(col_sum,ignore_index=True)
print(students)
名称 体重 身高 Total Average
0 Samantha Montoya 130.0 170.0 300.0 150.0
1 Ivan Montgomery 128.0 162.0 290.0 145.0
2 Mr. Nathan Price DDS 110.0 162.0 272.0 136.0
3 Kelsey Andersen 90.0 158.0 248.0 124.0
4 Allen Smith 88.0 154.0 242.0 121.0
5 Richard Martinez 89.0 154.0 243.0 121.5
6 Mark Dominguez 122.0 160.0 282.0 141.0
7 William Leonard 134.0 177.0 311.0 155.5
8 Richard Roy 150.0 178.0 328.0 164.0
9 Craig Davis 166.0 179.0 345.0 172.5
10 Jennifer Lewis 160.0 190.0 350.0 175.0
11 Jennifer Maldonado 92.0 160.0 252.0 126.0
12 David Johnson 99.0 162.0 261.0 130.5
13 Brittany Brown 100.0 169.0 269.0 134.5
14 Antonio Smith 123.0 170.0 293.0 146.5
15 Christopher Olsen 111.0 153.0 264.0 132.0
16 Joseph Webster 121.0 162.0 283.0 141.5
17 Heather Evans 109.0 170.0 279.0 139.5
18 David Pham 108.0 174.0 282.0 141.0
19 Amy Mcconnell 78.0 152.0 230.0 115.0
20 Summary 115.4 165.8 281.2 140.6
21 Sum 2308.0 3316.0 5624.0 2812.0


 6127
6127


 被折叠的 条评论
为什么被折叠?
被折叠的 条评论
为什么被折叠?
 到【灌水乐园】发言


