


Latex pgfplots package
Add package and set the version of package
\usepackage{pgfplots}     % package for plot figure
\pgfplotsset{compat=1.12} % package version
Example 1:
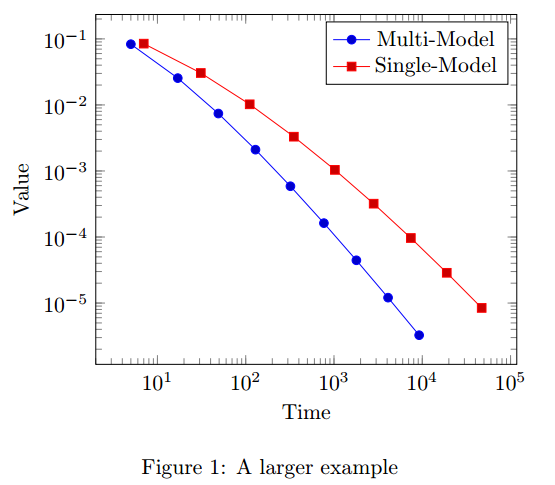
\begin{figure}
	\centering
	\begin{tikzpicture}
	\begin{loglogaxis}[xlabel=Time,ylabel=Value]
	\addplot coordinates {
		(5, 8.31160034e-02)
		(17, 2.54685628e-02)
		(49, 7.40715288e-03)
		(129, 2.10192154e-03)
		(321, 5.87352989e-04)
		(769, 1.62269942e-04)
		(1793, 4.44248889e-05)
		(4097, 1.20714122e-05)
		(9217, 3.26101452e-06)
	};
	\addplot coordinates {
		(7, 8.47178381e-02)
		(31, 3.04409349e-02)
		(111, 1.02214539e-02)
		(351, 3.30346265e-03)
		(1023, 1.03886535e-03)
		(2815, 3.19646457e-04)
		(7423, 9.65789766e-05)
		(18943, 2.87339125e-05)
		(47103, 8.43749881e-06)
	};
	\legend{Multi-Model,Single-Model}
	\end{loglogaxis}
	\end{tikzpicture}
	\caption{A larger example}
\end{figure}
Figure 1:
Example 2:
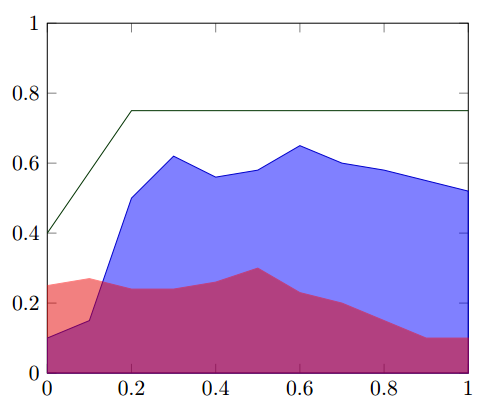
\begin{figure}
	\centering
	% Preamble: \pgfplotsset{width=7cm,compat=1.12}
	\begin{tikzpicture}
	\begin{axis}[ymin=0,ymax=1,enlargelimits=false]
	\addplot
	[blue!80!black,fill=blue,fill opacity=0.5]
	coordinates
	{(0,0.1) (0.1,0.15) (0.2,0.5) (0.3,0.62)
		(0.4,0.56) (0.5,0.58) (0.6,0.65) (0.7,0.6)
		(0.8,0.58) (0.9,0.55) (1,0.52)}
	|- (0,0) -- cycle;
	\addplot
	[red,fill=red!90!black,opacity=0.5]
	coordinates
	{(0,0.25) (0.1,0.27) (0.2,0.24) (0.3,0.24)
		(0.4,0.26) (0.5,0.3) (0.6,0.23) (0.7,0.2)
		(0.8,0.15) (0.9,0.1) (1,0.1)}
	|- (0,0) -- cycle;
	\addplot[green!20!black] coordinates
	{(0,0.4) (0.2,0.75) (1,0.75)};
	\end{axis}
	\end{tikzpicture}
\end{figure}
Figure 2:


 6114
6114

 被折叠的 条评论
为什么被折叠?
被折叠的 条评论
为什么被折叠?
 到【灌水乐园】发言


