


参考:https://grafana.com/docs/grafana/latest/installation
文章链接https://www.cnblogs.com/suim1218/p/11358678.html
grafana我们这里采用docker方式部署,Docker安装,可参考官方文档
1.下载
# docker pull grafana/grafana-enterprise:8.3.0
1.1在宿主机中创建数据⽬录
# mkdir -p /opt/grafana-data/
1.2.临时启动grafana
# docker run -d --rm --name grafana grafana/grafana-enterprise:8.3.0
1.3.查看grafana的⽤户id
# docker exec -it grafana

# cat /etc/passwd
输出
grafana:x:472:0:Linux User,,,:/home/grafana:/sbin/nologin
可以看出grafana的⽤户id是472
1.4.拷出配置⽂件
# docker cp grafana:/etc/grafana/grafana.ini /opt/grafana-data/etc/

# chown -R 472 /opt/grafana-data
1.5.停⽌临时的容器
# docker stop grafana
2.启动
2.1命令行启动
docker run -d -- user 104 --name grafana -p 3000:3000 -v /opt/grafana-data/etc:/etc/grafana/ -v /opt/grafana-data/:/var/lib/grafana grafana/grafana-enterprise:8.3.0
2.2docker-compose启动
docker-compose.yaml
cat > docker-compose.yaml << EOF
version: '2'
services:
  grafana:
    image: grafana/grafana-enterprise:8.3.0
    user: '104'
    ports:
      - 3000:3000
    volumes:
      - /opt/grafana-data/etc:/etc/grafana
      - /opt/grafana-data/:/var/lib/grafana

EOF
3.浏览器访问
打开浏览器,访问http://192.168.229.139:3000,用户名密码:admin,如下图所示

4.为Grafana添加Prometheus数据源


URL输入服务端地址

5. 创建Dashboard


6.添加CPU使用率图形
Metrics输入
100 - (avg by (instance) (irate(node_cpu_seconds_total{mode="idle"}[5m])) * 100)

7.添加内存使用率图形
Metrics输入
(1 - (node_memory_MemAvailable_bytes / node_memory_MemTotal_bytes ))* 100

8.添加磁盘使用率图形
Metrics输入
(1-(node_filesystem_free_bytes{fstype=~"ext4|xfs"} / node_filesystem_size_bytes{fstype=~"ext4|xfs"})) * 100

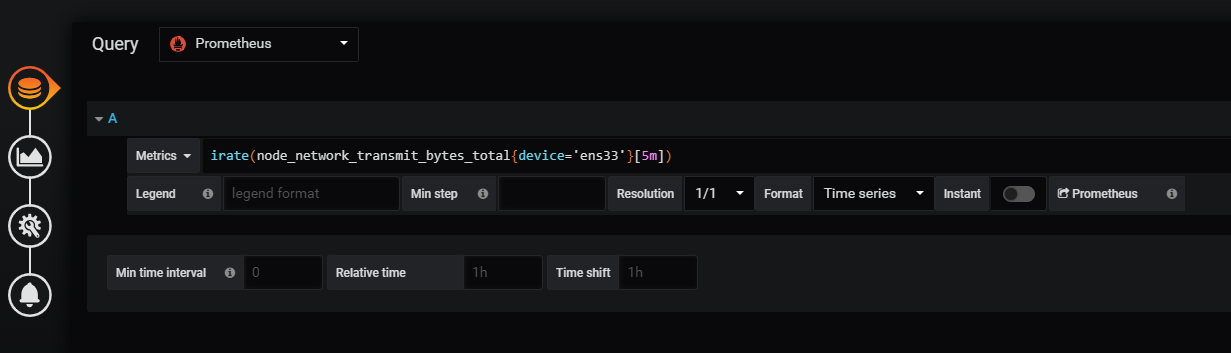
9.添加网络出使用率图形
Metrics输入
irate(node_network_transmit_bytes_total{device='ens33'}[5m])
10.查看完整Dashboard

Promethues告警rules
#rules.linux.yml
groups:
- name: Node-Alert
  rules:
  - alert: Instance-Down #告警名称
    expr: up == 0
    for: 1m #持续多久后发送
    labels:
      severity: warning
    annotations: #信息
      summary: "Instance {{$labels.instance}} down"
      description: "{{$labels.instance}}: job {{$labels.job}} has been down for more than 1 minutes."

  - alert: "内存使用率过高"
    expr: round(100- node_memory_MemAvailable_bytes/node_memory_MemTotal_bytes*100) > 80
    for: 1m
    labels:
      severity: warning
    annotations:
      summary: "{{ $labels.instance }}内存使用率过高"
      description: "{{ $labels.instance }}当前使用率{{ $value }}%"

  - alert: "CPU使用率过高"
    expr: round(100 - ((avg by (instance,job)(irate(node_cpu_seconds_total{mode="idle",instance!~'bac-.*'}[5m]))) *100)) > 85
    for: 2m
    labels:
      severity: warning
    annotations:
      summary: "{{ $labels.instance }}CPU使用率过高"
      description: "{{ $labels.instance }}当前使用率{{ $value }}%"

  - alert: "磁盘使用率过高"
    expr: round(100-100*(node_filesystem_avail_bytes{fstype=~"ext4|xfs"} / node_filesystem_size_bytes{fstype=~"ext4|xfs"})) > 80
    for: 15s
    labels:
      severity: warning
    annotations:
      summary: "{{ $labels.instance }}磁盘使用率过高"
      description: "{{ $labels.instance }}当前磁盘{{$labels.mountpoint}} 使用率{{ $value }}%"

  - alert: "分区容量过低"
    expr: round(node_filesystem_avail_bytes{fstype=~"ext4|xfs",instance!~"testnode",mountpoint!~"/boot.*"}/1024/1024/1024) < 10
    for: 15s
    labels:
      severity: warning
    annotations:
      summary: "{{ $labels.instance }}分区容量过低"
      description: "{{ $labels.instance }}当前分区为“{{$labels.mountpoint}} ” 剩余容量{{ $value }}GB"

  - alert: "网络流出速率过高"
    expr: round(irate(node_network_receive_bytes_total{instance!~"data.*",device!~'tap.*|veth.*|br.*|docker.*|vir.*|lo.*|vnet.*'}[1m])/1024) > 2048
    for: 1m
    labels:
      severity: warning
    annotations:
      summary: "{{ $labels.instance }}网络流出速率过高"
      description: "{{ $labels.instance }}当前速率{{ $value }}KB/s"
alertmanager.yml
global:
  resolve_timeout: 5m
  smtp_smarthost: "smtp.163.com:25"
  smtp_from: "wsl.********@163.com"
  smtp_auth_username: "wsl.********@163.com"
  smtp_auth_password: "HW**********KGM"
  smtp_require_tls: false
route:
  group_by: ['alertname']
  group_wait: 10s
  group_interval: 10s
  repeat_interval: 1m
  #receiver: 'web.hook'
  receiver: 'mail'
receivers:
#- name: 'web.hook'
#  webhook_configs:
#  - url: 'http://127.0.0.1:5001/'
- name: "mail"
  email_configs:
  - to: "645******08@qq.com"
Email configuration
咱们这里选择 email 告警,首先修改 grafana 的配置文件 /etc/grafana/grafana.ini,找到 SMTP 部分,修改成以下:node
[smtp]
;enabled = false
enabled = true
;host = localhost:25
host = smtp.exmail.qq.com:25
;user =
user = notice@wzlinux.com
# If the password contains # or ; you have to wrap it with triple quotes. Ex """#password;"""
;password =
password = Q7P1hsdfsenzzyM
;cert_file =
;key_file =
;skip_verify = false
;from_address = admin@grafana.localhost
from_address = notice@wzlinux.com
from_name = Grafana
# EHLO identity in SMTP dialog (defaults to instance_name)
;ehlo_identity = dashboard.example.com
修改完成后,重启 grafana。linux
Notification channels
登录到 grafana 中,建立一个通知渠道,测试一下,看看是否收到邮件。

- Name - Enter a name for this channel. It will be displayed when users add notifications to alert rules.
- Type - Select the channel type. Refer to the List of supported notifiers for details.
- Default (send on all alerts) - When selected, this option sends a notification on this channel for all alert rules.
- Include Image - See Enable images in notifications for details.
- Disable Resolve Message - When selected, this option disables the resolve message [OK] that is sent when the alerting state returns to false.
- Send reminders - When this option is checked additional notifications (reminders) will be sent for triggered alerts. You can specify how often reminders should be sent using number of seconds (s), minutes (m) or hours (h), for example
30s,3m,5mor1h.
Create alerts
grafana 不支持带有变量的模板报警,因此咱们须要建立一个不带有变量的模板,这个咱们能够去官方的 dashboard 中找一个,我这里找到编号为5984,你们能够安装这个模板。

我在里面简单修改了一下格式,以及数据源,主要是针对 CPU 的负载修改了一下,其余资源默承认以使用。测试
[外链图片转存失败,源站可能有防盗链机制,建议将图片保存下来直接上传(img-zodkMmSh-1656907272546)(https://resource.shangmayuan.com/droxy-blog/2021/01/10/51cca8464afd49049fbf8c83d520c5c9-1.jpg)]
我这边已经测试过了,没有什么问题,报警均可以正常运行,我把 promSQL 贴出来this
CPU:
100 - (avg by (instance) (irate(node_cpu_seconds_total{mode="idle"}[5m])) * 100)
legend 设置为{{instance}}3d
内存:
100*(node_memory_MemTotal_bytes - node_memory_MemFree_bytes - node_memory_Buffers_bytes - node_memory_Cached_bytes) / node_memory_MemTotal_bytes
legend 设置为{{instance}}code
存储:
100.0 - 100 * ((node_filesystem_avail_bytes / 1000 / 1000 ) / (node_filesystem_size_bytes / 1024 / 1024))
legend 设置为 {{instance}} - {{mountpoint}}blog


 1921
1921


 被折叠的 条评论
为什么被折叠?
被折叠的 条评论
为什么被折叠?
 到【灌水乐园】发言


