


 本文详细介绍了使用Pandas进行数据处理的步骤,包括了解数据、选取列、删除列、过滤行数据、数值编码以及数据拆分。通过实例展示了如何根据条件查询、筛选全职工作人员,并对教育程度、工作类别等数值进行可读性转换。最后,讨论了如何划分训练和测试数据集。
引言
本文主要介绍Pandas 数据处理,通过条件查询,过滤获取子集数据,并对数据进行一些数值转换,以及数据拆分。更多 Python 进阶系列文章,请参考 Python 进阶学习 玩转数据系列
内容提要:
- 了解熟悉数据
- 选取感兴趣的列数据
- 删除 (Dropping) 列数据
- 通过 df.query() 过滤行数据
- 基于条件子集过滤数据
- 将数字型的值编码成可描述的
- 数据拆分
了解熟悉数据
拿到一份数据时,我们可以通过下面几个步骤来了解熟悉数据:
-
利用 pd.read_csv() 或 pd.read_csv 函数将数据加载到 Pandas DataFrame
-
利用 pandas 一些函数属性了解数据大概信息
.shape–>数据行列数
.head(n) --> 前 n 条数据信息
.columns --> 列名 -
通过.describe() 查看统计信息,观察这一系列数据的范围、大小、波动趋势等等。
统计值变量说明:count:数量统计,此列共有多少有效值
std:标准差
min:最小值
25%:四分之一分位数
50%:二分之一分位数
75%:四分之三分位数
max:最大值
mean:均值
举例:
一份匿名的人口普查数据。其中包括以下信息:
● AGEP: 年龄
● COW: 就业,如:盈利公司,非盈利公司
● SCHL: 教育程度,如:小学文凭,高中文凭,大学文凭
● SEX: 性别
import pandas as pd

df = pd.read_csv("../Python_data_wrangling/Python_data_wrangling_data_raw/data_raw/census_us.csv")

print("df.shape:{}".format(df.shape))

df_3_row = df.head(3)
print("df_3_row:\n{}".format(df_3_row))
print("df.columns:\n{}".format(df.columns))

# Examine the summary statistics only for a select subset of variables of interest
vars =["AGEP", "COW", "SCHL", "SEX"]
static_df = df[vars].describe()
print("static_df:\n{}".format(static_df))
输出:
df.shape:(6279, 288)
df_3_row:
   ORIGFILEROWNUMBER                  ORIGFILENAME           ORIGINSERTTIME  ...  PWGTP78 PWGTP79  PWGTP80
0                  1  file:csv_pus/ss11pusa.csv.gz  2013-02-12 17:04:40.875  ...        5       6        5
1                386  file:csv_pus/ss11pusa.csv.gz  2013-02-12 17:04:40.875  ...      423     211      220
2                387  file:csv_pus/ss11pusa.csv.gz  2013-02-12 17:04:40.875  ...      291     167      192

[3 rows x 288 columns]
df.columns:
Index(['ORIGFILEROWNUMBER', 'ORIGFILENAME', 'ORIGINSERTTIME', 'ORIGRANDGROUP',
       'RT', 'SERIALNO', 'SPORDER', 'PUMA', 'ST', 'ADJINC',
       ...
       'PWGTP71', 'PWGTP72', 'PWGTP73', 'PWGTP74', 'PWGTP75', 'PWGTP76',
       'PWGTP77', 'PWGTP78', 'PWGTP79', 'PWGTP80'],
      dtype='object', length=288)
static_df:
              AGEP          COW         SCHL          SEX
count  6279.000000  3668.000000  6049.000000  6279.000000
mean     40.201306     2.182388    15.637130     1.511546
std      23.686748     1.987072     5.532888     0.499906
min       0.000000     1.000000     1.000000     1.000000
25%      20.000000     1.000000    13.000000     1.000000
50%      40.000000     1.000000    16.000000     2.000000
75%      59.000000     3.000000    19.000000     2.000000
max      95.000000     9.000000    24.000000     2.000000
选取感兴趣的列数据
有两种方法选择数据的子集,只保留少量的列数据
- 通过列索引 df[column name list]
- 通过 df.filter(items=column list) 方法
举例:
import pandas as pd

df = pd.read_csv("../Python_data_wrangling/Python_data_wrangling_data_raw/data_raw/census_us.csv")

vars_2_keep =["AGEP", "COW", "SCHL", "SEX", "PINCP", "ESR", "PERNP", "WKHP",  "PWGTP1"]

subset_df = df[vars_2_keep]
print("subset_df.shape:{}".format(subset_df.shape))
print("subset_df.head():\n{}".format(subset_df.head()))

subset_df_filter = df.filter(items=vars_2_keep)
print("subset_df_filter.shape:{}".format(subset_df_filter.shape))
print("subset_df_filter.head():\n{}".format(subset_df_filter.head()))
输出:
subset_df.shape:(6279, 9)
subset_df.head():
   AGEP  COW  SCHL  SEX    PINCP  ESR    PERNP  WKHP  PWGTP1
0    19  NaN  19.0    2      0.0  6.0      0.0   NaN       5
1    43  1.0  19.0    1  22900.0  1.0  22900.0  40.0     233
2    51  3.0  16.0    2  17800.0  1.0  17800.0  35.0     242
3    16  NaN  13.0    1   3400.0  6.0      0.0   NaN     172
4    55  1.0  19.0    1  56800.0  1.0  20800.0  50.0      18
subset_df_filter.shape:(6279, 9)
subset_df_filter.head():
   AGEP  COW  SCHL  SEX    PINCP  ESR    PERNP  WKHP  PWGTP1
0    19  NaN  19.0    2      0.0  6.0      0.0   NaN       5
1    43  1.0  19.0    1  22900.0  1.0  22900.0  40.0     233
2    51  3.0  16.0    2  17800.0  1.0  17800.0  35.0     242
3    16  NaN  13.0    1   3400.0  6.0      0.0   NaN     172
4    55  1.0  19.0    1  56800.0  1.0  20800.0  50.0      18
删除 (Dropping) 列数据
某些列数据有太多缺失的值,需要丢弃一些列数据,方便更深入的分析剩下的数据。可以通过下面方法删除一些不感兴趣的列数据:
- del df[columns]
- df.drop(columns,axis=1)
举例:
import pandas as pd

df = pd.read_csv("../Python_data_wrangling/Python_data_wrangling_data_raw/data_raw/census_us.csv")
print("df.shape:{}".format(df.shape))

vars_2_keep =["AGEP", "COW", "SCHL", "SEX", "PINCP", "ESR", "PERNP", "WKHP",  "PWGTP1"]

subset_df = df[vars_2_keep]
print("subset_df.shape:{}".format(subset_df.shape))
del subset_df["SEX"]
print("subset_df.shape after del subset_df['SEX']:\n{}".format(subset_df.shape))

vars_2_drop =["AGEP", "COW", "SEX"]
census_dropped=df.drop(vars_2_drop,axis=1)

print("census_dropped.shape after dropping ['AGEP', 'COW', 'SEX'] :{}".format(census_dropped.shape))
输出:
df.shape:(6279, 288)
subset_df.shape:(6279, 9)
subset_df.shape after del subset_df['SEX']:
(6279, 8)
census_dropped.shape after dropping ['AGEP', 'COW', 'SEX'] :(6279, 285)
通过 df.query() 过滤行数据
有时为了方便数据分析,需要过滤一些行数据。
举例:ggplot 中的 diamonds数据包,原数据某些列数据的图形分布不均匀,可通过过滤一些无效数据,使得数据更集中。
原数据图形分析:
import pandas as pd
from ggplot import diamonds
import matplotlib.pyplot as plt

df = diamonds.head()
print("df:\n{}".format(df))

plt.plot(diamonds.x,diamonds.y,'o')
plt.xlabel("x")
plt.ylabel("y")
plt.show()
输出:
diamonds.shape:(53940, 10)
diamonds.head():
   carat      cut color clarity  depth  table  price     x     y     z
0   0.23    Ideal     E     SI2   61.5   55.0    326  3.95  3.98  2.43
1   0.21  Premium     E     SI1   59.8   61.0    326  3.89  3.84  2.31
2   0.23     Good     E     VS1   56.9   65.0    327  4.05  4.07  2.31
3   0.29  Premium     I     VS2   62.4   58.0    334  4.20  4.23  2.63
4   0.31     Good     J     SI2   63.3   58.0    335  4.34  4.35  2.75
生成的 x,y 列的数据图形分布:
可以看出有一些零星的数据分布比较散,还有一些数值为 0 的无效值。
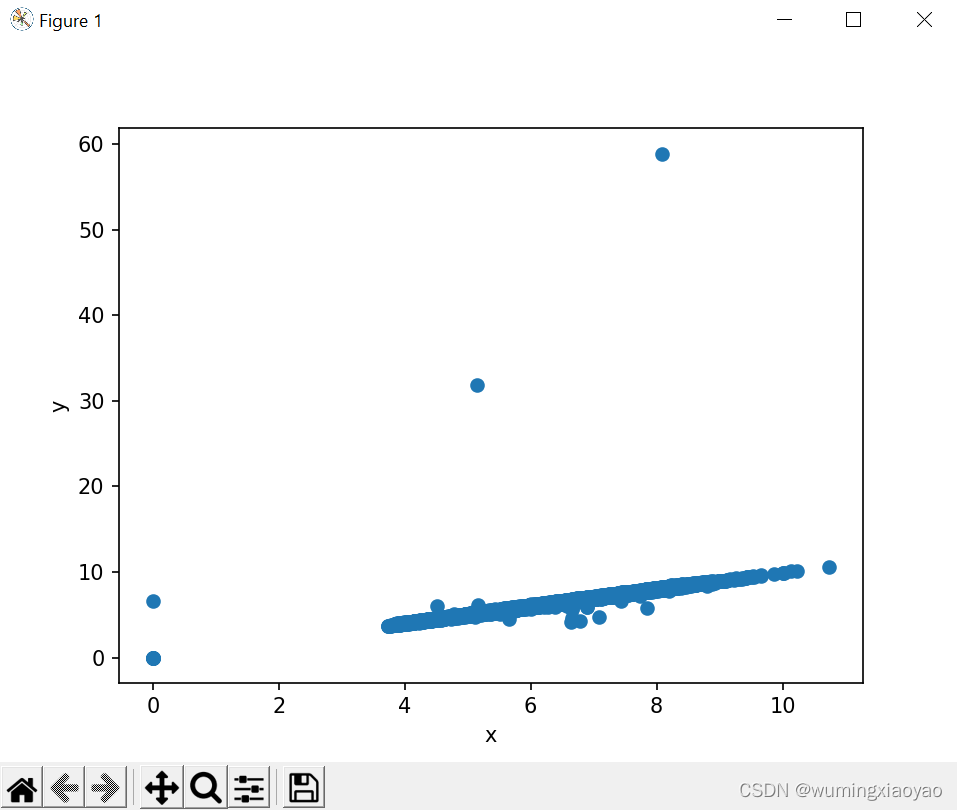
加上 query 处理:q = ‘x>0 & y>0 & y<20’
import pandas as pd
from ggplot import diamonds
import matplotlib.pyplot as plt

df = diamonds.head()
print("diamonds.shape:{}".format(diamonds.shape))
print("diamonds.head():\n{}".format(df))

q = 'x>0 & y>0 & y<20'
diamonds_filtered = diamonds.query(q)

plt.plot(diamonds_filtered.x, diamonds_filtered.y,'o')
plt.xlabel("x")
plt.ylabel("y")
plt.show()
输出:
diamonds.shape:(53940, 10)
diamonds.head():
   carat      cut color clarity  depth  table  price     x     y     z
0   0.23    Ideal     E     SI2   61.5   55.0    326  3.95  3.98  2.43
1   0.21  Premium     E     SI1   59.8   61.0    326  3.89  3.84  2.31
2   0.23     Good     E     VS1   56.9   65.0    327  4.05  4.07  2.31
3   0.29  Premium     I     VS2   62.4   58.0    334  4.20  4.23  2.63
4   0.31     Good     J     SI2   63.3   58.0    335  4.34  4.35  2.75
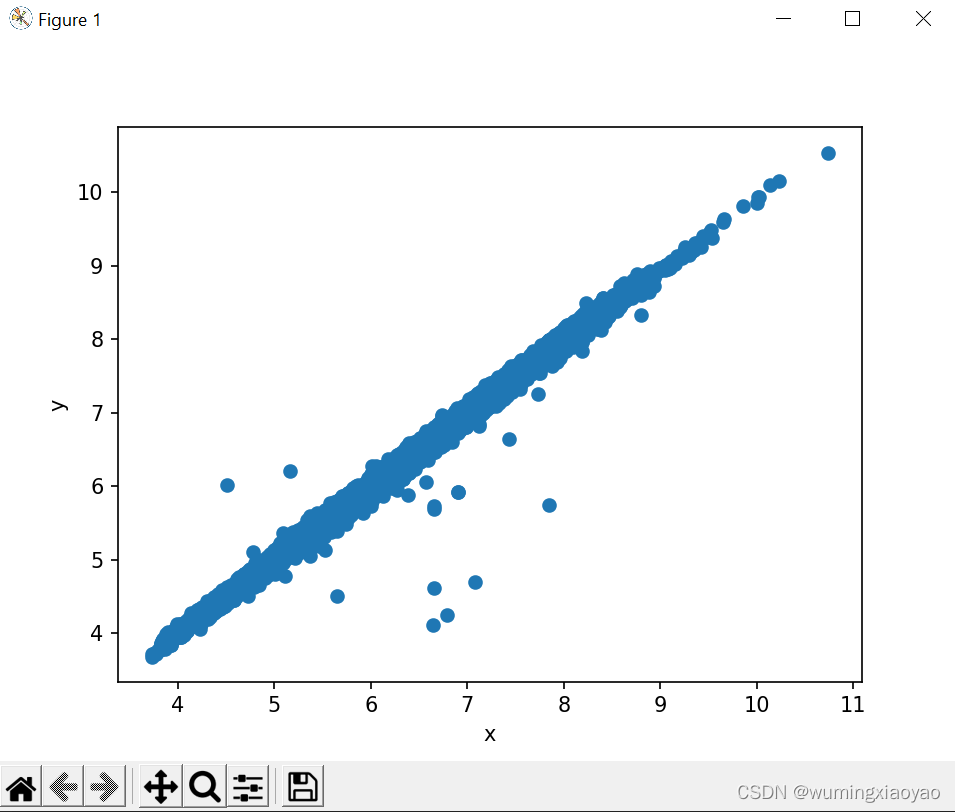
x,y 列的数据图形表示:
现在的图就分布比较均匀了。
基于条件子集过滤数据
还是拿前面人口普查的例子,想了解全职上班人员的信息。可以通过下面几个步骤:
-
创建条件集,列出需要满足的条件:
● 员工自述(COW)
● 一个星期至少工作 40 小时 (WKHP)
● 员工年龄范围 20-50 (AGEP)
● 员工年收入范围 (PINCP and PERNP) $1,000 到 $250,000 之间. -
添加一个新的指标变量 is_stdworker 用来判断是否满足我们上面定义的条件(如:TRUE or FALSE)
-
用 df.query() 方法基于 is_stdworker 指标变量的值过滤数据,选出符合条件的数据。
代码:
import pandas as pd
import numpy as np


census = pd.read_csv("../Python_data_wrangling/Python_data_wrangling_data_raw/data_raw/census_us.csv")
print("census.shape:{}".format(census.shape))

x = range(1,25)
y = range(1,8)
# Defining the conditions and creating a Boolean indicator variable: is_stdworker
census['is_stdworker']=np.where((census.PINCP > 1000) & (census.PINCP <= 250000) &\
                                (census.PERNP > 1000) & (census.PERNP <= 250000) &\
                                (census.AGEP >= 20) & (census.AGEP <= 50) & \
                                (census.ESR == 1) & (census.WKHP >= 40)& (census.PWGTP1 > 0) &\
                                (census.COW.isin(y).any()) & (census.SCHL.isin(x).any())\
                                ,True,False)

print("census['is_stdworker'].head():\n{}".format(census['is_stdworker'].head()))

# Filter the full data using the df.query() method based on the value of the indicator variable

stdworkers = census.query('is_stdworker==True')
print("stdworkers:{}".format(stdworkers.shape))
输出:
census.shape:(6279, 288)
census['is_stdworker'].head():
0    False
1     True
2    False
3    False
4    False
Name: is_stdworker, dtype: bool
stdworkers:(1225, 289)
将数字型的值编码成可描述的 Re-encoding Numeric Values as Descriptive
为了提高可读性,把一些数字型的值转换成描述型的值。但是要确保不要破坏原数据,建议copy 一份数据做一些改变。
例如:
将性别的值从 1/2 变成 M/F
将员工工作类别标号变得更可读性
将受教育等级变得更可读性
例子: 将性别的值从 1/2 变成 M/F
conversions={“SEX”:{1:“M”,2:“F”}}
stdworkers_copy.replace(conversions,inplace=True)
import pandas as pd
import numpy as np


census = pd.read_csv("../Python_data_wrangling/Python_data_wrangling_data_raw/data_raw/census_us.csv")
print("census.shape:{}".format(census.shape))

x =range(1,25)
y = range(1,8)
# Defining the conditions and creating a Boolean indicator variable: is_stdworker
census['is_stdworker']=np.where((census.PINCP > 1000) & (census.PINCP <= 250000) &\
                                (census.PERNP > 1000) & (census.PERNP <= 250000) &\
                                (census.AGEP >= 20) & (census.AGEP <= 50) & \
                                (census.ESR == 1) & (census.WKHP >= 40)& (census.PWGTP1 > 0) &\
                                (census.COW.isin(y).any()) & (census.SCHL.isin(x).any())\
                                ,True,False)

# Filter the full data using the df.query() method based on the value of the indicator variable

stdworkers = census.query('is_stdworker==True')
print("stdworkers.shape:{}".format(stdworkers.shape))

stdworkers_copy = stdworkers.copy()
print("stdworkers_copy.SEX.head():\n{}".format(stdworkers_copy.SEX.head()))

conversions={"SEX":{1:"M",2:"F"}}
stdworkers_copy.replace(conversions,inplace=True)

# astype as category to do statistic by catetory
stdworkers_copy.SEX=stdworkers_copy.SEX.astype('category')
print("after replace stdworkers_copy.SEX.head():\n{}".format(stdworkers_copy.SEX.head()))
print("stdworkers_copy.SEX.describe():\n{}".format(stdworkers_copy.SEX.describe()))
输出:
census.shape:(6279, 288)
stdworkers.shape:(1225, 289)
stdworkers_copy.SEX.head():
1     1
9     2
15    2
27    1
32    2
Name: SEX, dtype: int64
after replace stdworkers_copy.SEX.head():
1     M
9     F
15    F
27    M
32    F
Name: SEX, dtype: category
Categories (2, object): ['F', 'M']
stdworkers_copy.SEX.describe():
count     1225
unique       2
top          M
freq       720
Name: SEX, dtype: object
将员工工作类别标号变得更可读性
import pandas as pd
import numpy as np
census = pd.read_csv("../Python_data_wrangling/Python_data_wrangling_data_raw/data_raw/census_us.csv")
print("census.shape:{}".format(census.shape))
x =range(1,25)
y = range(1,8)
# Defining the conditions and creating a Boolean indicator variable: is_stdworker
census['is_stdworker']=np.where((census.PINCP > 1000) & (census.PINCP <= 250000) &\
(census.PERNP > 1000) & (census.PERNP <= 250000) &\
(census.AGEP >= 20) & (census.AGEP <= 50) & \
(census.ESR == 1) & (census.WKHP >= 40)& (census.PWGTP1 > 0) &\
(census.COW.isin(y).any()) & (census.SCHL.isin(x).any())\
,True,False)
# Filter the full data using the df.query() method based on the value of the indicator variable
stdworkers = census.query('is_stdworker==True')
print("stdworkers.shape:{}".format(stdworkers.shape))
stdworkers_copy = stdworkers.copy()
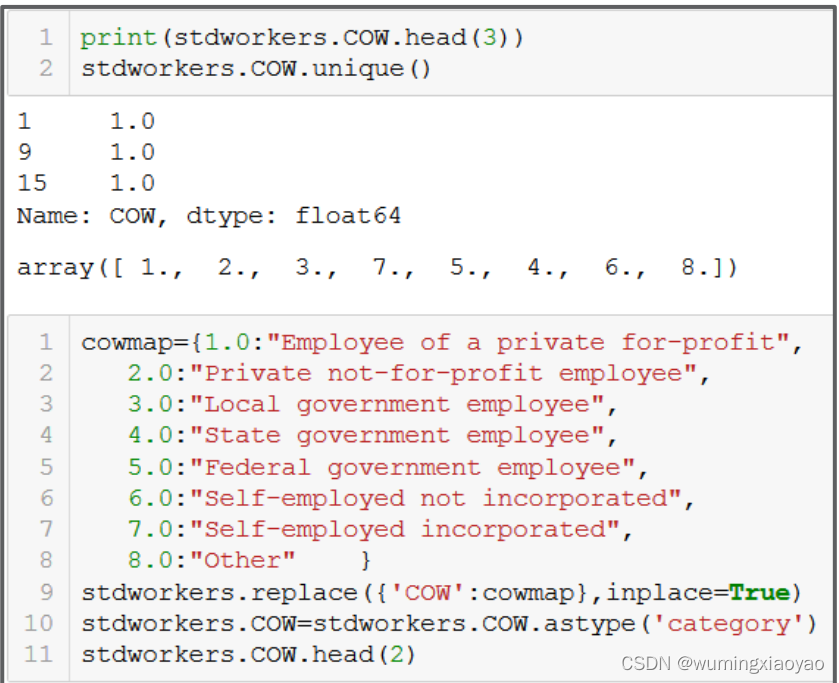
print("stdworkers_copy.COW.head():\n{}".format(stdworkers_copy.COW.head()))
print("stdworkers.COW.unique():{}".format(stdworkers.COW.unique()))
cowmap={1.0:"Employee of a private for-profit",
2.0:"Private not-for-profit employee",
3.0:"Local government employee",
4.0:"State government employee",
5.0:"Federal government employee",
6.0:"Self-employed not incorporated",
7.0:"Self-employed incorporated",
8.0:"Other" }
stdworkers_copy.replace({'COW':cowmap},inplace=True)
# astype as category to do statistic by catetory
stdworkers_copy.COW=stdworkers_copy.COW.astype('category')
print("after replace stdworkers_copy.COW.head():\n{}".format(stdworkers_copy.COW.head()))
print("stdworkers_copy.COW.describe():\n{}".format(stdworkers_copy.COW.describe()))
输出:
census.shape:(6279, 288)
stdworkers.shape:(1225, 289)
stdworkers_copy.COW.head():
1     1.0
9     1.0
15    1.0
27    1.0
32    1.0
Name: COW, dtype: float64
stdworkers.COW.unique():[1. 2. 3. 7. 5. 4. 6. 8.]
after replace stdworkers_copy.COW.head():
1     Employee of a private for-profit
9     Employee of a private for-profit
15    Employee of a private for-profit
27    Employee of a private for-profit
32    Employee of a private for-profit
Name: COW, dtype: category
Categories (8, object): ['Employee of a private for-profit', 'Federal government employee',
                         'Local government employee', 'Other', 'Private not-for-profit employee',
                         'Self-employed incorporated', 'Self-employed not incorporated',
                         'State government employee']
stdworkers_copy.COW.describe():
count                                 1225
unique                                   8
top       Employee of a private for-profit
freq                                   842
Name: COW, dtype: object
将受教育等级变得更可读性
列举所有的 SCHL 教育等级,发现有太多等级,我们可以考虑合并一些低等级的。
代码:
import pandas as pd
import numpy as np
census = pd.read_csv("../Python_data_wrangling/Python_data_wrangling_data_raw/data_raw/census_us.csv")
print("census.shape:{}".format(census.shape))
x =range(1,25)
y = range(1,8)
# Defining the conditions and creating a Boolean indicator variable: is_stdworker
census['is_stdworker']=np.where((census.PINCP > 1000) & (census.PINCP <= 250000) &\
(census.PERNP > 1000) & (census.PERNP <= 250000) &\
(census.AGEP >= 20) & (census.AGEP <= 50) & \
(census.ESR == 1) & (census.WKHP >= 40)& (census.PWGTP1 > 0) &\
(census.COW.isin(y).any()) & (census.SCHL.isin(x).any())\
,True,False)
# Filter the full data using the df.query() method based on the value of the indicator variable
stdworkers = census.query('is_stdworker==True')
print("stdworkers.shape:{}".format(stdworkers.shape))
stdworkers_copy = stdworkers.copy()
print("stdworkers_copy.SCHL.head():\n{}".format(stdworkers_copy.SCHL.head()))
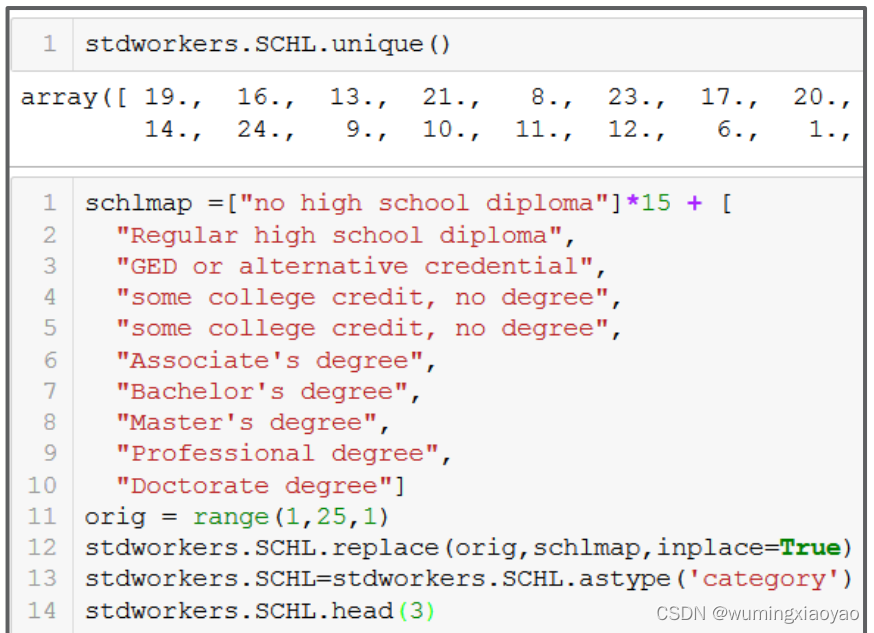
print("stdworkers.SCHL.unique():{}".format(stdworkers.SCHL.unique()))
schlmap =["no high school diploma"]*15 + [
"Regular high school diploma",
"GED or alternative credential",
"some college credit, no degree",
"some college credit, no degree",
"Associate's degree",
"Bachelor's degree",
"Master's degree",
"Professional degree",
"Doctorate degree"]
orig = range(1,25,1)
stdworkers_copy.SCHL.replace(orig,schlmap,inplace=True)
# astype as category to do statistic by catetory
stdworkers_copy.SCHL=stdworkers_copy.SCHL.astype('category')
print("after replace stdworkers_copy.SCHL.head():\n{}".format(stdworkers_copy.SCHL.head()))
print("stdworkers_copy.SCHL.describe():\n{}".format(stdworkers_copy.SCHL.describe()))
输出:
census.shape:(6279, 288)
stdworkers.shape:(1225, 289)
stdworkers_copy.SCHL.head():
1     19.0
9     19.0
15    16.0
27    13.0
32    19.0
Name: SCHL, dtype: float64
stdworkers.SCHL.unique():[19. 16. 13. 21.  8. 23. 17. 20. 22. 15. 18. 14. 24.  9. 10. 11. 12.  6.
  1.  7.  5.]
after replace stdworkers_copy.SCHL.head():
1     some college credit, no degree
9     some college credit, no degree
15       Regular high school diploma
27            no high school diploma
32    some college credit, no degree
Name: SCHL, dtype: category
Categories (9, object): ['Associate's degree', 'Bachelor's degree', 'Doctorate degree',
                         'GED or alternative credential', ..., 'Professional degree', 'Regular high school diploma',
                         'no high school diploma', 'some college credit, no degree']
stdworkers_copy.SCHL.describe():
count                            1225
unique                              9
top       Regular high school diploma
freq                              292
Name: SCHL, dtype: object
数据拆分:训练数据和测试数据
数据分析时,有时需要划分成训练数据和测试数据。训练数据用来建模,用来预测员工收入。测试数据用来测试模型。
首先新加一列 flag index,用 numpy.random.uniform() 产生[0, 1] 范围内正态分布的随机数。这个值将用来划分数据。
假设 90% 的数据用来作为训练数据集,剩下 10% 的数据用来作为测试数据集。
import pandas as pd
import numpy as np


census = pd.read_csv("../Python_data_wrangling/Python_data_wrangling_data_raw/data_raw/census_us.csv")
print("census.shape:{}".format(census.shape))

x =range(1,25)
y = range(1,8)
# Defining the conditions and creating a Boolean indicator variable: is_stdworker
census['is_stdworker']=np.where((census.PINCP > 1000) & (census.PINCP <= 250000) &\
                                (census.PERNP > 1000) & (census.PERNP <= 250000) &\
                                (census.AGEP >= 20) & (census.AGEP <= 50) & \
                                (census.ESR == 1) & (census.WKHP >= 40)& (census.PWGTP1 > 0) &\
                                (census.COW.isin(y).any()) & (census.SCHL.isin(x).any())\
                                ,True,False)

# Filter the full data using the df.query() method based on the value of the indicator variable

stdworkers = census.query('is_stdworker==True')
print("stdworkers.shape:{}".format(stdworkers.shape))

stdworkers_copy = stdworkers.copy()

stdworkers_copy['flag']= np.random.uniform(0,1,len(stdworkers_copy))
dtrain = stdworkers_copy[stdworkers_copy['flag']>=0.1]
dtest = stdworkers_copy[stdworkers_copy['flag']<0.1]

print("dtrain.shape:{}".format(dtrain.shape))
print("dtest.shape:{}".format(dtest.shape))

print("dtrain.groupby('COW')['COW'].count():{}".format(dtrain.groupby('COW')['COW'].count()))
print("dtest.groupby('COW')['COW'].count():{}".format(dtest.groupby('COW')['COW'].count()))
输出:
census.shape:(6279, 288)
stdworkers.shape:(1225, 289)
dtrain.shape:(1092, 290)
dtest.shape:(133, 290)
dtrain.groupby('COW')['COW'].count():COW
1.0    746
2.0    108
3.0     81
4.0     45
5.0     42
6.0     36
7.0     33
8.0      1
Name: COW, dtype: int64
dtest.groupby('COW')['COW'].count():COW
1.0    96
2.0    17
3.0     5
4.0     5
5.0     1
6.0     5
7.0     4
Name: COW, dtype: int64


 1854
1854

 被折叠的 条评论
为什么被折叠?
被折叠的 条评论
为什么被折叠?
 到【灌水乐园】发言


