


内容翻译之:Deep Learning - Exercise: Linear Regression
本实验需要亲自动手实现线性回归算法,可以使用matlab(或者octave)进行实现。octave被称为免费版的matlab
1. 下载数据
下载地址:
并提取出数据unzip ex2Data.zip
该压缩文件包含两个文件
fantasy@fantasy-All-Series:~/my_dev/dl_lab/lab1_linear_regression$ ls -l
total 16
-rw------- 1 fantasy fantasy 850 10月 14  2010 ex2x.dat
-rw------- 1 fantasy fantasy 850 10月 14  2010 ex2y.dat
该数据包括2~8岁小孩的身高的度量数据。
ex2x.dat: 是对应身高的小孩的年龄
ex2y.dat: 是升高的数据
各个孩子的身高和年龄组成一个训练实例 ,一共有50个训练样本,用它们训练线性模型
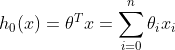
2. 监督式学习问题描述
在该问题中,使用梯度下降方式实现线性回归,在Matlab/Octave中,使用如下方式加载训练集
x = load('ex2x.dat');
y = load('ex2y.dat');
 , 因此
, 因此
 ), 在Matlab/Octave中,运行如下命令绘制训练集
figure % open a new figure window
plot(x, y, 'o');
ylabel('Height in meters')
xlabel('Age in years')
训练集的数据分布图形如下

在进行梯度下降计算之前,需要先加入截距
 , 在Matlab/Octave中,使用如下命令
, 在Matlab/Octave中,使用如下命令
m = length(y); % store the number of training examples
x = [ones(m, 1), x]; % Add a column of ones to x
以下针对该数据,进行线性回归模型训练,
3. 线性回归实现
现在,针对该问题,实现线性回归,从
线性回归模型原理可知
以及批量梯度下降更新规则
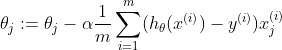
注:什么是批量梯度下降算法
即每次更新θ中的一个元素,需要处理整个输入样本集,所以该算法也叫批量梯度下降(batch gradient descent)
1. 使用学习率
 实现梯度下降,由于matlab/octave的矢量索引从1开始,而不是0,因此在matlab/octave中使用theta(1)和theta(2)表示
 和
和

实现梯度下降,由于matlab/octave的矢量索引从1开始,而不是0,因此在matlab/octave中使用theta(1)和theta(2)表示
和
初始化参数
 (例如,
= 0,
=0),然后从初始化值开始进行梯度下降的一次迭代计算,记录下这次迭代计算的结果
和
。
(例如,
= 0,
=0),然后从初始化值开始进行梯度下降的一次迭代计算,记录下这次迭代计算的结果
和
。
(例如,
= 0,
=0),然后从初始化值开始进行梯度下降的一次迭代计算,记录下这次迭代计算的结果
和
。
2. 继续进行多次的梯度下降迭代计算,直到
 收敛(大概需要进行着1500次左右的迭代计算),
收敛后,记录下最后的
和
。
收敛(大概需要进行着1500次左右的迭代计算),
收敛后,记录下最后的
和
。
收敛(大概需要进行着1500次左右的迭代计算),
收敛后,记录下最后的
和
。
当找到
后,绘制满足训练集的直线。使用如下命令进行绘制
后,绘制满足训练集的直线。使用如下命令进行绘制
hold on % Plot new data without clearing old plot
plot(x(:,2), x*theta, '-') % remember that x is now a matrix with 2 columns
                           % and the second column contains the time info
legend('Training data', 'Linear regression')
注意,对于大部分的机器学习算法,x是高维的数据集(此处是1维的),所以,我们绘制不出来
 ,但在本例中是1维的特征,因此,可以绘制出来,形象的看出结果
3. 最后,利用学到的模型(hypothesis)最未知的一些数据进行预测, 利用训练的模型对年龄为3.5和7的小孩进行身高预测
4. 梯度下降的理解
为了更好的理解梯度下降机制,下面对
 和
和
 的关系进行可视化的处理。在该问题中,
绘制出来是一个3D曲面图(在应用机器学习算法时,通常并不会去绘制
,因为
的关系进行可视化的处理。在该问题中,
绘制出来是一个3D曲面图(在应用机器学习算法时,通常并不会去绘制
,因为
 的维度非常高,以致我们无法使用简单的方法进行绘制可视化的
)
的维度非常高,以致我们无法使用简单的方法进行绘制可视化的
)
和
的关系进行可视化的处理。在该问题中,
绘制出来是一个3D曲面图(在应用机器学习算法时,通常并不会去绘制
,因为
的维度非常高,以致我们无法使用简单的方法进行绘制可视化的
)
由于在本实例中,
 是2维的,因此,我们绘制3维的
来对线性回归算法进行直观的理解。
是2维的,因此,我们绘制3维的
来对线性回归算法进行直观的理解。
是2维的,因此,我们绘制3维的
来对线性回归算法进行直观的理解。
从线性回归原理可以,
的公式为:
的公式为:
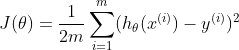
为了获得最佳的观测效果,theta的值的范围使用如下建议的值。 3D曲面图绘制Matlab/Octave代码如下
J_vals = zeros(100, 100);   % initialize Jvals to 100x100 matrix of 0's
theta0_vals = linspace(-3, 3, 100);
theta1_vals = linspace(-1, 1, 100);
for i = 1:length(theta0_vals)
	  for j = 1:length(theta1_vals)
	  t = [theta0_vals(i); theta1_vals(j)];
	  J_vals(i,j) = %% YOUR CODE HERE %%
    end
end

% Plot the surface plot
% Because of the way meshgrids work in the surf command, we need to
% transpose J_vals before calling surf, or else the axes will be flipped
J_vals = J_vals'
figure;
surf(theta0_vals, theta1_vals, J_vals)
xlabel('\theta_0'); ylabel('\theta_1')
最终的3D曲面图如下

5. 代码实现
代码如下:
% Exercise 2 Linear Regression

% Data is roughly based on 2000 CDC growth figures
% for boys
%
% x refers to a boy's age
% y is a boy's height in meters
%

clear all; close all; clc
x = load('ex2x.dat'); y = load('ex2y.dat');

m = length(y); % number of training examples


% Plot the training data
figure; % open a new figure window
plot(x, y, 'o');
ylabel('Height in meters')
xlabel('Age in years')

% Gradient descent
x = [ones(m, 1) x]; % Add a column of ones to x
theta = zeros(size(x(1,:)))'; % initialize fitting parameters
MAX_ITR = 1500;
alpha = 0.07;

for num_iterations = 1:MAX_ITR
    % This is a vectorized version of the
    % gradient descent update formula
    % It's also fine to use the summation formula from the videos

    % Here is the gradient
    grad = (1/m).* x' * ((x * theta) - y);

    % Here is the actual update
    theta = theta - alpha .* grad;

    % Sequential update: The wrong way to do gradient descent
    % grad1 = (1/m).* x(:,1)' * ((x * theta) - y);
    % theta(1) = theta(1) + alpha*grad1;
    % grad2 = (1/m).* x(:,2)' * ((x * theta) - y);
    % theta(2) = theta(2) + alpha*grad2;
end
% print theta to screen
theta

% Plot the linear fit
hold on; % keep previous plot visible
plot(x(:,2), x*theta, 'r-')
legend('Training data', 'Linear regression')
hold off % don't overlay any more plots on this figure

% Closed form solution for reference
% You will learn about this method in future videos
exact_theta = (x' * x)\x' * y

% Predict values for age 3.5 and 7
predict1 = [1, 3.5] *theta
predict2 = [1, 7] * theta


% Calculate J matrix

% Grid over which we will calculate J
theta0_vals = linspace(-3, 3, 100);
theta1_vals = linspace(-1, 1, 100);

% initialize J_vals to a matrix of 0's
J_vals = zeros(length(theta0_vals), length(theta1_vals));

for i = 1:length(theta0_vals)
	  for j = 1:length(theta1_vals)
	  t = [theta0_vals(i); theta1_vals(j)];
	  J_vals(i,j) = (0.5/m) .* (x * t - y)' * (x * t - y);
    end
end

% Because of the way meshgrids work in the surf command, we need to
% transpose J_vals before calling surf, or else the axes will be flipped
J_vals = J_vals';
% Surface plot
figure;
surf(theta0_vals, theta1_vals, J_vals)
xlabel('\theta_0'); ylabel('\theta_1');

% Contour plot
figure;
% Plot J_vals as 15 contours spaced logarithmically between 0.01 and 100
contour(theta0_vals, theta1_vals, J_vals, logspace(-2, 2, 15))
xlabel('\theta_0'); ylabel('\theta_1');
结果:


 486
486


 被折叠的 条评论
为什么被折叠?
被折叠的 条评论
为什么被折叠?
 到【灌水乐园】发言


