


strace - trace system calls and signals
ltrace - A library call tracer
安装
首次使用可能出现这个提示
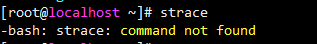
就是没安装。
yum -y install strace
yum -y install ltrace
linux 安装jdk
yum search java|grep jdk
yum install -y java-1.8.0-openjdk
我写了一段简单的 java 代码,并将编译后的 class 文件上传 linux
import java.lang.management.ManagementFactory;
import java.lang.management.RuntimeMXBean;

public class Go {
    public static void main(String[] args) {
        while (true){
            RuntimeMXBean runtime = ManagementFactory.getRuntimeMXBean();
            String name = runtime.getName();
            System.out.println(name);
            System.out.println("good");
            try {

                Thread.sleep(5000);
            } catch (InterruptedException e) {
                e.printStackTrace();
            }
        }
    }
}
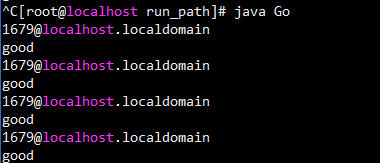
[root@localhost ~]#java Go
启动另一个session
[root@localhost ~]# strace -qo java.1621.strace -p 1679 &
[1] 1696
[root@localhost ~]# tail -f java.1621.strace
运行效果如图:

按Ctrl+Z,

使用fg回到程序

使用Ctrl+C退出程序
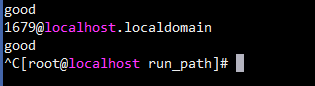
这个过程中另一个 session 中查看strace输出,可以看到程序收到的信号等信息

常用选项
-f : follow forks (除了跟踪当前进程外,还跟踪其子进程)
-o file :send trace output to FILE instead of stderr(将输出信息写到制定的文件file中,而不是显示到标准错误输出[stderr]中)
-p pid :trace process with process id PID, may be repeated(绑定到一个由pid制定的正在运行的进程)
-T : print time spent in each syscall(打印每个系统调用耗费的时间)
-t : print absolute timestamp
示例:

[root@localhost ~]# tail -f java.1621.strace
9154 — SIGTSTP (Stopped) —
9154 — SIGTSTP (Stopped) —
9163 — SIGTSTP (Stopped) —
9162 — SIGTSTP (Stopped) —
9161 — SIGTSTP (Stopped) —
9160 — SIGTSTP (Stopped) —
9159 — SIGTSTP (Stopped) —
9158 — SIGTSTP (Stopped) —
9157 — SIGTSTP (Stopped) —
9156 — SIGTSTP (Stopped) —
9155 — SIGTSTP (Stopped) —
9154 — SIGCONT (Continued) —
9154 — SIGTSTP (Stopped) —
9154 — SIGTSTP (Stopped) —
9163 — SIGTSTP (Stopped) —
9162 — SIGTSTP (Stopped) —
9161 — SIGTSTP (Stopped) —
9160 — SIGTSTP (Stopped) —
9159 — SIGTSTP (Stopped) —
9158 — SIGTSTP (Stopped) —
9157 — SIGTSTP (Stopped) —
9156 — SIGTSTP (Stopped) —
9155 — SIGTSTP (Stopped) —
9154 — SIGCONT (Continued) —
[root@localhost ~]# pstree -H 9154 -p
       ├─sshd(990)─┬─sshd(1431)───bash(1444)───java(9154)─┬─{java}(9155)
       │           │                                      ├─{java}(9156)
       │           │                                      ├─{java}(9157)
       │           │                                      ├─{java}(9158)
       │           │                                      ├─{java}(9159)
       │           │                                      ├─{java}(9160)
       │           │                                      ├─{java}(9161)
       │           │                                      ├─{java}(9162)
       │           │                                      └─{java}(9163)
报错
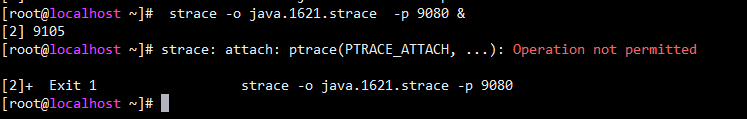
这是因为已经有别的 strace attach 到此 pid 的进程(或者别的程序进行了 ptrace 调用)。查看对应的进程,找到其输出,查看对应输出即可


 138
138


 被折叠的 条评论
为什么被折叠?
被折叠的 条评论
为什么被折叠?
 到【灌水乐园】发言


