


目录
介绍
官网:Prometheus - Monitoring system & time series database
架构图:
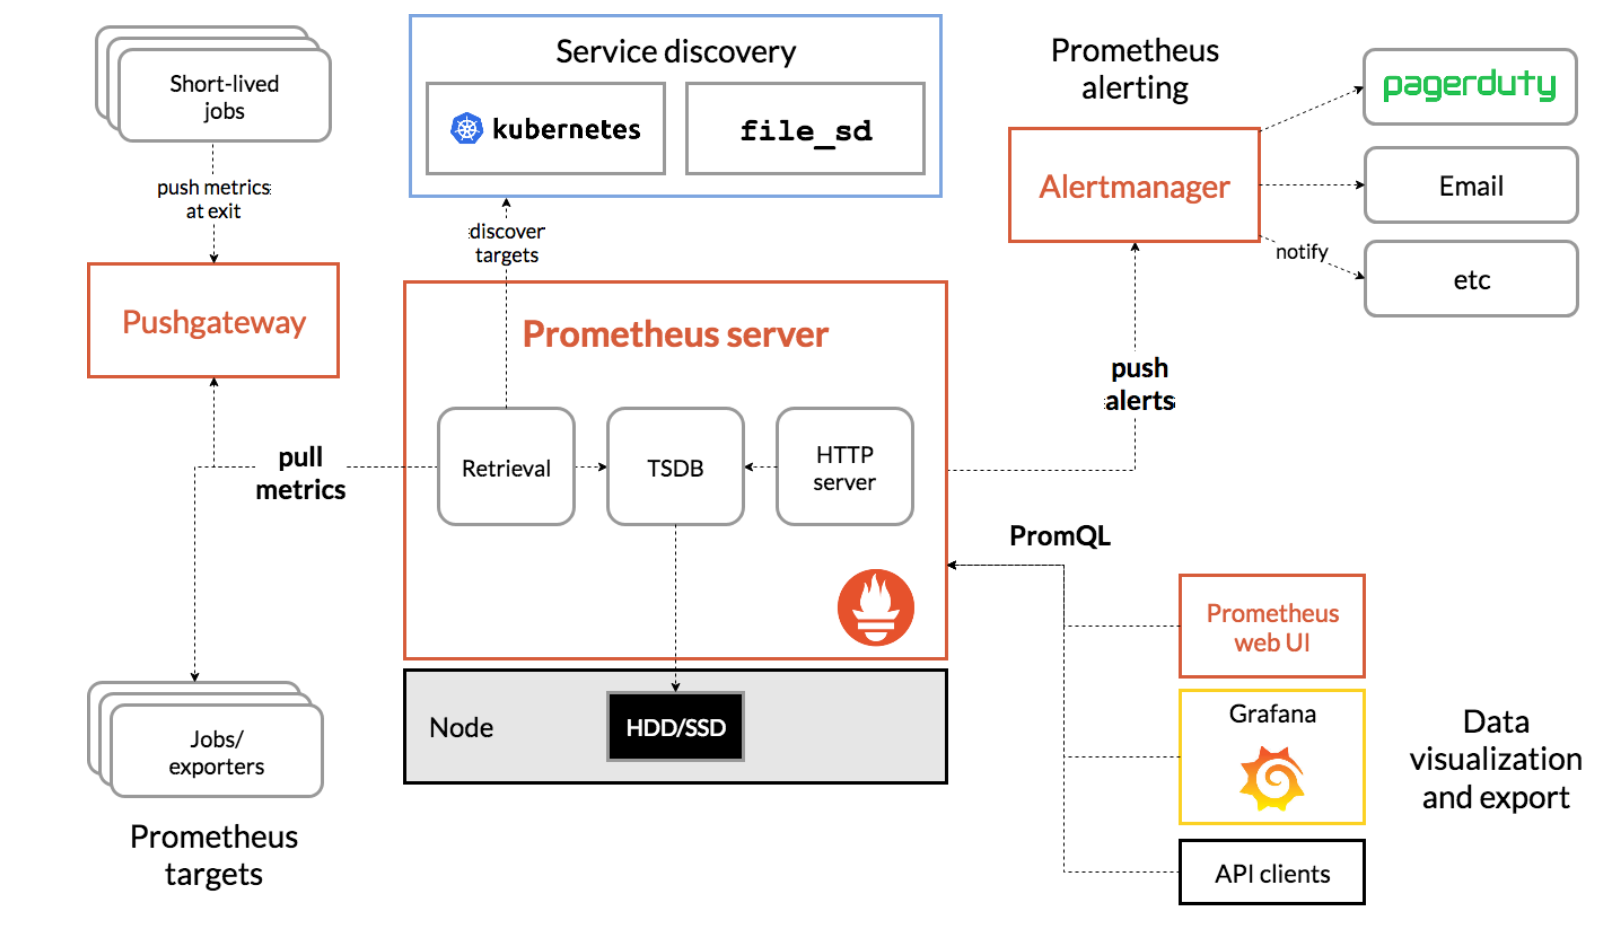
jobs --> 作业,任务 --> 一个运行的程序对应进程 --> 长作业:长时间的工作;
长时间一直运行的程序产生的进程 --》守护进程 --》一直运行,不退出的;
short-lived jobs 短作业:短时间的工作 --》进程;
prometheus targets 被监控的目标--》被监控的服务器;
exporter : 是prometheus的agent(代理),负责收集工作的指标(数据)给prometheus server,是一个一直在被监控主机里运行的一个进程(jobs)。
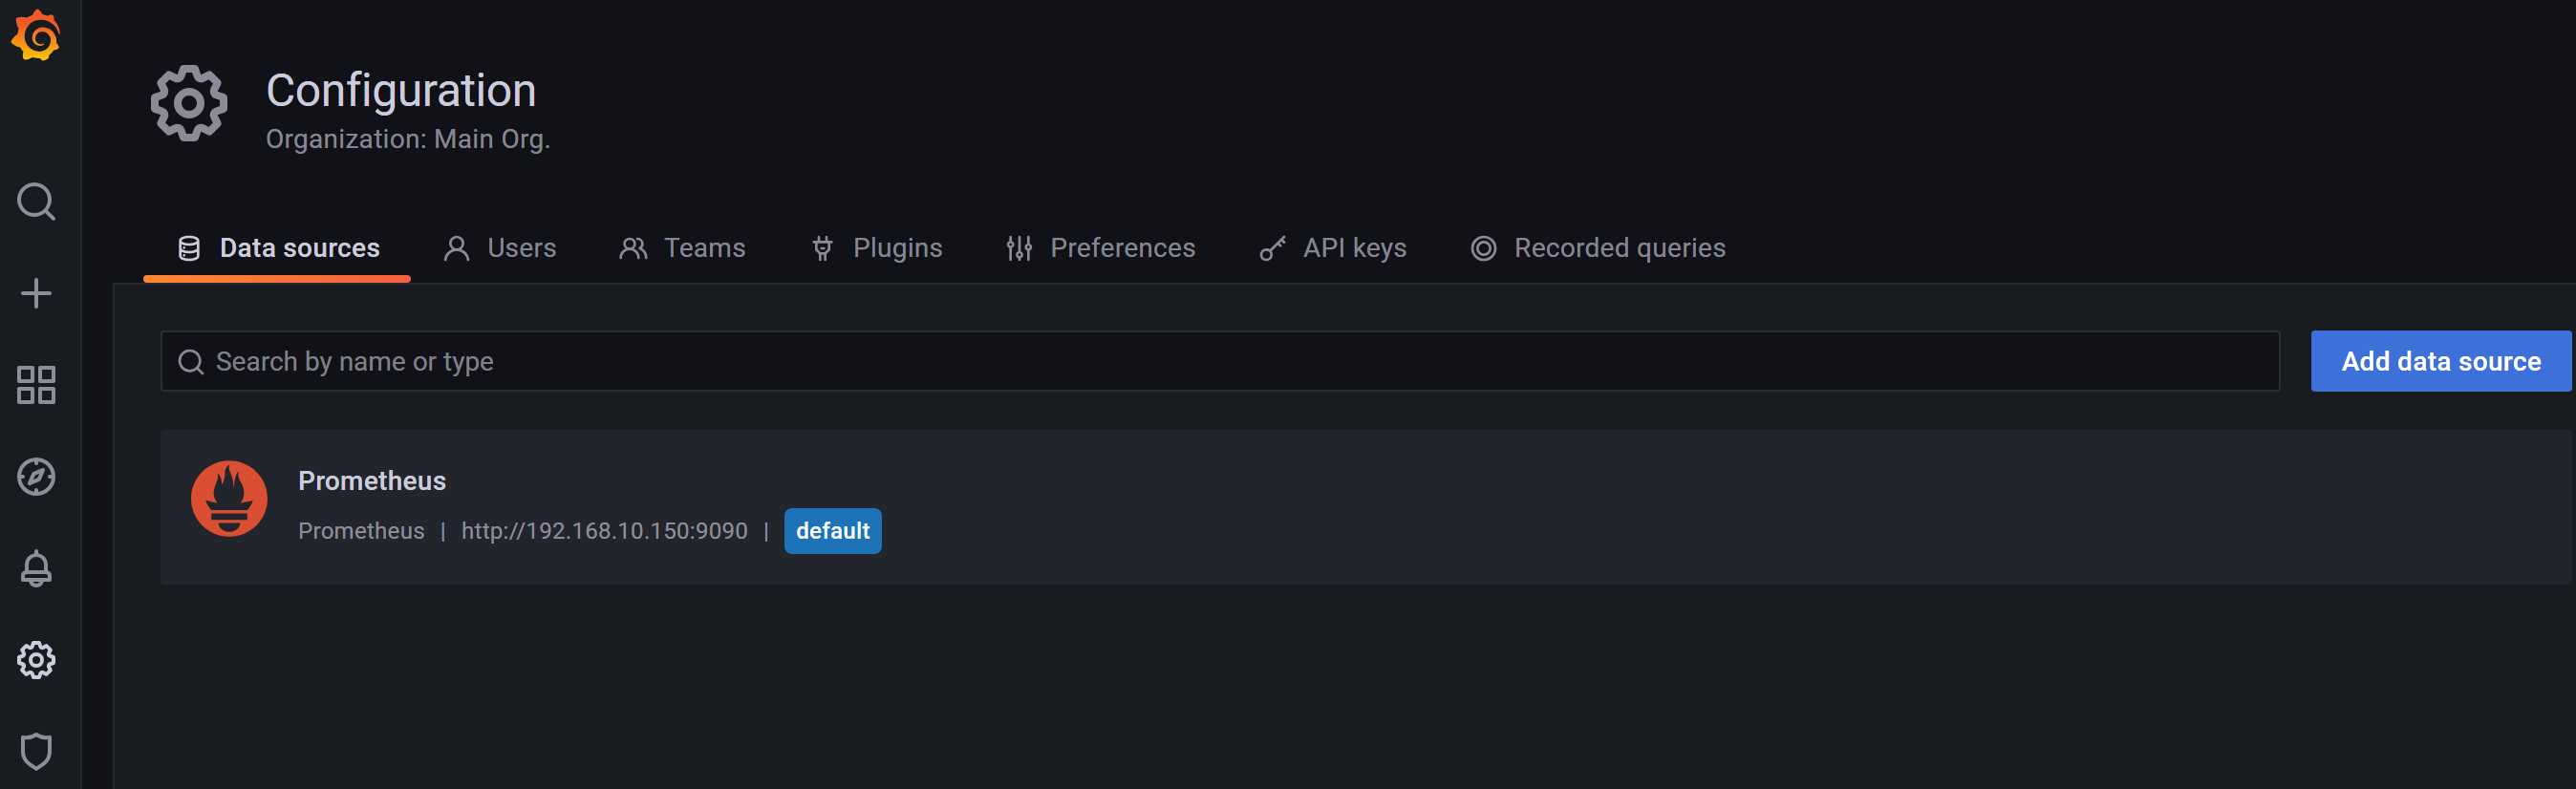
安装和配置
1. 使用容器安装
[root@wcw ~]# docker run  -d -p 9090:9090 --name sc-prometheus-1  prom/prometheus
Unable to find image 'prom/prometheus:latest' locally
latest: Pulling from prom/prometheus
9fa9226be034: Pull complete
1617e25568b2: Pull complete
9b9d79238f8b: Pull complete
106f68af2002: Pull complete
92c2f87eeb17: Pull complete
4f41336c2101: Pull complete
5786756b1404: Pull complete
54cdc7571130: Pull complete
1c14205dd2d7: Pull complete
6440af355f6b: Pull complete
Digest: sha256:339ce86a59413be18d0e445472891d022725b4803fab609069110205e79fb2f1
Status: Downloaded newer image for prom/prometheus:latest
14c5acf160823ae1695336d3cd679a7a60133475af76a2e916b4a993d142e046
http://192.168.10.150:9090/ --> 访问图形界面(192.168.10.150改为自己的IP地址)
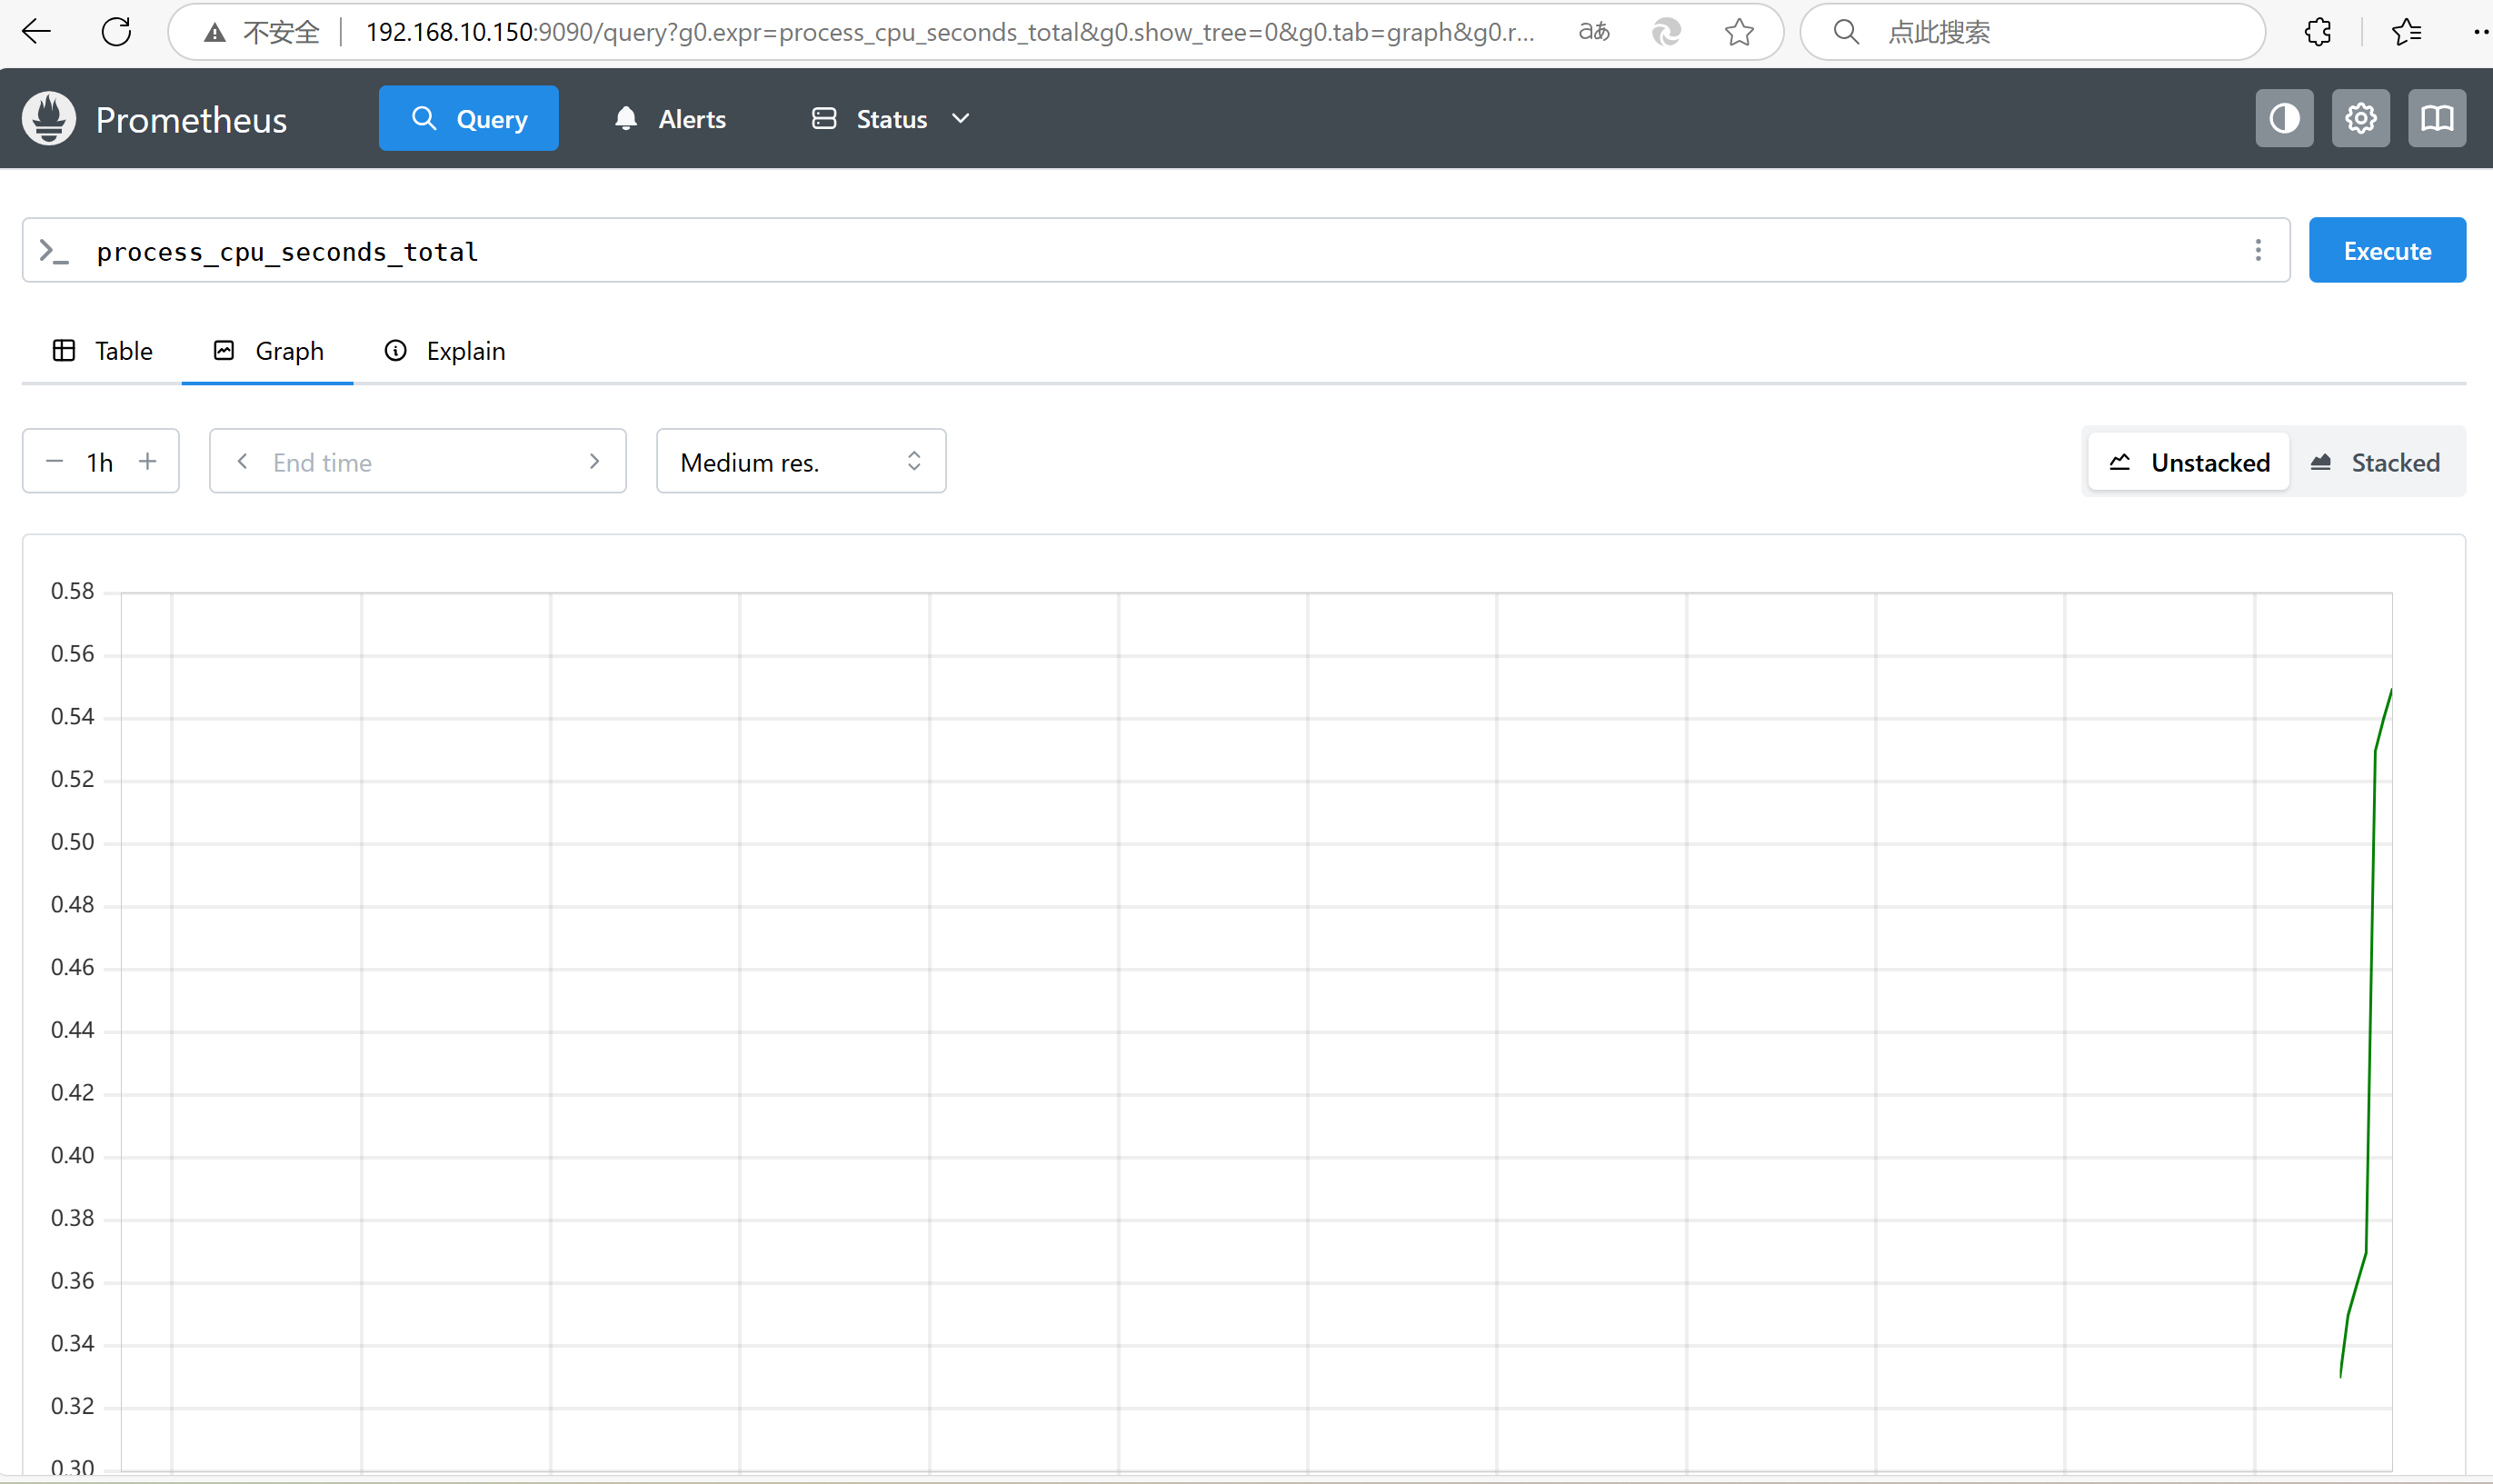
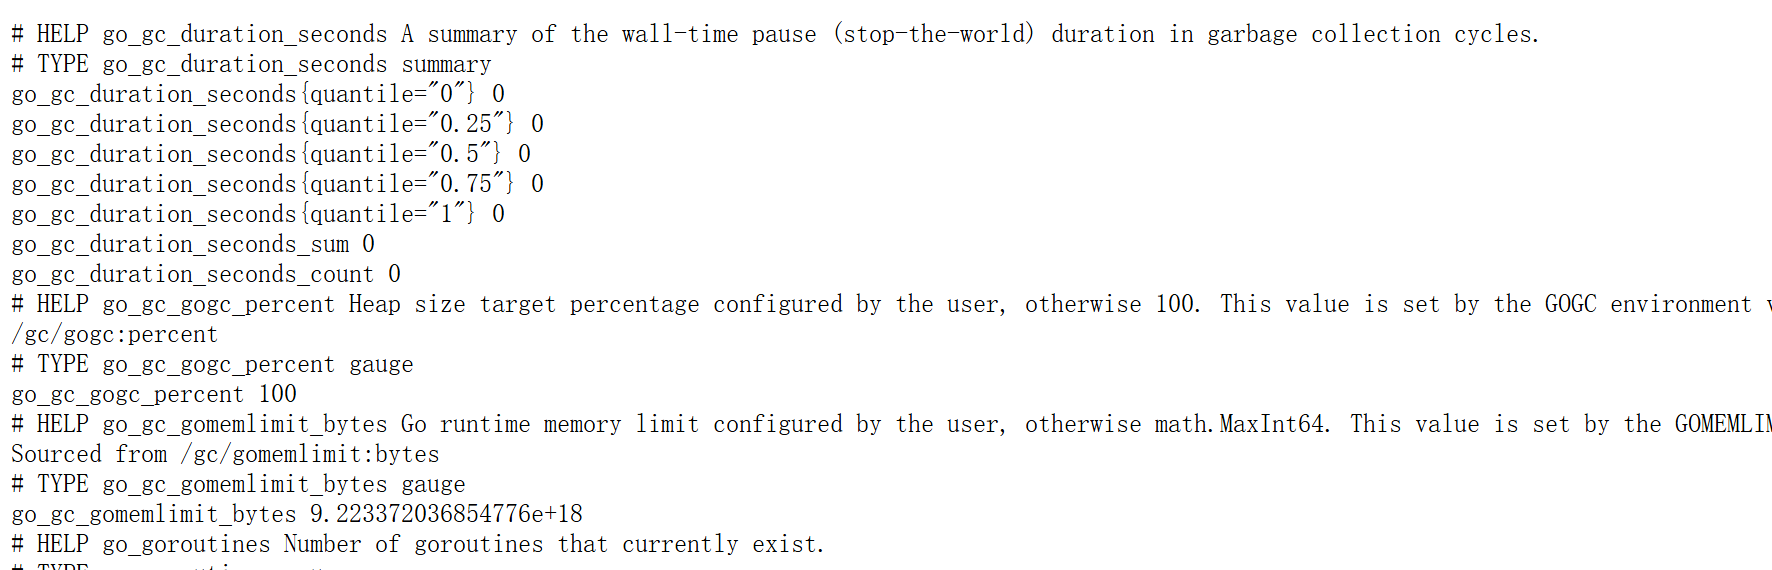
http://192.168.10.150:9090/metrics --> prometheus提供的数据的API
grafana 就是访问prometheus的http://192.168.10.150:9090/metrics接口获取数据,然后出图展示
grafana 就是数据显示的工具,比prometheus自带的web界面出图工具要漂亮。
2. 源码下载
[root@wcw ~]# mkdir /prom
[root@wcw ~]# cd /prom
[root@wcw prom]# wget https://github.com/prometheus/prometheus/releases/download/v2.34.0/prometheus-2.34.0.linux-amd64.tar.gz
[root@wcw prom]# ls
prometheus-2.34.0.linux-amd64.tar.gz
[root@wcw prom]# tar xf prometheus-2.34.0.linux-amd64.tar.gz
[root@wcw prom]# cd prometheus-2.34.0.linux-amd64/
[root@wcw prometheus-2.34.0.linux-amd64]# ls
console_libraries  consoles  LICENSE  NOTICE  prometheus  prometheus.yml  promtool
[root@wcw prometheus-2.34.0.linux-amd64]# PATH=/prom:$PATH
[root@wcw prometheus-2.34.0.linux-amd64]# cd ..
[root@wcw prom]# mv prometheus-2.34.0.linux-amd64/* /prom
[root@wcw prom]# ls
console_libraries  NOTICE                         prometheus-2.34.0.linux-amd64.tar.gz
consoles           prometheus                     prometheus.yml
LICENSE            prometheus-2.34.0.linux-amd64  promtool
[root@wcw prom]# rm prometheus-2.34.0.linux-amd64 -r
rm: remove directory ‘prometheus-2.34.0.linux-amd64’? y
[root@wcw prom]# ls
console_libraries  LICENSE  prometheus                            prometheus.yml
consoles           NOTICE   prometheus-2.34.0.linux-amd64.tar.gz  promtool
[root@wcw prom]# which prometheus
/prom/prometheus
在后台启动prometheus
[root@wcw prom]# nohup prometheus --config.file=/prom/prometheus.yml  &
[1] 18699
[root@wcw prom]# nohup: ignoring input and appending output to ‘nohup.out’
[root@wcw prom]# ls
console_libraries  LICENSE    prometheus                            promtool
consoles           nohup.out  prometheus-2.34.0.linux-amd64.tar.gz
data               NOTICE     prometheus.yml
prometheus.yml 是prometheus的配置文件
[root@wcw prom]# vim prometheus.yml
scrape_configs:
  # The job name is added as a label `job=<job_name>` to any timeseries scraped from this config.
  - job_name: "prometheus"

    # metrics_path defaults to '/metrics'
    # scheme defaults to 'http'.

    static_configs:
      - targets: ["localhost:9090"]
docker compose与cadvisor
docker compose 是一个可以在一台宿主机上同时启动多个容器的工具 --> 容器编排 --> 一台宿主机上的多个容器,那个容器需要加载什么配置,使用那个镜像,开放那个端口,是否使用卷等参数的配置。可以一次性在一台宿主机上帮助我们启动很多的容器。
编排: 可以为指定启动容器的参数,例如:端口,镜像,卷等配置,启动顺序,容器和容器之间的关系。
docker-compose.yml --》是compose的剧本
swarm : docker 官方出品的可以在多台宿主机上编排容器的软件。
k8s : CNCF 出品的可以在多台宿主机上编排容器的软件。
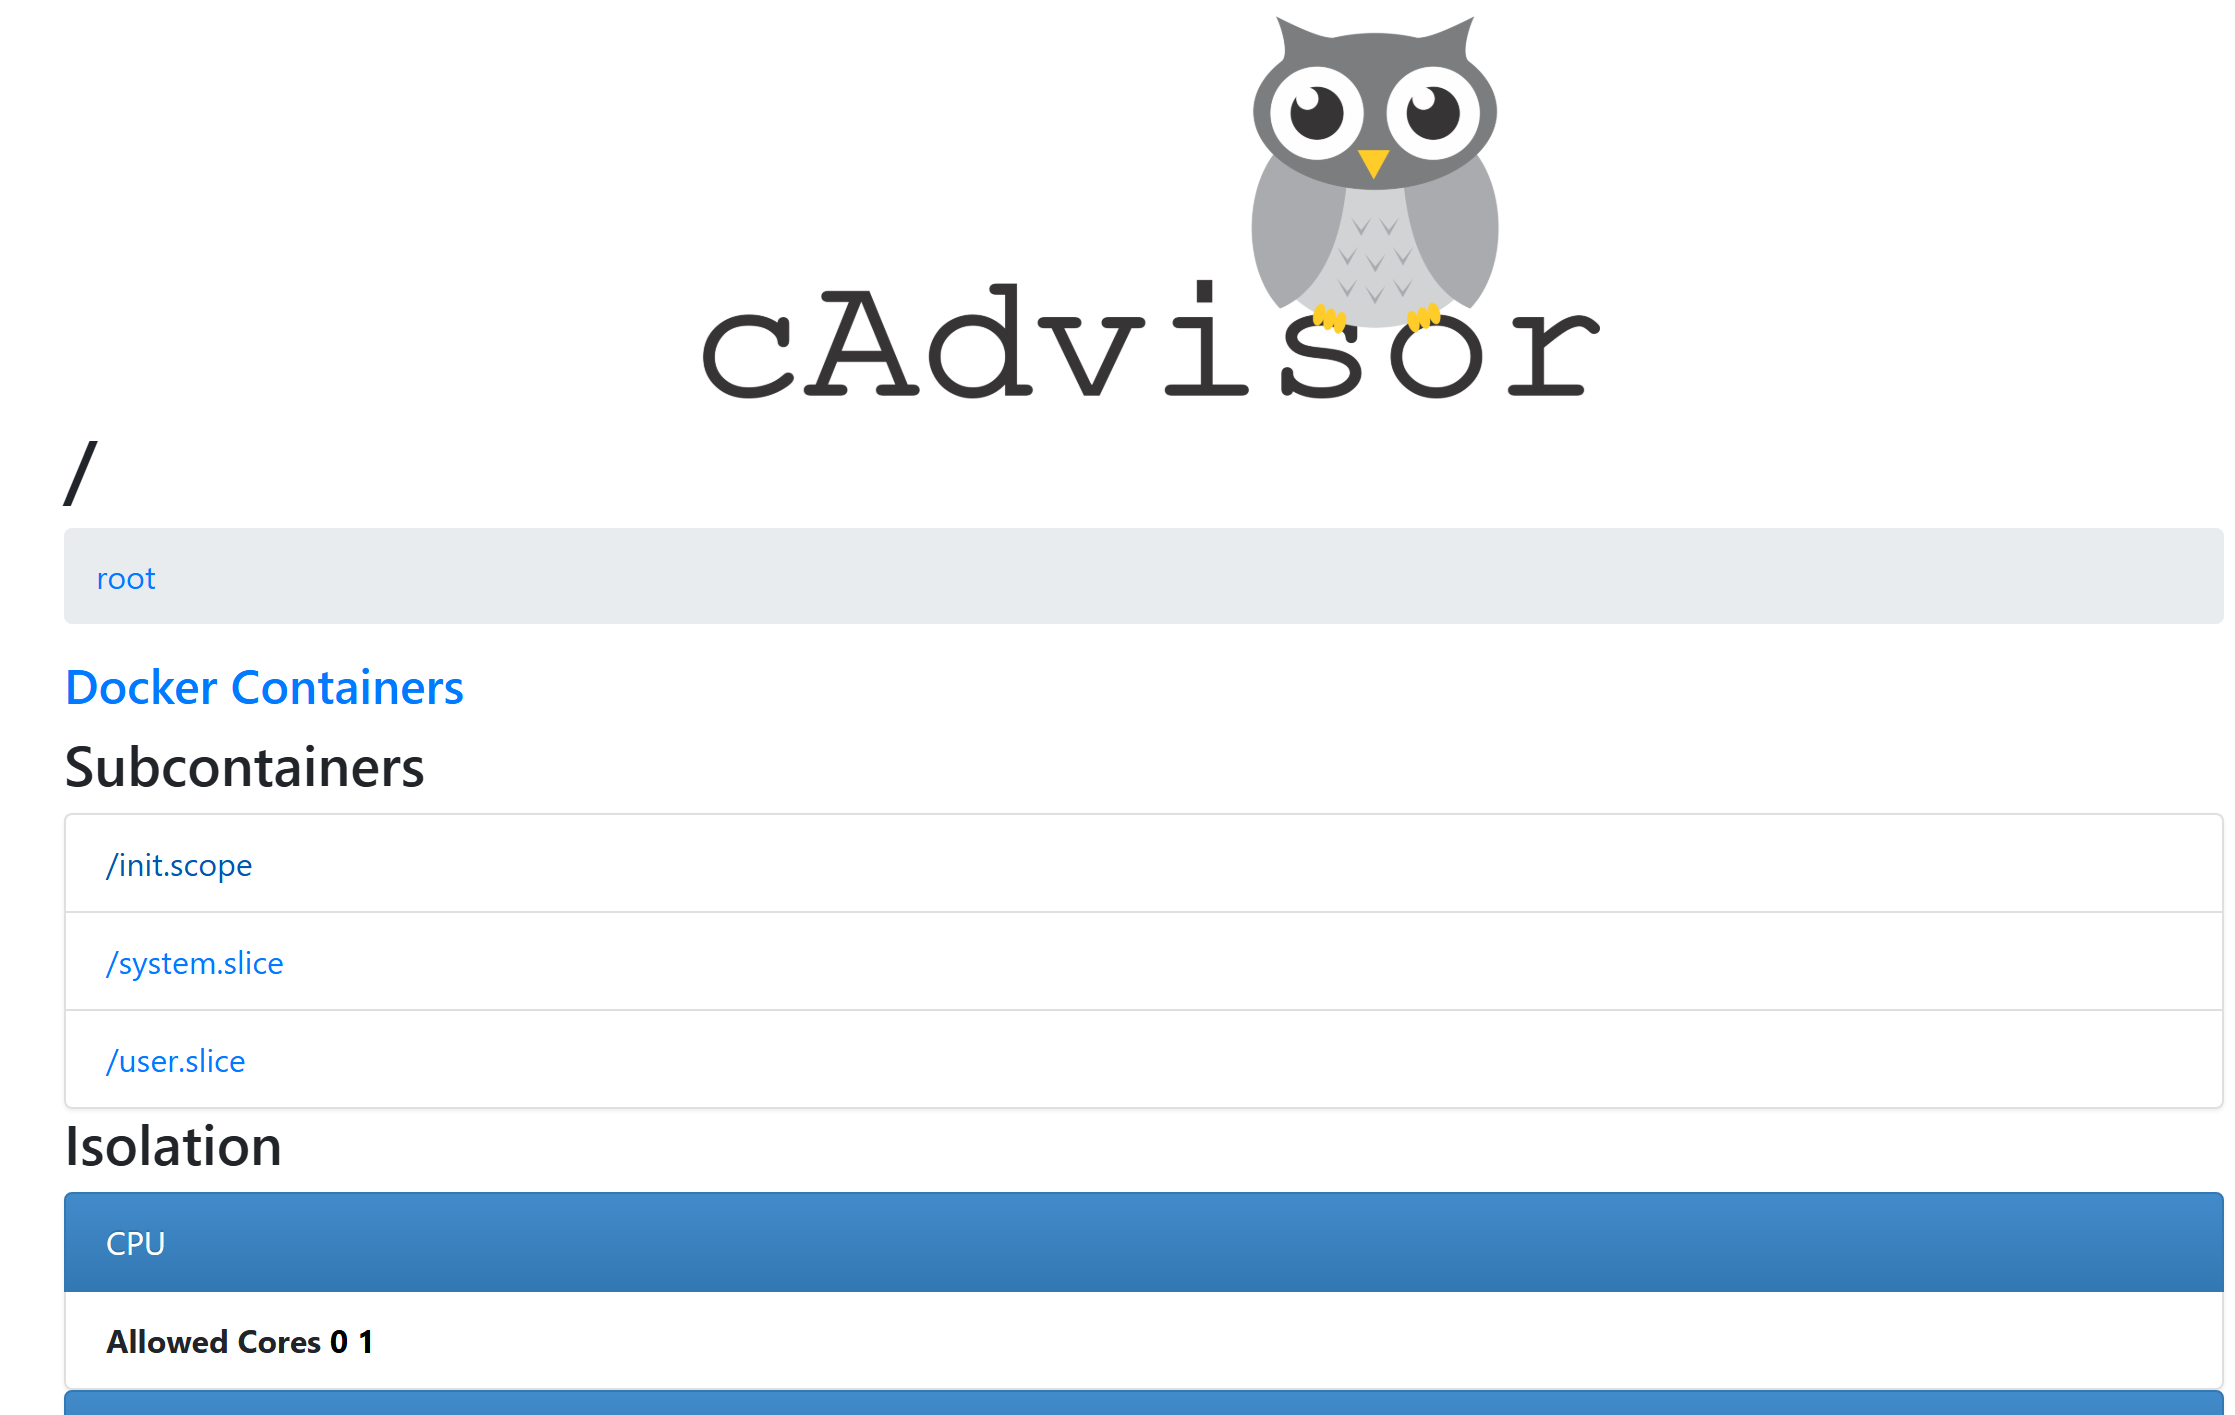
cAdvisor (short for container Advisor) analyzes and exposes resource usage and performance data from running containers. --》可以获取宿主机的资源使用和容器的资源使用--》是一个非常好的agent,
Monitoring Docker container metrics using cAdvisor | Prometheus
使用prometheus监控容器
1. 下载compose软件(之前的版本)
curl -L https://get.daocloud.io/docker/compose/releases/download/1.29.2/docker-compose-`uname -s`-`uname -m` -o /usr/local/bin/docker-compose2. 授予可执行权限
[root@ansible ~]# chmod +x /usr/local/bin/docker-compose
[root@ansible ~]# which docker-compose
/usr/local/bin/docker-compose
3. 编辑prometheus的配置文件
root@wwwdsj:/cadvisor# vim prometheus.yml
scrape_configs:
- job_name: cadvisor
  scrape_interval: 5s
  static_configs:
  - targets:
    - cadvisor:8080
root@wwwdsj:/cadvisor# docker ps
CONTAINER ID   IMAGE                         COMMAND                  CREATED       STATUS                 PORTS                                         NAMES
aac8e56686d3   prom/prometheus               "/bin/prometheus --c…"   4 days ago    Up 2 hours             0.0.0.0:9090->9090/tcp, [::]:9090->9090/tcp   sc-prometheus-1
6899b146f5e6   goharbor/harbor-log:v2.12.1   "/bin/sh -c /usr/loc…"   13 days ago   Up 4 hours (healthy)   127.0.0.1:1514->10514/tcp                     harbor-log
root@wwwdsj:/cadvisor# docker stop sc-prometheus-1
sc-prometheus-1
root@wwwdsj:/cadvisor# docker rm sc-prometheus-1	防止占用9090端口
sc-prometheus-1
root@wwwdsj:/cadvisor# vim docker-compose.yml		新建docker-compose.yml文件
version: '3.2'
services:
  prometheus:
    image: prom/prometheus:latest
    container_name: prometheus
    ports:
    - 9090:9090
    command:
    - --config.file=/etc/prometheus/prometheus.yml
    volumes:
    - ./prometheus.yml:/etc/prometheus/prometheus.yml:ro
    depends_on:
    - cadvisor
  cadvisor:
    image: gcr.io/cadvisor/cadvisor:latest
    container_name: cadvisor
    ports:
    - 8080:8080
    volumes:
    - /:/rootfs:ro
    - /var/run:/var/run:rw
    - /sys:/sys:ro
    - /var/lib/docker/:/var/lib/docker:ro
    depends_on:
    - redis
  redis:
    image: redis:latest
    container_name: redis
    ports:
    - 6379:6379
4. 导入cadvisor镜像,使用xftp上传
root@wwwdsj:/cadvisor# rz
root@wwwdsj:/cadvisor# ls
cadvisor.tar  docker-compose.yml  prometheus.yml
root@wwwdsj:/cadvisor# docker load <cadvisor.tar
ace0eda3e3be: Loading layer  5.843MB/5.843MB
33bb68b99ee4: Loading layer  102.4MB/102.4MB
d3174d703c76: Loading layer  13.25MB/13.25MB
8b7599e512b6: Loading layer  44.19MB/44.19MB
Loaded image: gcr.io/cadvisor/cadvisor:latest
root@wwwdsj:/cadvisor# docker images
REPOSITORY                                 TAG       IMAGE ID       CREATED        SIZE
nginx                                      latest    4e1b6bae1e48   2 weeks ago    192MB
prom/prometheus                            latest    7f8d8693d556   2 weeks ago    302MB
gcr.io/cadvisor/cadvisor                   latest    68c29634fe49   4 years ago    163MB
5. 使用docker compose启动容器
root@wwwdsj:/cadvisor# docker-compose up
Creating redis ... done
Creating cadvisor ... done
Creating prometheus ... done
Attaching to redis, cadvisor, prometheus
cadvisor      | W0504 10:09:11.767863       1 manager.go:159] Cannot detect current cgroup on cgroup v2
cadvisor      | W0504 10:09:11.870189       1 manager.go:288] Could not configure a source for OOM detection, disabling OOM events: open /dev/kmsg: no such file or directory
redis         | 1:C 04 May 2025 10:09:11.357 # WARNING Memory overcommit must be enabled! Without it, a background save or replication may fail under low memory condition. Being disabled,
...
root@wwwdsj:/cadvisor# docker-compose ps		查看启动的容器
   Name                 Command                  State                     Ports
----------------------------------------------------------------------------------------------
cadvisor     /usr/bin/cadvisor -logtostderr   Up (healthy)   0.0.0.0:8080->8080/tcp,:::8080->8080/tcp
prometheus   /bin/prometheus --config.f ...   Up             0.0.0.0:9090->9090/tcp,:::9090->9090/tcp
redis        docker-entrypoint.sh redis ...   Up             0.0.0.0:6379->6379/tcp,:::6379->6379/tcp
6. 访问cadvisor和prometheus
访问cadvisor :http://192.168.10.150:8080/
访问prometheus:http://192.168.10.150:9090/
停止docker-compose
root@wwwdsj:/cadvisor# docker-compose stop
Stopping prometheus ... done
Stopping cadvisor   ... done
Stopping redis      ... done
root@wwwdsj:/cadvisor# docker-compose down	Stop and remove resources
Removing prometheus ... done
Removing cadvisor   ... done
Removing redis      ... done
Removing network cadvisor_default
node-exporter
exporter 是一个采集数据的软件工具,需要人去开发的--》官方给我们提供了---》未来可以自己去开发exporter--》go语言
在被监控服务器上安装node-exporter --》让prometheus监控
1. 上传node-exporter软件,然后解压获得node_exporter软件
[root@wcw bin]# mkdir /node_exporter
[root@wcw bin]# rz
[root@wcw bin]# cd /node_exporter/
[root@wcw node_exporter]# ls
node_exporter-1.9.1.linux-amd64.tar.gz
[root@wcw node_exporter]# tar xf node_exporter-1.9.1.linux-amd64.tar.gz
[root@wcw node_exporter]# ls
node_exporter-1.9.1.linux-amd64  node_exporter-1.9.1.linux-amd64.tar.gz
[root@wcw node_exporter]# cd node_exporter-1.9.1.linux-amd64/
[root@wcw node_exporter-1.9.1.linux-amd64]# ls
LICENSE  node_exporter  NOTICE
2. 启动node_exporter 代理软件
[root@wcw node_exporter-1.9.1.linux-amd64]# PATH=/node_exporter/node_exporter-1.9.1.linux-amd64:$PATH
[root@wcw node_exporter-1.9.1.linux-amd64]# which node_exporter
/node_exporter/node_exporter-1.9.1.linux-amd64/node_exporter
[root@wcw node_exporter-1.9.1.linux-amd64]# node_exporter --help	查看使用手册
启动node_exporter监听9100端口(后台运行)
[root@wcw node_exporter-1.9.1.linux-amd64]# nohup node_exporter --web.listen-address="0.0.0.0:9100"  &
[1] 32703
[root@wcw node_exporter-1.9.1.linux-amd64]# nohup: ignoring input and appending output to ‘nohup.out’
[root@wcw node_exporter-1.9.1.linux-amd64]# ps aux|grep node
root     32703  0.0  0.3 1240860 7096 pts/2    Sl   20:06   0:00 node_exporter --web.listen-address=0.0.0.0:9100
root     32725  0.0  0.0 112812   980 pts/2    S+   20:06   0:00 grep --color=auto nod
[root@wcw node_exporter-1.9.1.linux-amd64]# netstat -anplut|grep node
tcp6 0 0 :::9100 :::* LISTEN 32703/node_exporter 访问测试是否安装成功:http://192.168.10.146:9100/metrics(192.168.10.146改为自己IP地址)
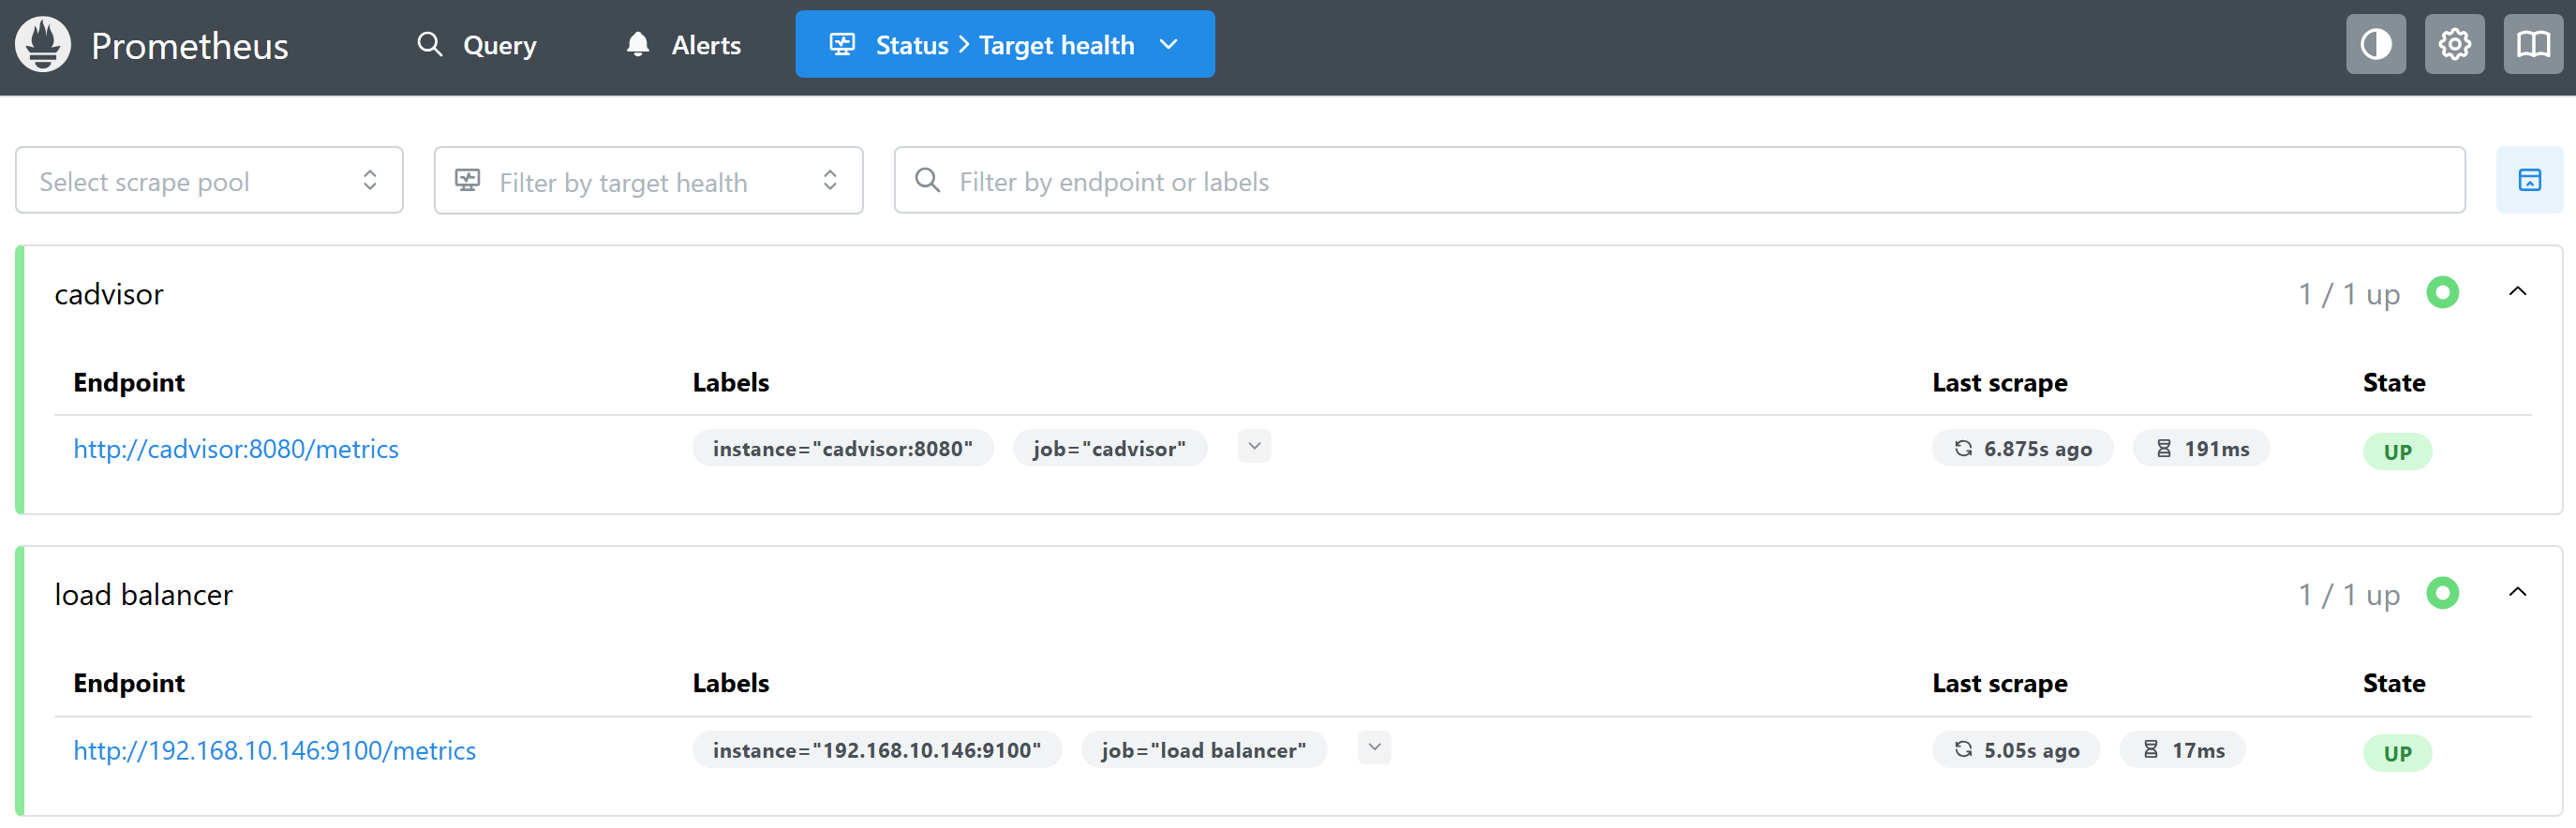
1. 在prometheus server里添加被监控主机
root@wwwdsj:/cadvisor# vim prometheus.yml
scrape_configs:
- job_name: cadvisor
  scrape_interval: 5s
  static_configs:
  - targets:
    - cadvisor:8080
- job_name: load balancer
  scrape_interval: 5s
  static_configs:
  - targets:
    - 192.168.10.146:9100
添加需要监控的服务器的信息
- job_name: load balancer
scrape_interval: 5s
static_configs:
- targets:
- 192.168.10.146:9100
2. 重启prometheus服务,因为没有专门的重启脚本,需要手工完成
因为我们是使用容器启动的prometheus,所以我们需要重启compose
root@wwwdsj:/cadvisor# docker-compose down
Removing prometheus ... done
Removing cadvisor   ... done
Removing redis      ... done
Removing network cadvisor_default
root@wwwdsj:/cadvisor# docker-compose up -d		-d后台执行
Creating network "cadvisor_default" with the default driver
Creating redis ... done
Creating cadvisor ... done
Creating prometheus ... done
3. 去prometheus服务器上查看添加的监控服务器
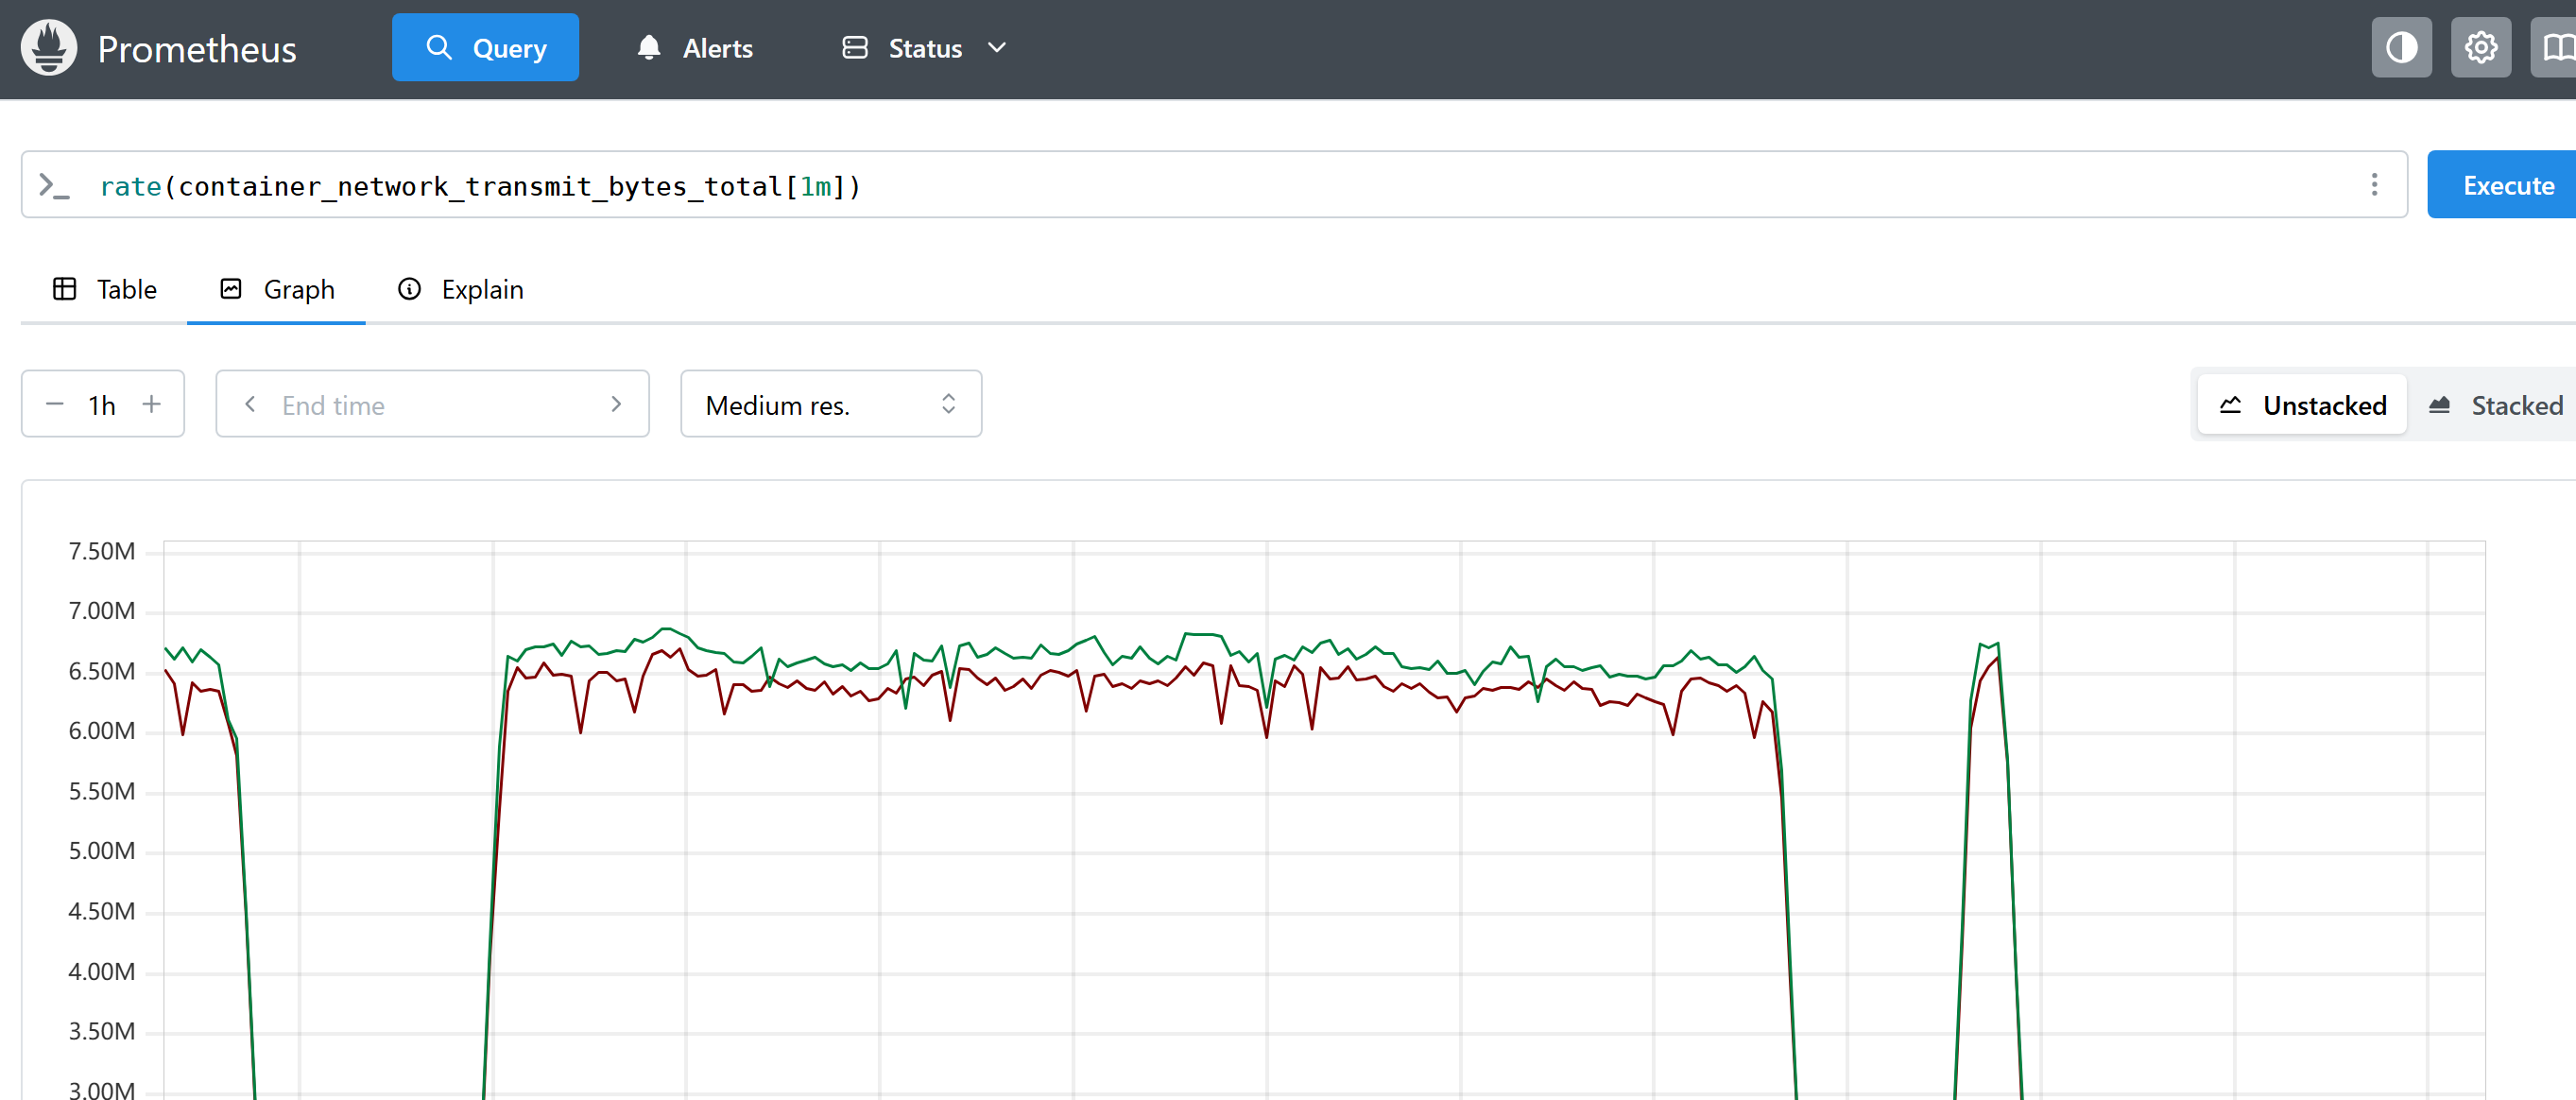
访问prometheus server:http://192.168.10.150:9090/targets
grafana
概述:美观、强大的可视化监控指标展示工具
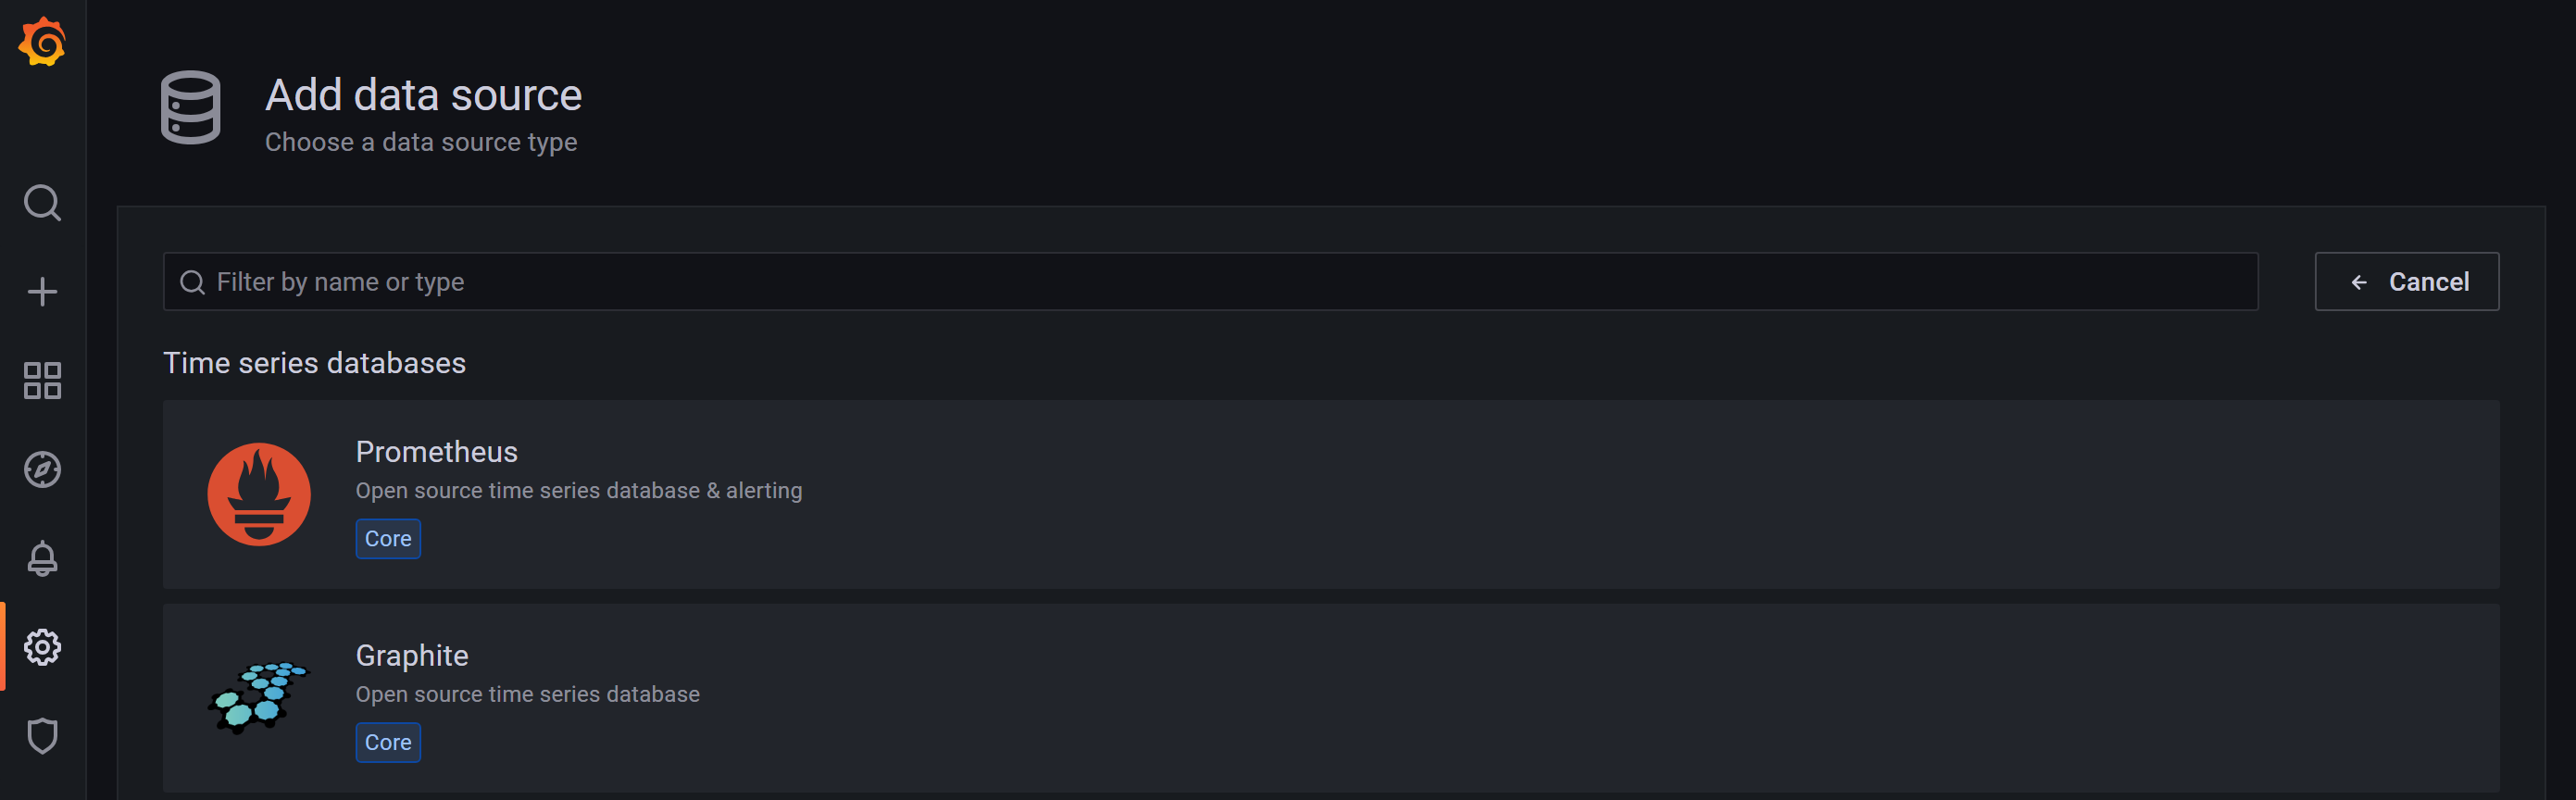
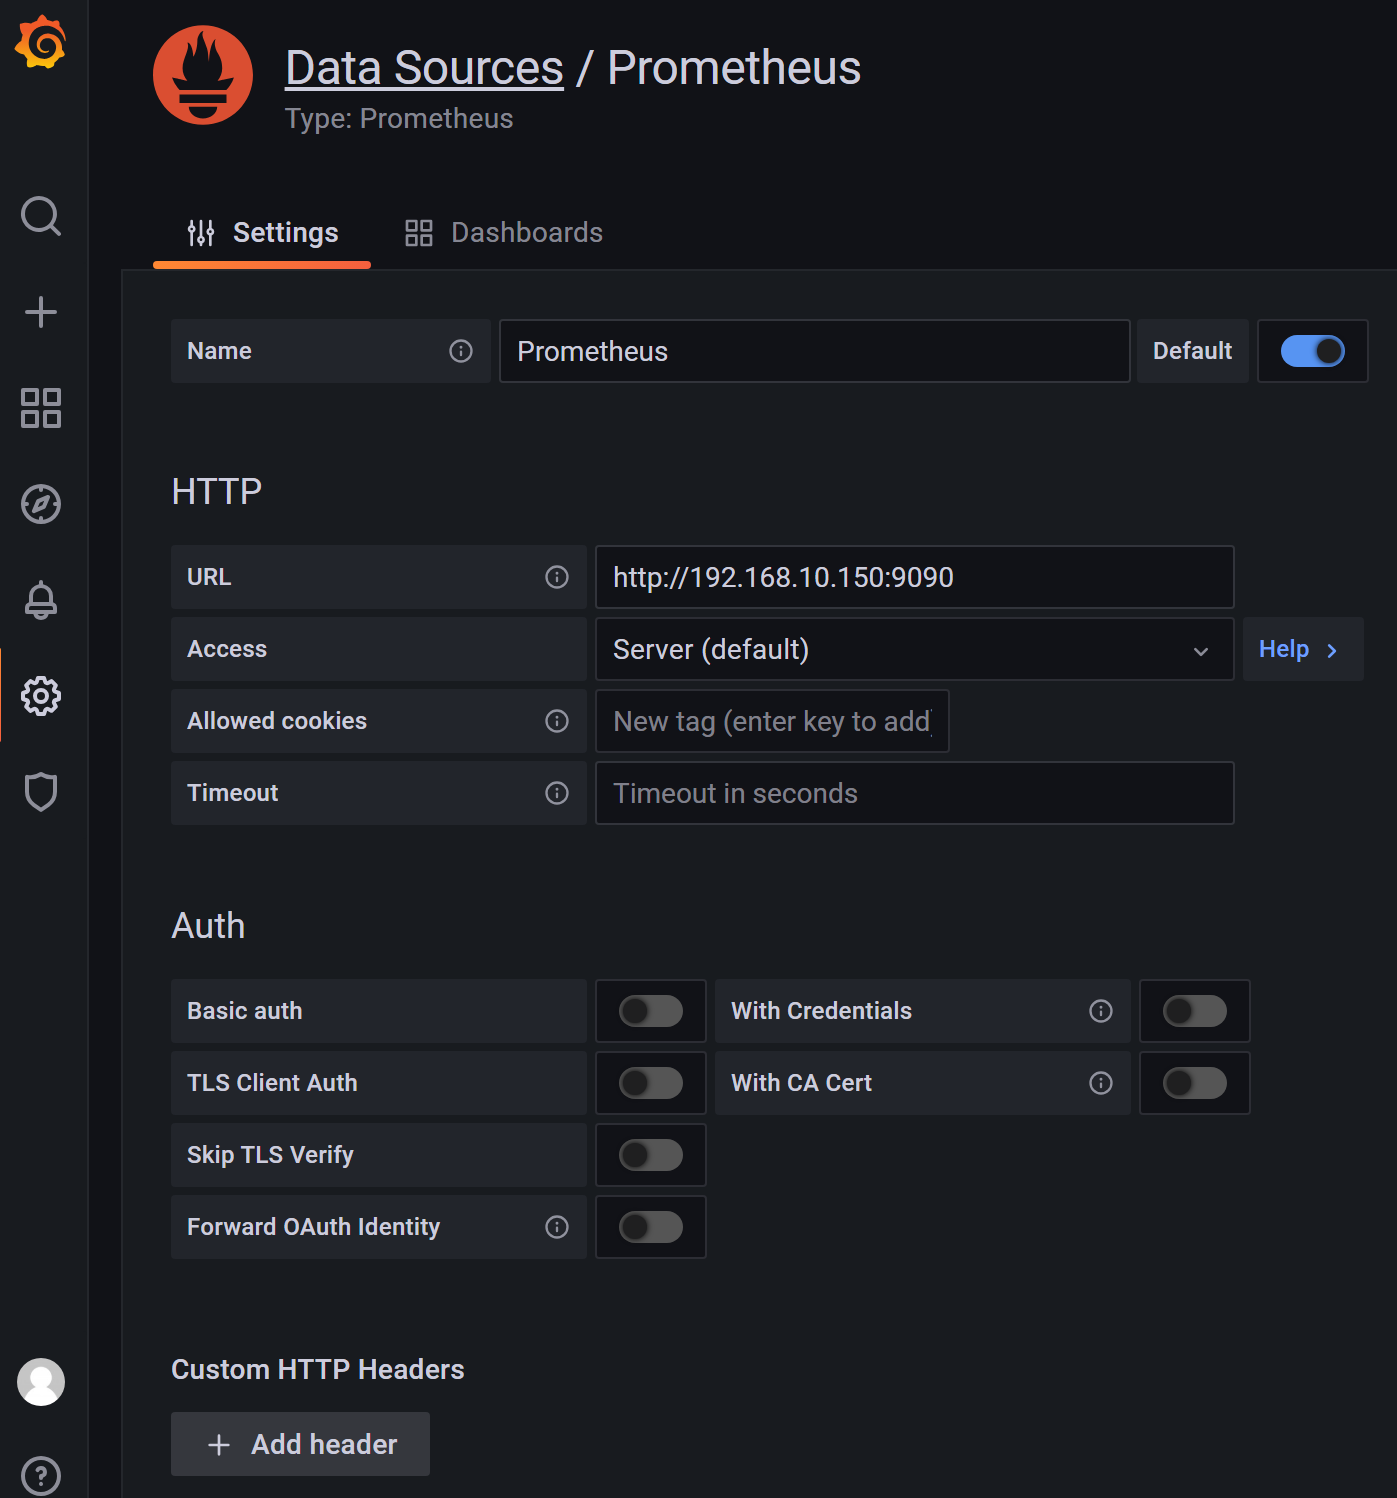
grafana 是一款采用 go 语言编写的开源应用,主要用于大规模指标数据的可视化展现,是网络架构和应用分析中最流行的时序数据展示工具,目前已经支持绝大部分常用的时序数据库。最好的参考资料就是官网(Technical documentation | Grafana Labs)
Dashboard :仪表盘 ---》图形展示
/docs/grafana/latest/setup-grafana/installation/debian/
[root@zabbix grafana]# wget https://dl.grafana.com/enterprise/release/grafana-enterprise-8.4.5-1.x86_64.rpm
[root@zabbix grafana]# yum install grafana-enterprise-8.4.5-1.x86_64.rpm -y
[root@zabbix grafana]# systemctl daemon-reload
[root@zabbix grafana]# systemctl start grafana-server
[root@zabbix grafana]# systemctl enable grafana-server
[root@zabbix grafana]# ps aux|grep grafana
grafana    7293  1.3  6.3 1050180 63388 ?       Ssl  22:25   0:01 /usr/sbin/grafana-server --config=/etc/grafana/grafana.ini --pidfile=/var/run/grafana/grafana-server.pid --packaging=rpm cfg:default.paths.logs=/var/log/grafana cfg:default.paths.data=/var/lib/grafana cfg:default.paths.plugins=/var/lib/grafana/plugins cfg:default.paths.provisioning=/etc/grafana/provisioning
root       7312  0.0  0.0 112824   984 pts/0    D+   22:26   0:00 grep --color=auto grafana
[root@zabbix grafana]# netstat -anplut|grep grafana
tcp        0      0 192.168.10.146:43738    34.120.177.193:443      ESTABLISHED 7293/grafana-server
tcp6       0      0 :::3000                 :::*                    LISTEN      7293/grafana-server
[root@zabbix grafana]# grafana-server -v
Version 8.4.5 (commit: 4cafe613e, branch: HEAD)
到web 浏览器里访问:http://192.168.10.146:3000/
web登陆:默认账号和密码都是admin
模板8919:
添加监控项(PromQL里查询的指标)--》grafana帮助我们去出图展示 --》自己去添加监控项遇到:
1. 对很多监控项的指标具体对应那个PromQL 语句我们不熟悉
2. 如果监控的指标过多,操作笔记复杂
grafana有模板,模板里包含很多的重要的监控项,我们直接导入就可以了。
grafana的模板,本质上是一个json格式的文件。
监控模板: 里面定义了很多的监控项,直接导入模板就可以了。
导入json格式的监控模板
新一代监控神器Prometheus+Grafana介绍及使用 - 塔克拉玛攻城狮 - 博客园
Grafana dashboards | Grafana Labs 这个里面有很多的模板,可以去下载,但是也有些模板不匹配,导入出错。
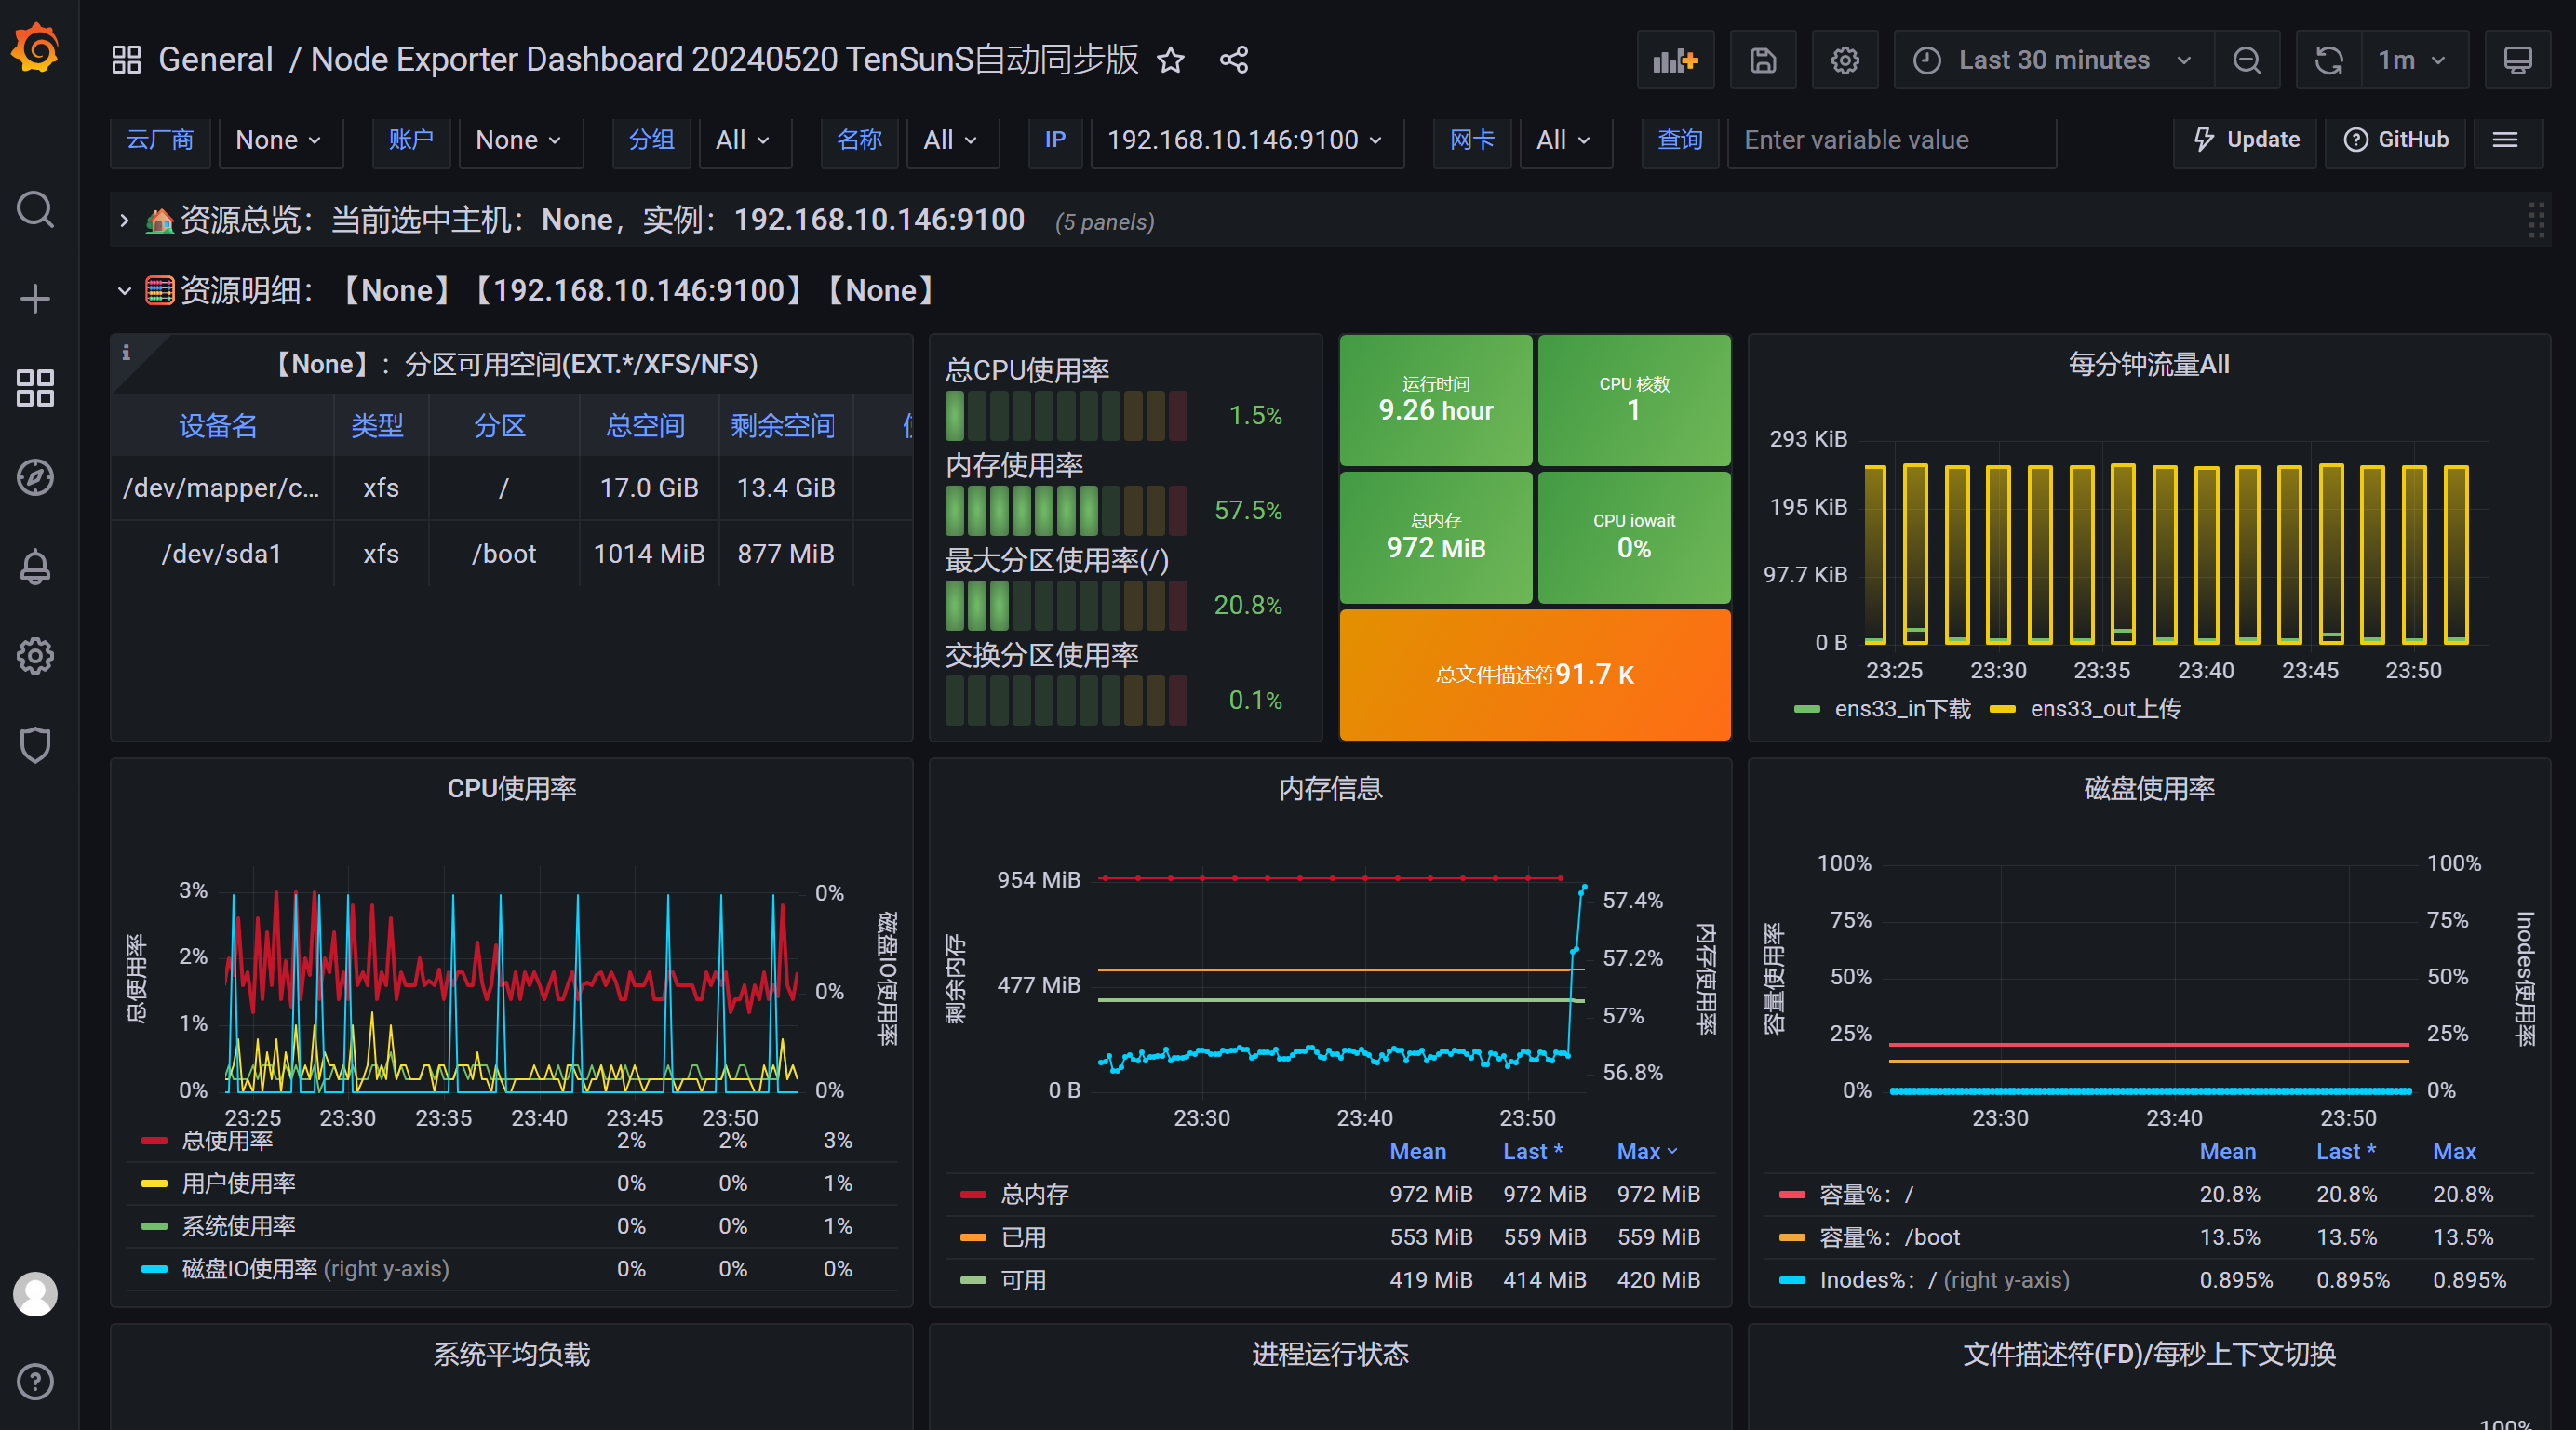
node-exporter-for-prometheus-dashboard-cn-v20201010_rev24.json 这个模板非常好用
Node Exporter Dashboard 20240520 TenSunS自动同步版 | Grafana Labs
导入json格式的监控模板
新一代监控神器Prometheus+Grafana介绍及使用 - 塔克拉玛攻城狮 - 博客园
Grafana dashboards | Grafana Labs 这个里面有很多的模板,可以去下载,但是也有些模板不匹配,导入出错。


 被折叠的 条评论
为什么被折叠?
被折叠的 条评论
为什么被折叠?
 到【灌水乐园】发言


