


 https://blog.csdn.net/AI_Green/article/details/134931243?spm=1001.2014.3001.5502
监控Mac或Windows系统的资源目的
性能分析与优化:实时监控CPU使用率可以帮助识别是否有进程占用过多资源,导致系统响应缓慢或崩溃。
监控内存使用有助于排查内存泄漏问题,确保程序高效运行,避免因内存耗尽而导致系统不稳定。
故障排查:
当系统出现问题如卡顿、延迟、无响应等情况时,通过监控系统资源的变化,可以快速定位潜在的问题根源。
容量规划与预警:
对于服务器或数据中心管理,监控磁盘空间、内存使用、CPU负载等是必不可少的,以便及时扩容或迁移数据,防止磁盘满载或资源耗尽引发的服务中断。
自动化运维:
自动化的监控系统可以根据预设阈值触发警报或自动执行相应措施,比如当CPU使用率过高时,可以自动停止不必要的进程或通知运维人员介入。
系统健康度评估:
维持系统长期稳定运行,监控系统资源有利于了解系统整体健康状况,提前预防可能出现的问题。
安装
pip install psutil matplotlib numpy#实例代码
import psutil
import matplotlib.pyplot as plt
import numpy as np
import time
# 监控CPU使用率
def monitor_cpu():
cpu_percent = psutil.cpu_percent(interval=1)
return cpu_percent
# 监控内存使用情况
def monitor_memory():
mem = psutil.virtual_memory()
return mem.total / (1024**2), mem.used / (1024**2)
# 监控磁盘I/O
def monitor_disk_io():
disk_io = psutil.disk_io_counters(perdisk=False)
return disk_io.read_bytes / (1024**2), disk_io.write_bytes / (1024**2) # 转换为MB
# 创建图表
def create_combined_graph(data_dict, labels, colors, title):
x = np.arange(len(data_dict[labels[0]]))
fig, ax1 = plt.subplots()
ax1.set_title(title)
ax1.set_xlabel('Seconds')
ax1.set_ylabel('CPU Usage (%)', color='tab:red')
ax1.plot(x, data_dict['CPU Usage (%)'], label='CPU Usage', color='tab:red')
ax1.tick_params(axis='y', labelcolor='tab:red')
ax2 = ax1.twinx()
ax2.set_ylabel('Memory Used (MB)', color='tab:blue')
ax2.plot(x, data_dict['Memory Used (MB)'], label='Memory Used', color='tab:blue')
ax2.tick_params(axis='y', labelcolor='tab:blue')
ax3 = ax1.twinx()
ax3.spines["right"].set_position(("axes", 1.2)) # 设置第三个Y轴的位置
make_patch_spines_invisible(ax3)
ax3.spines["right"].set_visible(True)
ax3.set_ylabel('Disk I/O (MB)', color='tab:green')
ax3.plot(x, data_dict['Disk Reads (MB)'], label='Disk Reads', color='tab:orange')
ax3.plot(x, data_dict['Disk Writes (MB)'], label='Disk Writes', color='tab:green')
ax3.tick_params(axis='y', labelcolor='tab:green')
# 添加磁盘最后读写数据到右上角
last_disk_read = data_dict['Disk Reads (MB)'][-1]
last_disk_write = data_dict['Disk Writes (MB)'][-1]
fig.text(0.95, 0.95, f'Disk Reads: {last_disk_read:.2f} MB\nDisk Writes: {last_disk_write:.2f} MB',
ha='right', va='top', fontsize=10, color='gray', transform=fig.transFigure)
h1, l1 = ax1.get_legend_handles_labels()
h2, l2 = ax2.get_legend_handles_labels()
h3, l3 = ax3.get_legend_handles_labels()
ax1.legend(h1+h2+h3, l1+l2+l3, loc='upper center')
plt.show()
# 辅助函数,用于隐藏多余的边框
def make_patch_spines_invisible(ax):
ax.set_frame_on(False)
ax.patch.set_visible(False)
for sp in ax.spines.values():
sp.set_visible(False)
# 主监控函数
def main_monitor_combined():
data_dict = {
'CPU Usage (%)': [],
'Memory Used (MB)': [],
'Disk Reads (MB)': [],
'Disk Writes (MB)': [],
}
for _ in range(10):
cpu_percent = monitor_cpu()
data_dict['CPU Usage (%)'].append(cpu_percent)
mem_total, mem_used = monitor_memory()
data_dict['Memory Used (MB)'].append(mem_used)
disk_reads_mb, disk_writes_mb = monitor_disk_io()
data_dict['Disk Reads (MB)'].append(disk_reads_mb)
data_dict['Disk Writes (MB)'].append(disk_writes_mb)
time.sleep(1)
create_combined_graph(data_dict, ['CPU Usage (%)', 'Memory Used (MB)', 'Disk Reads (MB)', 'Disk Writes (MB)'],
['tab:red', 'tab:blue', 'tab:orange', 'tab:green'], 'System Resource Usage Over Time')
if __name__ == "__main__":
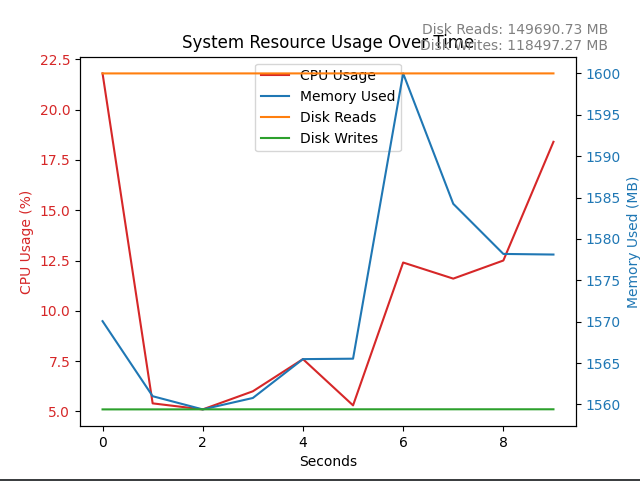
main_monitor_combined()Mac运行结果如下:
行动吧,在路上总比一直观望的要好,未来的你肯定会感谢现在拼搏的自己!如果想学习提升找不到资料,没人答疑解惑时,请及时加入群: 759968159,里面有各种测试开发资料和技术可以一起交流哦。
最后: 下方这份完整的软件测试视频教程已经整理上传完成,需要的朋友们可以自行领取【保证100%免费】

软件测试面试文档
我们学习必然是为了找到高薪的工作,下面这些面试题是来自阿里、腾讯、字节等一线互联网大厂最新的面试资料,并且有字节大佬给出了权威的解答,刷完这一套面试资料相信大家都能找到满意的工作。


 被折叠的 条评论
为什么被折叠?
被折叠的 条评论
为什么被折叠?
 到【灌水乐园】发言


