


对于Web网页来说,页面的访问、加载速度对于用户体验来说是很重要的,而如果把Android中的每个Activity都看成是一个页面的话,Activity的启动速度凭主观的话是较难精确衡量的,因此如果可以测试每个Activity的启动速度或者获得其它基本指标并进行日常监测那就更好了。
这个类中onCreate()方法中传入要测试的Activity的名字。
四、运行Activity启动性能的测试用例
-e launch_activity参数后指定要测试的Activity名.
其中意义较大的结果有如cpu_time,execution_time分别代表Activity启动过程中进程占用的cpu时间与实际执行时间,单位毫秒。
对测试结果进行=替换为:去除空格等格式化处理
这里只提取需要的
cpu_time,
execution_time两个字段的值,并将结果最终生成单元测试格式的xml文件
得到的xml结果如下:
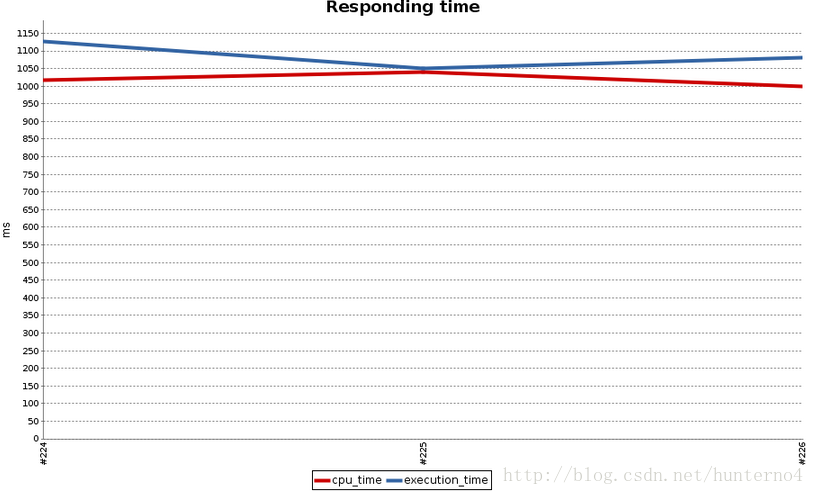
六、Jenkins结果展示
测试用例可以使用命令行方式执行,因此也就可以使用Jenkins完成自动化测试,且对于生成的单元测试格式的xml报告,可以使用Jenkins的Performance Plugin 插件进行图表化展示:
一、编写继承于Instrumentation类的LaunchPerformanceBase类
- /**
- * Base class for all launch performance Instrumentation classes.
- */
- public class LaunchPerformanceBase extends Instrumentation {
- public static final String TAG = "LaunchPerformanceBase";
- protected Bundle mResults;
- protected Intent mIntent;
- /**
- * Constructor.
- */
- public LaunchPerformanceBase() {
- mResults = new Bundle();
- mIntent = new Intent(Intent.ACTION_MAIN);
- mIntent.setFlags(Intent.FLAG_ACTIVITY_NEW_TASK);
- setAutomaticPerformanceSnapshots();
- }
- /**
- * Launches intent {@link #mIntent}, and waits for idle before
- * returning.
- */
- protected void LaunchApp() {
- startActivitySync(mIntent);
- waitForIdleSync();
- }
- @Override
- public void finish(int resultCode, Bundle results) {
- super.finish(resultCode, results);
- }
- }
在这个类的构造函数中setAutomaticPerformanceSnapshots()为Instrumentation设置为开启性能快照功能。
LaunchApp()方法中用于启动相应的Activity, waitForIdleSync()方法则为等待Activity空闲时,即等待Activity启动完毕。
二、编写ActivityLaunchPerformanceTest类
- public class ActivityLaunchPerformanceTest extends LaunchPerformanceBase {
- /**
- * Outfile argument name.
- * This argument can be passed to the instrumentation using
- <code>-e</code>.
- */
- private static final String launchActivityName = "launch_activity";
- /**
- * Output file name.
- */
- private String classNameForIntent;
- private String DEFAULT_ACTIVITY = "SplashActivity";
- /**
- * Constructor.
- */
- public ActivityLaunchPerformanceTest() {
- super();
- }
- @Override
- public void onCreate(Bundle arguments) {
- if ( arguments != null ) {
- classNameForIntent = arguments.getString(launchActivityName);
- }
- if ( classNameForIntent == null ) {
- classNameForIntent = DEFAULT_ACTIVITY ;
- }
- super.onCreate(arguments);
- mIntent.setClassName("com.company.example",
- "com.company.example.ui.activity." + classNameForIntent);
- start();
- }
- /**
- * Calls LaunchApp and finish.
- */
- @Override
- public void onStart() {
- super.onStart();
- LaunchApp();
- finish(Activity.RESULT_OK, mResults);
- }
- }
当开始测试时,Instrumentation启动,onStart方法执行时,运行LaunchApp()方法启动被测试的Activity.运行完成后finish。
Instrumentation退出,测试结束。
三、修改AndroidManifest.xml文件
在Manifest文件中增加Instrumentation申明
- <instrumentation
- android:label="Activity Launch Performance"
- android:name="com.company.example.test.performance.ActivityLaunchPerformanceTest"
- android:targetPackage="com.company.example" />
四、运行Activity启动性能的测试用例
- adb shell am instrument -e launch_activity HomeActivity -w com.company.example.test/.performance.ActivityLaunchPerformanceTest
测试结果大致如下:
- INSTRUMENTATION_RESULT: other_pss=7437
- INSTRUMENTATION_RESULT: java_allocated=4839
- INSTRUMENTATION_RESULT: global_freed_size=2583696
- INSTRUMENTATION_RESULT: native_private_dirty=1684
- INSTRUMENTATION_RESULT: native_free=81
- INSTRUMENTATION_RESULT: global_alloc_count=51608
- INSTRUMENTATION_RESULT: other_private_dirty=5468
- INSTRUMENTATION_RESULT: global_freed_count=18818
- INSTRUMENTATION_RESULT: sent_transactions=-1
- INSTRUMENTATION_RESULT: java_free=2784
- INSTRUMENTATION_RESULT: received_transactions=-1
- INSTRUMENTATION_RESULT: pre_sent_transactions=-1
- INSTRUMENTATION_RESULT: other_shared_dirty=7300
- INSTRUMENTATION_RESULT: pre_received_transactions=-1
- INSTRUMENTATION_RESULT: execution_time=749
- INSTRUMENTATION_RESULT: native_size=4772
- INSTRUMENTATION_RESULT: native_shared_dirty=620
- INSTRUMENTATION_RESULT: cpu_time=678
- INSTRUMENTATION_RESULT: java_private_dirty=320
- INSTRUMENTATION_RESULT: native_allocated=4690
- INSTRUMENTATION_RESULT: gc_invocation_count=5
- INSTRUMENTATION_RESULT: java_shared_dirty=1972
- INSTRUMENTATION_RESULT: global_alloc_size=3883815
- INSTRUMENTATION_RESULT: java_pss=2618
- INSTRUMENTATION_RESULT: java_size=7623
- INSTRUMENTATION_RESULT: native_pss=1699
- INSTRUMENTATION_CODE: -1
其它参数有兴趣的话可参照Instrumentation源码。
五、对测试结果进行文本处理
1.进行格式化处理
- adb shell am instrument -e launch_activity HomeActivity -w com.company.example.test/.performance.ActivityLaunchPerformanceTest | sed 's/=/:/' | sed 's/ //' | sed 's/\r//'
2.编写gawk脚本,名字为txt_to_xml.gawk
- #!/bin/bash
- BEGIN{
- print "<?xml version=\"1.0\" encoding=\"UTF-8\"?>"
- print "<testsuite>"
- FS=":"
- }
- $2 ~ /execution_time|cpu_time/{
- print "<testcase name=\"" $2 "\" time=\"" $NF*0.001
- print "\" />"
- }
- END{
- print "</testsuite>"
- }
最终执行测试用例的命令如下:
- adb shell am instrument -e launch_activity HomeActivity -w com.company.example.test/.performance.ActivityLaunchPerformanceTest | sed 's/=/:/' | sed 's/ //' | sed 's/\r//' | gawk -f txt_to_xml.gawk > TEST-HomeActivity.xml
- <?xml version="1.0" encoding="UTF-8"?>
- <testsuite>
- <testcase name="execution_time" time="0.939
- " />
- <testcase name="cpu_time" time="0.85
- " />
- </testsuite>
六、Jenkins结果展示
测试用例可以使用命令行方式执行,因此也就可以使用Jenkins完成自动化测试,且对于生成的单元测试格式的xml报告,可以使用Jenkins的Performance Plugin 插件进行图表化展示:


 1259
1259


 被折叠的 条评论
为什么被折叠?
被折叠的 条评论
为什么被折叠?
 到【灌水乐园】发言


