


目录:
(1)Prometheus基本原理和使用
(2)Springboot中集成Prometheus
Prometheus是一个开源的监控和告警系统,于2016年加入了CNCF(Cloud Native Computing Foundation)基金会,成为了继kubernetes之后的第二个托管项目。
介绍
Prometheus是一个开源的监控和告警系统,于2016年加入了CNCF(Cloud Native Computing Foundation)基金会,成为了继kubernetes之后的第二个托管项目。在Kubernetes容器管理系统中,通常会搭配prometheus进行监控,同时也支持多种exporter采集数据。
Prometheus天然具有对容器的适配性,可非常方便的满足容器的监控需求,也可以用来监控传统资源。近年来随着kubernetes容器平台的火爆,Prometheus的热度也在不断上升,大有超越老牌监控系统Zabbix的趋势,目前已经在众多公司得到广泛使用。
特点
- 多维度数据模型,这些数据是时间有序的,由metric指标名称和一系列键值对组成
- 灵活的查询语言-PromQL,支持对采集到的指标数据进行相加,相乘和连接等操作
- 可以存储在本地,而不依赖于分布式存储
- 可以基于HTTP来pull数据
- 也可以通过中间网关来push数据
- 可通过服务发现或者静态配置方式来发现目标服务对象
- 有多种可视化图形界面,如Grafana
架构
Prometheus生态包含许多组件,主要是:
- Server
用于收集和存储时序数据。 - Client Libraries
客户端库,用于检测应用程序代码,当Prometheus抓取实例的HTTP端点时,客户端库会将所有跟踪的metrics指标的当前状态发送到prometheus服务端。 - Push Gateway
支持短期任务 - Exporter
Prometheus支持多种exporter,通过exporter可以采集到metrics数据并发送到prometheus服务端。所有向prometheus提供监控数据的程序都可以被称为exporter。 - AlertManager
对告警数据进行处理,包括分组,去重,路由给各个不同的接收方,如电子邮件等。 - 可视化工具
监控指标可视化工具,如grafana等。
组件图如下:
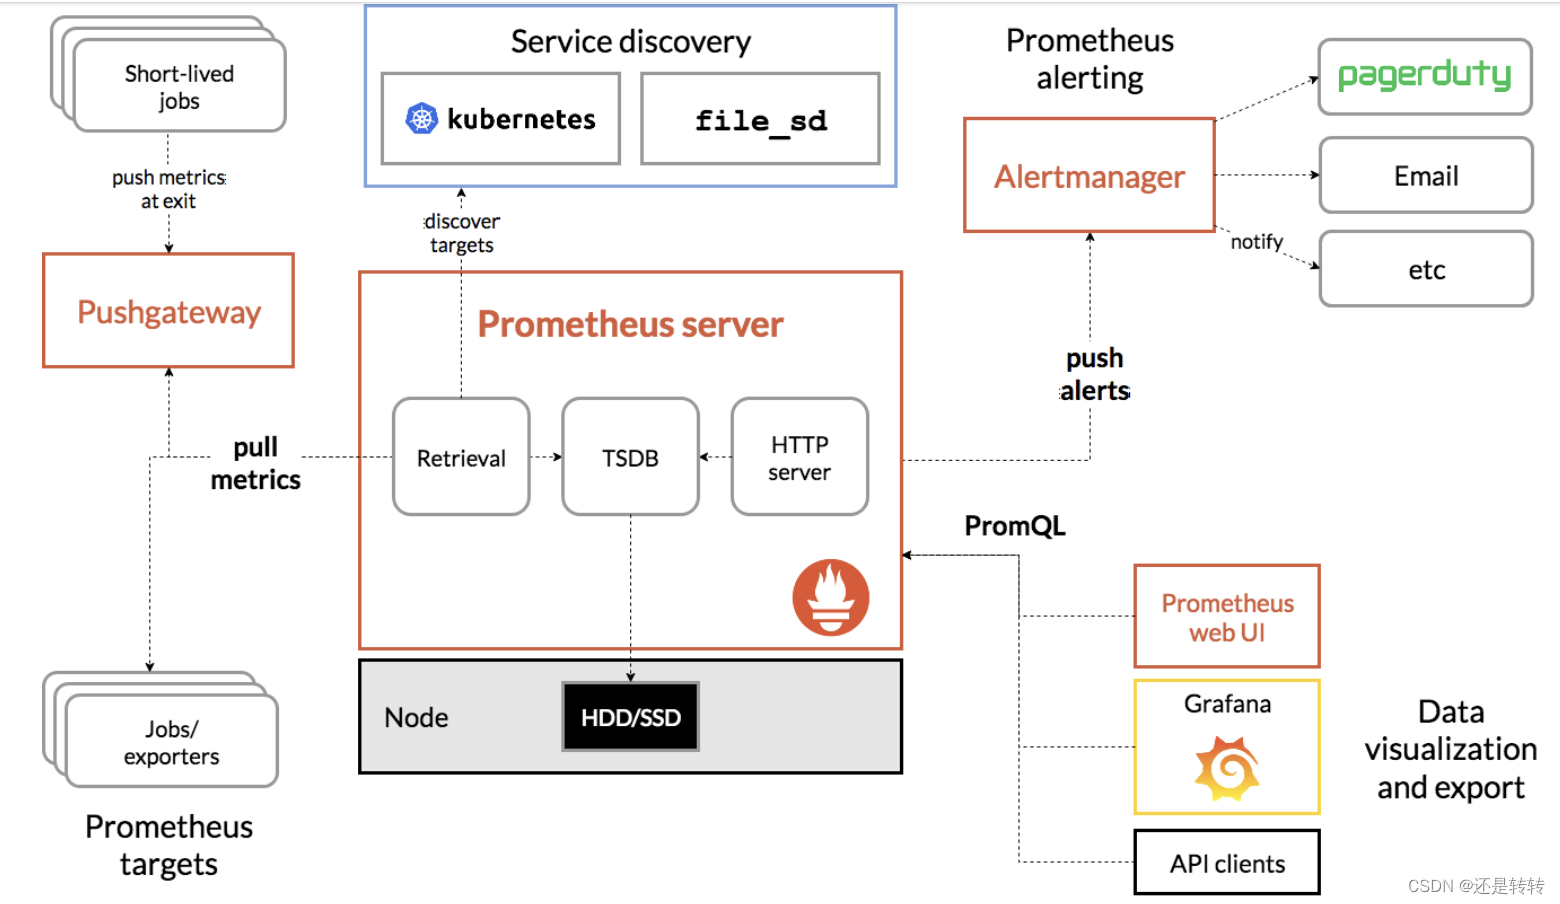
其中最主要的是Prometheus Server,负责数据采集和存储,提供PromQL查询语言支持。它包含了三个插件:
- Retrieval: 获取监控数据
- TSDB: Time Series Database, 时间序列数据库,用于储存时序数据
- HTTP Server: 为可视化界面或告警提供查询接口
工作原理
服务发现
Prometheus可通过多种方式发现要监控的资源列表,包括:
- 用户提供的静态资源列表。
- 基于文件的发现。
- 自动发现,如使用DNS SRV记录来生成列表或通过查询Consul等配置中心获取信息。
指标收集
Prometheus根据配置的job定时去拉取各个监控节点的数据,任何组件只要提供对应的HTTP接口就可以接入监控,不需要任务SDK或其他集成过程,非常适合虚拟化环境的监控,如kubernetes、Docker等。
默认的拉取方式为pull,也可以使用pushgateway提供的push方式获取各个监控节点的数据,并将获取到的数据存入TSDB。
数据查询
Prometheus提供一套内置的PromQL语言,其自带的Web-UI查询数据支持按条件表达式的方式查询相关监控数据。
可视化
Prometheus自带的Web-UI可支持图表展示,但功能及界面较简陋,常规方案是接入grafana进行展示和管理。
聚合告警
Prometheus Server没有内置告警工具,程序基于配置的rules发送告警信息到Alertmanager,由AlertManager对告警信息进行统一处理。
Alertmanager支持对告警信息进行聚合和收敛,并通过邮箱、短信、微信等多种告警方式发送给相关接收人。
安装使用
从官网下载并解压,然后进入文件夹,执行./prometheus即可启动。
访问localhost:9090,可以看到ui界面,如下所示:
配置prometheus
prometheus的配置文件即prometheus.yml默认如下:
# my global config
global:
  scrape_interval: 15s # Set the scrape interval to every 15 seconds. Default is every 1 minute.
  evaluation_interval: 15s # Evaluate rules every 15 seconds. The default is every 1 minute.
  # scrape_timeout is set to the global default (10s).

# Alertmanager configuration
alerting:
  alertmanagers:
    - static_configs:
        - targets:
          # - alertmanager:9093

# Load rules once and periodically evaluate them according to the global 'evaluation_interval'.
rule_files:
  # - "first_rules.yml"
  # - "second_rules.yml"

# A scrape configuration containing exactly one endpoint to scrape:
# Here it's Prometheus itself.
scrape_configs:
  # The job name is added as a label `job=<job_name>` to any timeseries scraped from this config.
  - job_name: "prometheus"

    # metrics_path defaults to '/metrics'
    # scheme defaults to 'http'.

    static_configs:
      - targets: ["localhost:9090"]
从配置文件看主要有三块,分别是global,rule_files和scrape_configs.
其中,global主要控制Prometheus server的全局配置。配置文件中的两个参数分别表示从监控目标抓取数据和对告警规则进行计算的频率。
rule_files指定了告警规则。
scrape_configs控制prometheus监控的资源。
Prometheus自身的数据也通过HTTP端点对外暴露,所以甚至可以监控它自身的健康状况。在默认配置文件里有一个prometheus任务,该任务负责从Prometheus服务器上抓取时序数据。抓取路径为:http://localhost:9090/metrics. 访问该路径就能看到prometheus抓取的自身的数据,如下所示:
# HELP go_gc_duration_seconds A summary of the pause duration of garbage collection cycles.
# TYPE go_gc_duration_seconds summary
go_gc_duration_seconds{quantile="0"} 3.1208e-05
go_gc_duration_seconds{quantile="0.25"} 7.8833e-05
go_gc_duration_seconds{quantile="0.5"} 0.000214208
go_gc_duration_seconds{quantile="0.75"} 0.000787042
go_gc_duration_seconds{quantile="1"} 0.002139667
go_gc_duration_seconds_sum 0.008898208
go_gc_duration_seconds_count 17
# HELP go_goroutines Number of goroutines that currently exist.
# TYPE go_goroutines gauge
go_goroutines 35
# HELP go_info Information about the Go environment.
# TYPE go_info gauge
go_info{version="go1.18.3"} 1
# HELP go_memstats_alloc_bytes Number of bytes allocated and still in use.
# TYPE go_memstats_alloc_bytes gauge
go_memstats_alloc_bytes 1.87376e+07
# HELP go_memstats_alloc_bytes_total Total number of bytes allocated, even if freed.
# TYPE go_memstats_alloc_bytes_total counter
go_memstats_alloc_bytes_total 1.8971756e+08
go_memstats_frees_total 340507
...
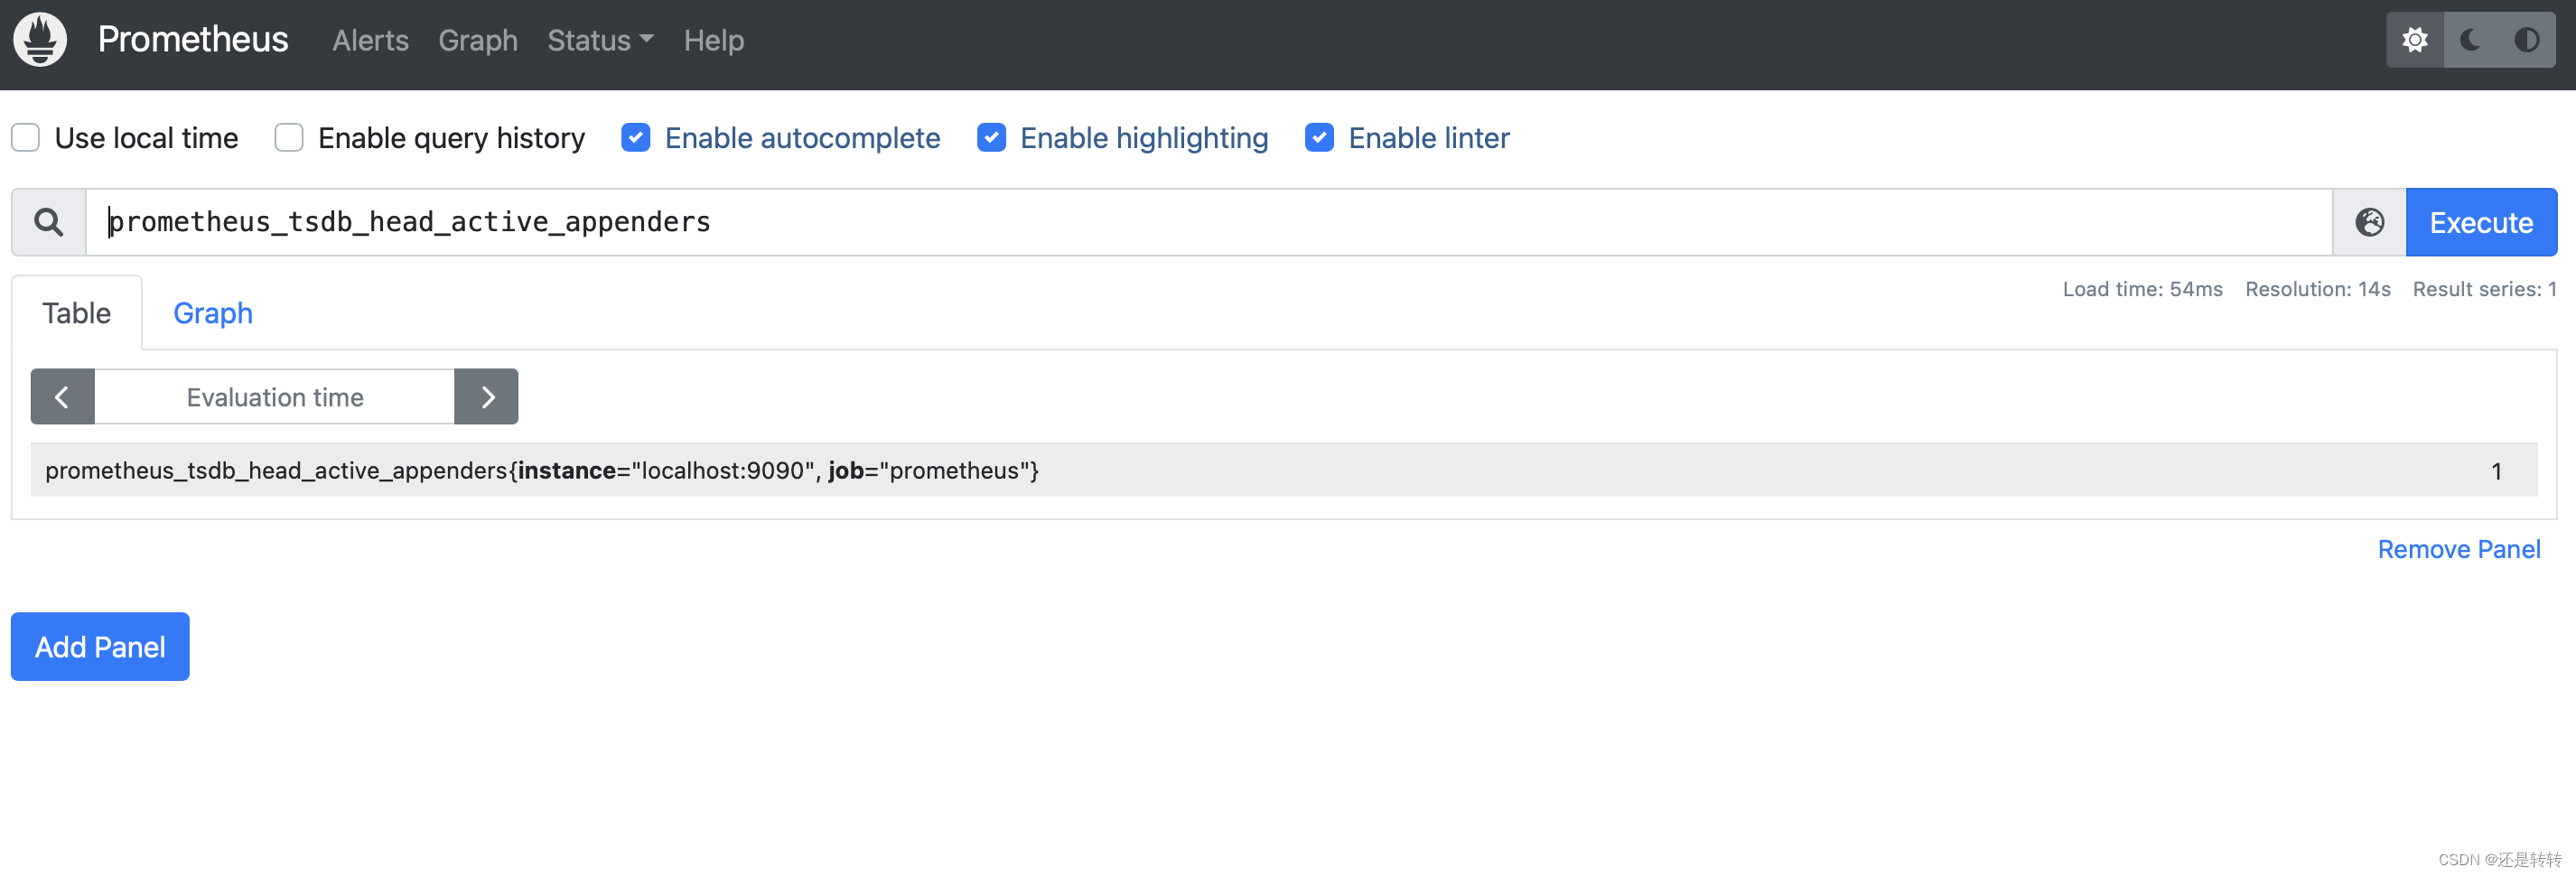
指标查询表达式
默认的job收集的prometheus自身的监控指标(也就是http://localhost:9090/metrics看到的数据)名称为promhttp_metric_handler_requests_total ,表示访问/metrics的请求总数。
只需要在搜索框输入指标名称就能查看监控面板了:

这个指标里包含了不同的标签,如果只对返回码为200的请求感兴趣,可以这样写查询语句:
promhttp_metric_handler_requests_total{code="200"}
如果想统计总数,可以这样写:
count(promhttp_metric_handler_requests_total)
切换成图表(graph)展示,统计每秒钟返回状态码为200的请求数:
rate(promhttp_metric_handler_requests_total{code="200"}[1m])
结果如下:
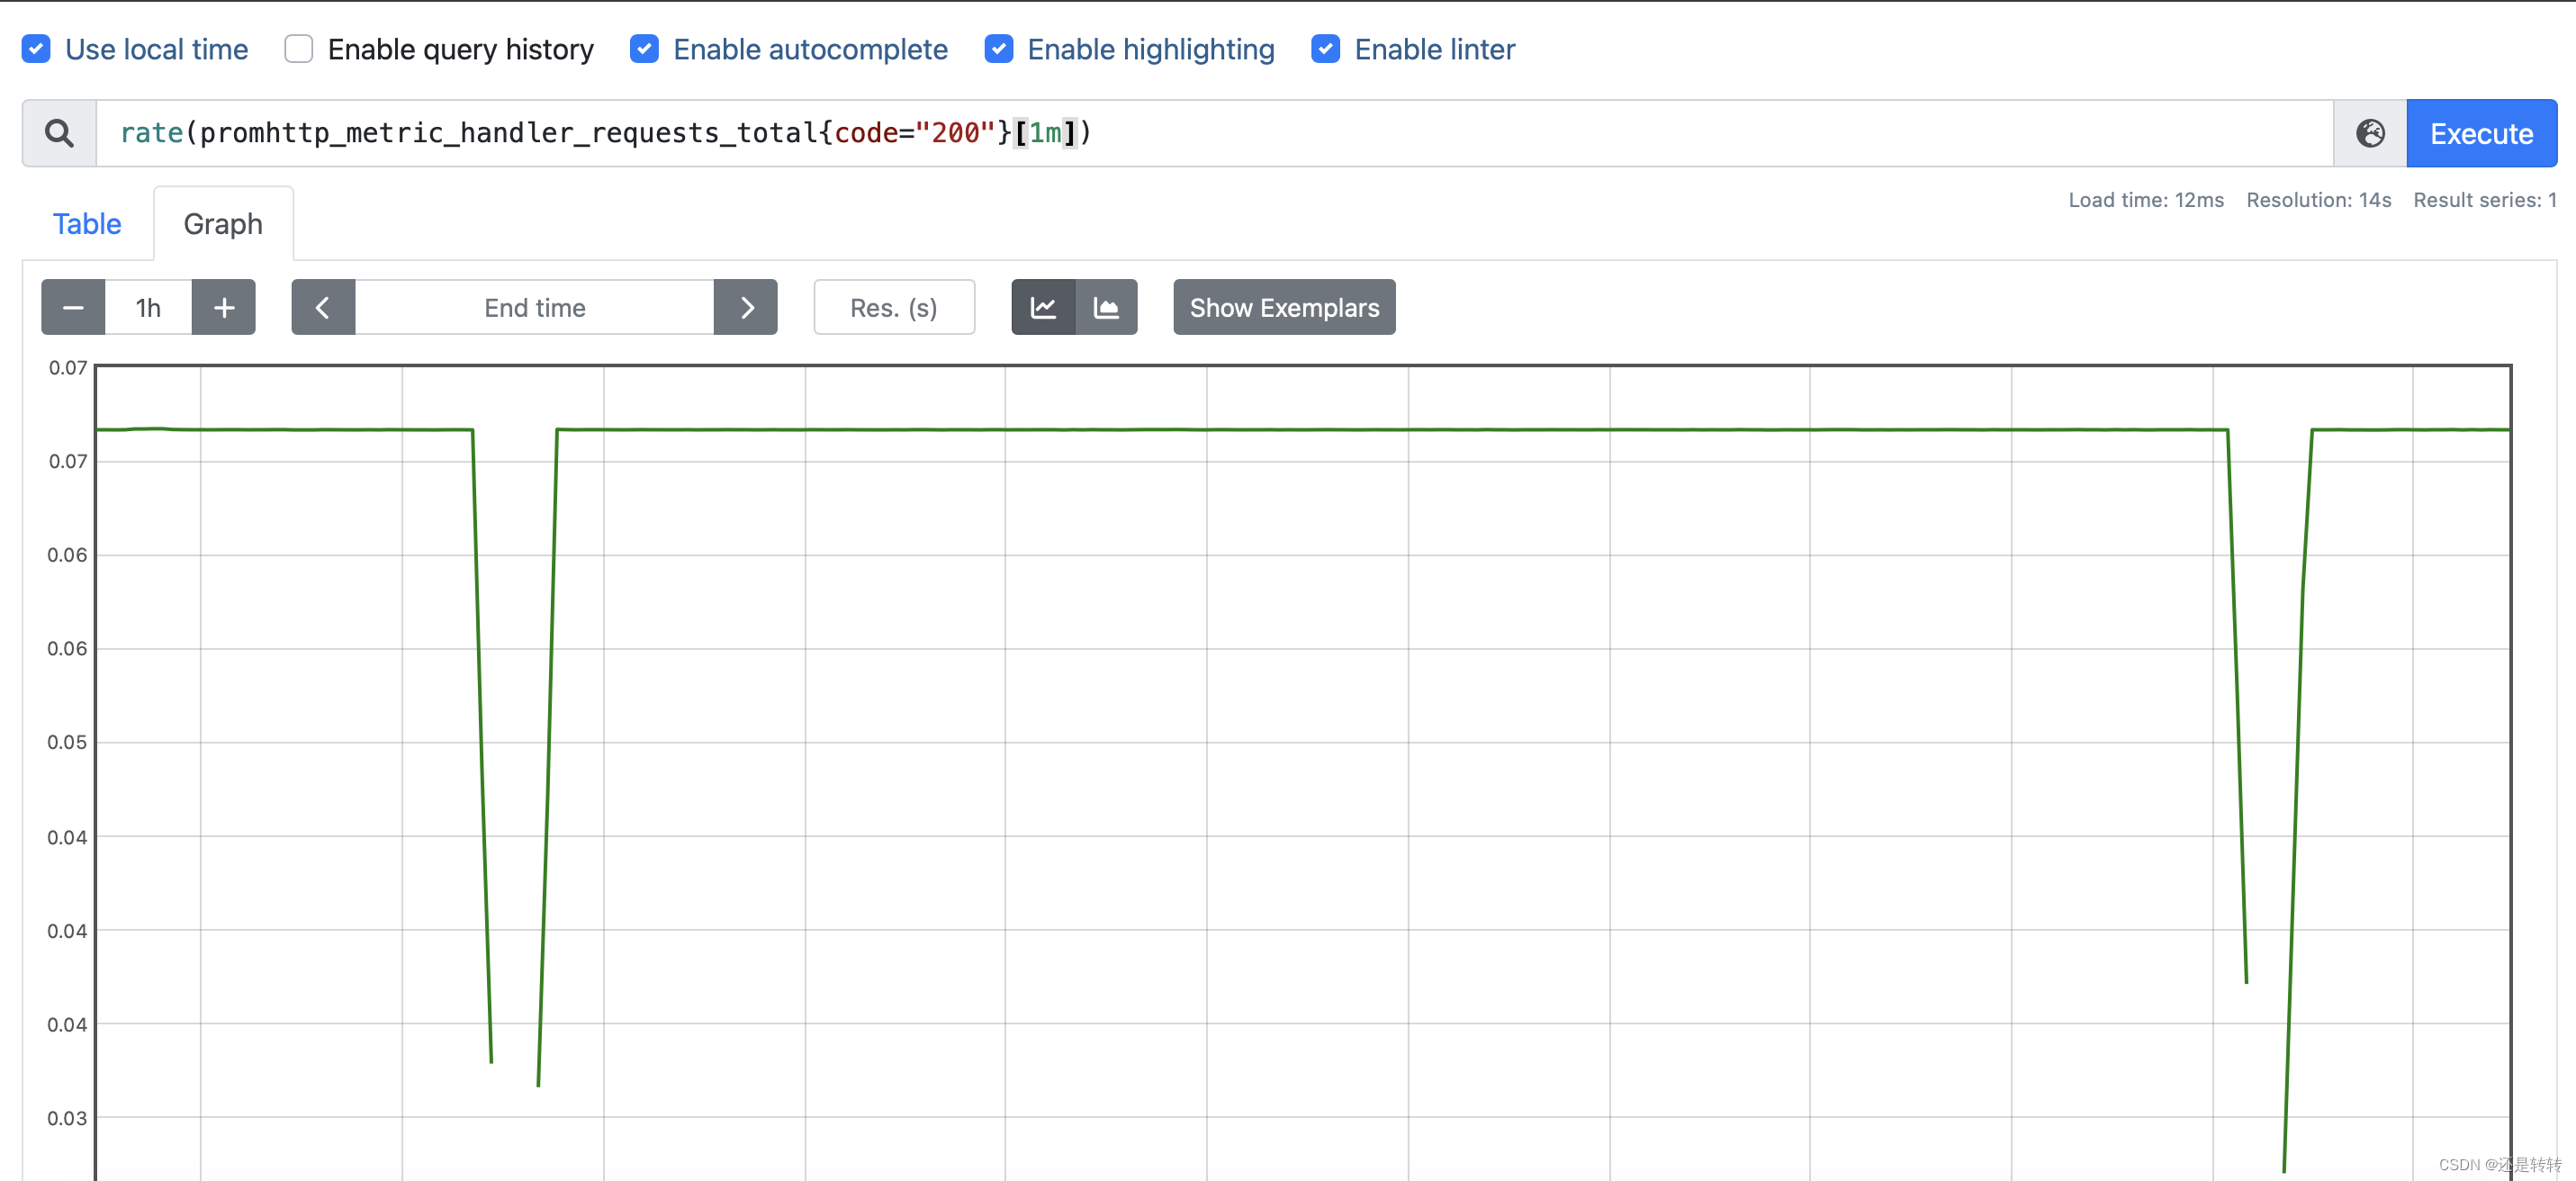
这里用prometheus监控自身的指标数据进行举例,但实际上,收集prometheus自身的指标数据并不是prometheus的目的,其最终目的是监控业务系统所在的服务器。具体内容将在下文介绍。
基本概念
数据模型
Prometheus存储的数据都是时序数据。
每条数序数据都是由指标名和一系列标签组成。
指标名就是要监控的指标名称,比如http_requests_total表示http请求总数。指标名由数字、字母、下划线和冒号组成。
注意:冒号是预留给用户自定义指标使用的,不能用在exporter或者监控对象直接暴露的指标中。
标签可以从多维度来描述prometheus收集的数据。标签名可以由字母,数字或下划线组成。需要注意,以__开头的标签表示是内置标签。
标签值可以为空,此时表示该标签实际不存在。
下面是完整的prometheus数据的格式:
<metric name>{<label name>=<label value>, ...}
指标统计类型
Prometheus客户端库提供了四种指标统计类型,分别是:Counter, Guage, Histogram和Summary。
Counter
counter是一个计数器,且计数只能增加,不能减少。当系统重启时,计数则重新从0开始。
可以用counter来统计请求数或者错误数。不要用counter来统计可能减少的指标,如当前正在运行的进程。
Gauge
相比于counter,gauge统计的指标可以减少。通常用来衡量温度或者当前使用的内存。
Histogram
直方统计可以对观测到的样本值进行数量统计、总量统计和求和统计。通常用于统计请求耗时。举个栗子,假如有6个请求,耗时分别是:0.35s, 0.12s,0.21s, 1.1s, 1.2s, 2.3s。现对请求耗时request_time统计的结果如下:
[request_time]_bucket{le=“1”} = 3
[request_time]_bucket{le=“2”} = 2
[request_time]_bucket{le=“3”} = 1
[request_time]_count = 6
[request_time]_sum = 5.28
在每个bucket中统计落在这个bucket中的数据样本数量,每个bucket都有一个范围界限,比如上面例子中{le="1"]} 表示小于等于1的。
Summary
histogram只是做简单的分桶统计,而summary则是采样点分位数统计。
所谓分位数,就是百分比。Prometheus的分位数称为quantile,其实叫percentile更准确。
还是用请求时长举例,假设请求端点/hello,50%的请求在35ms内返回,90%的请求在94ms内返回,95%的请求在98ms内返回,99%的请求在100ms内返回。则统计结果为:
request_time{endpoint="/hello", quantile="0.5"}  35
request_time{endpoint="/hello", quantile="0.9"}  94
request_time{endpoint="/hello", quantile="0.95"}  98
request_time{endpoint="/hello", quantile="0.99"}  100
request_time_sum{endpoint="/hell0"}  1393
request_time_count{endpoint="/hell0"}  32
其中,sum表示请求耗时综合,count表示请求次数。
百分位请求时长就是这样统计出来的。
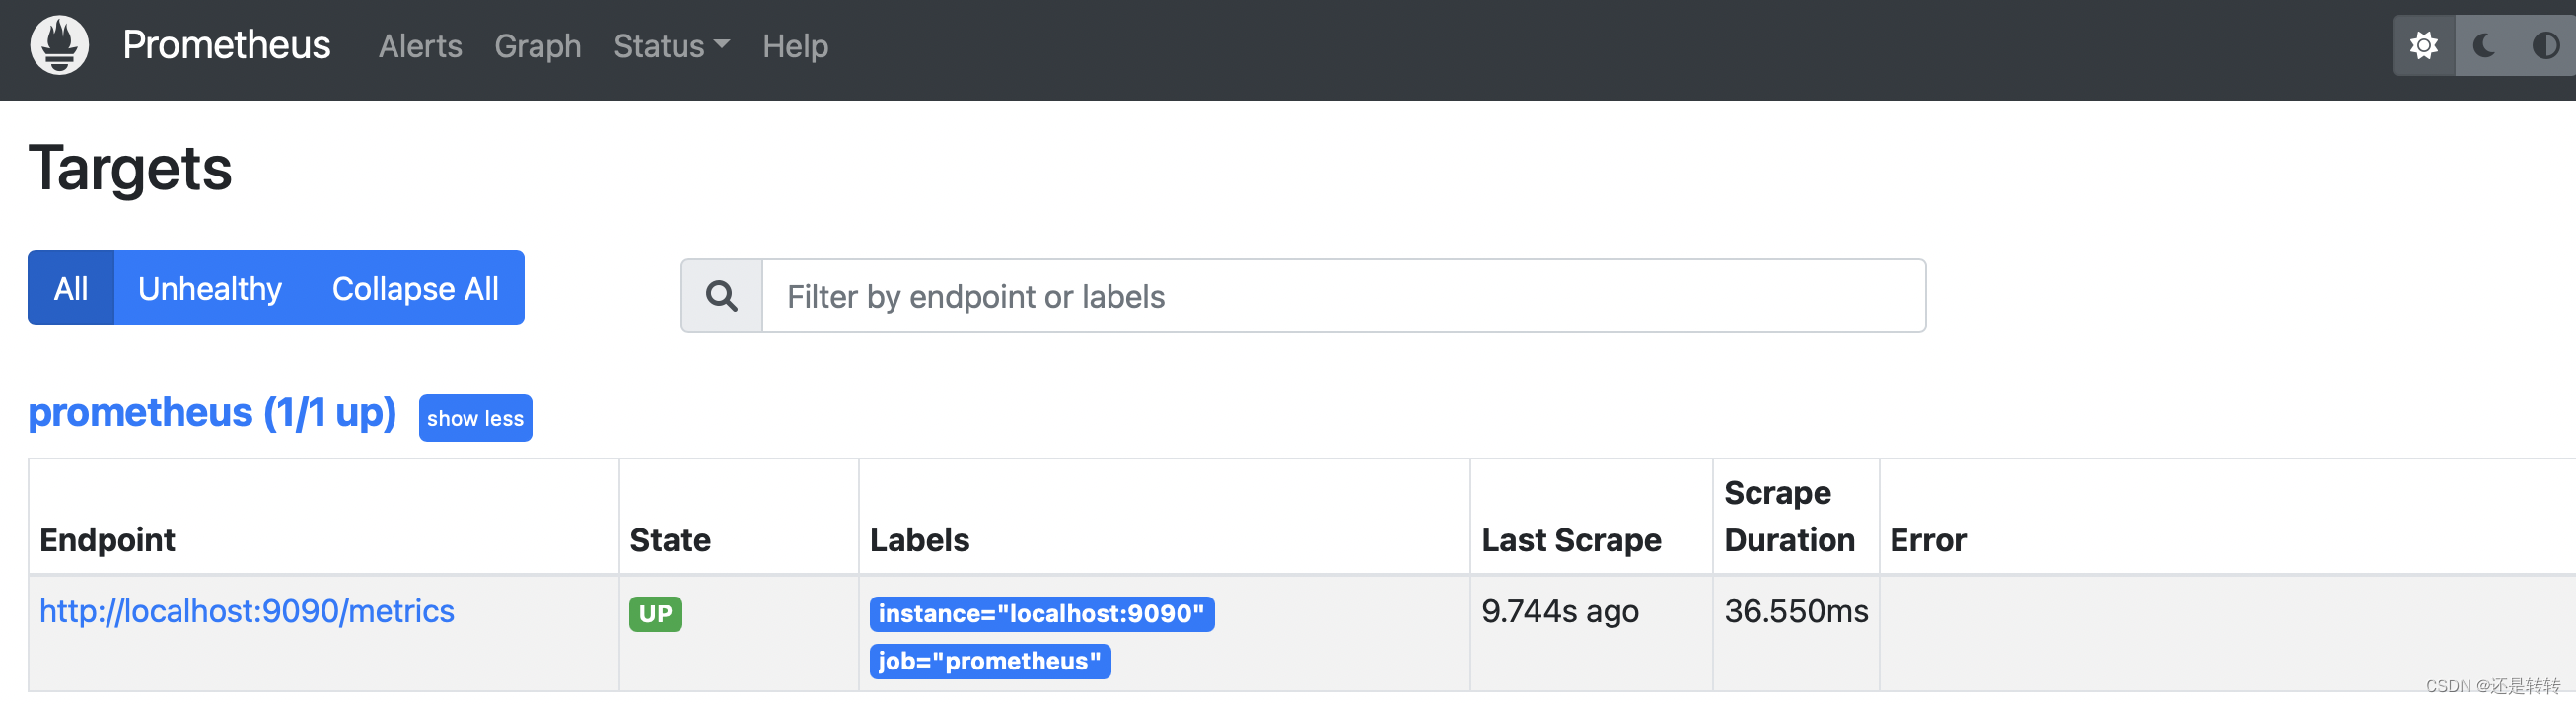
任务和实例
在Prometheus中,每一个提供样本数据的端点被称为一个实例。它可以是各种exporter,如node-exporter、mysql-exporter,也可以是你自己开发的一个服务。只要能提供符合prometheus要求的数据格式,并允许通过HTTP请求获取数据的端点都可称为实例。
而对于实例数据的采集,则是通过一个个任务来进行管理,每个任务都会管理一类相同业务的实例。
比如有一个Server任务:api-server,管理四个实例:1.2.3.4:5670, 1.2.3.4:5671, 5.6.7.8:5670, 5.6.7.8:5671。
在上文介绍过,prometheus配置文件的最后一块是scrape_configs,就是用于管理任务的。
在控制台的status菜单中选择Targets就可以看到相关的任务实例了,其中Endpoint项代表该实例的采集地址,State为实例状态,Labels为实例所拥有的标签。如下图所示:
Job配置
每个job都有一个任务名称,也对应一个标签:{job=“xxx”}。在搜索框中查询{job=“prometheus”},可以获取该任务相关的指标:
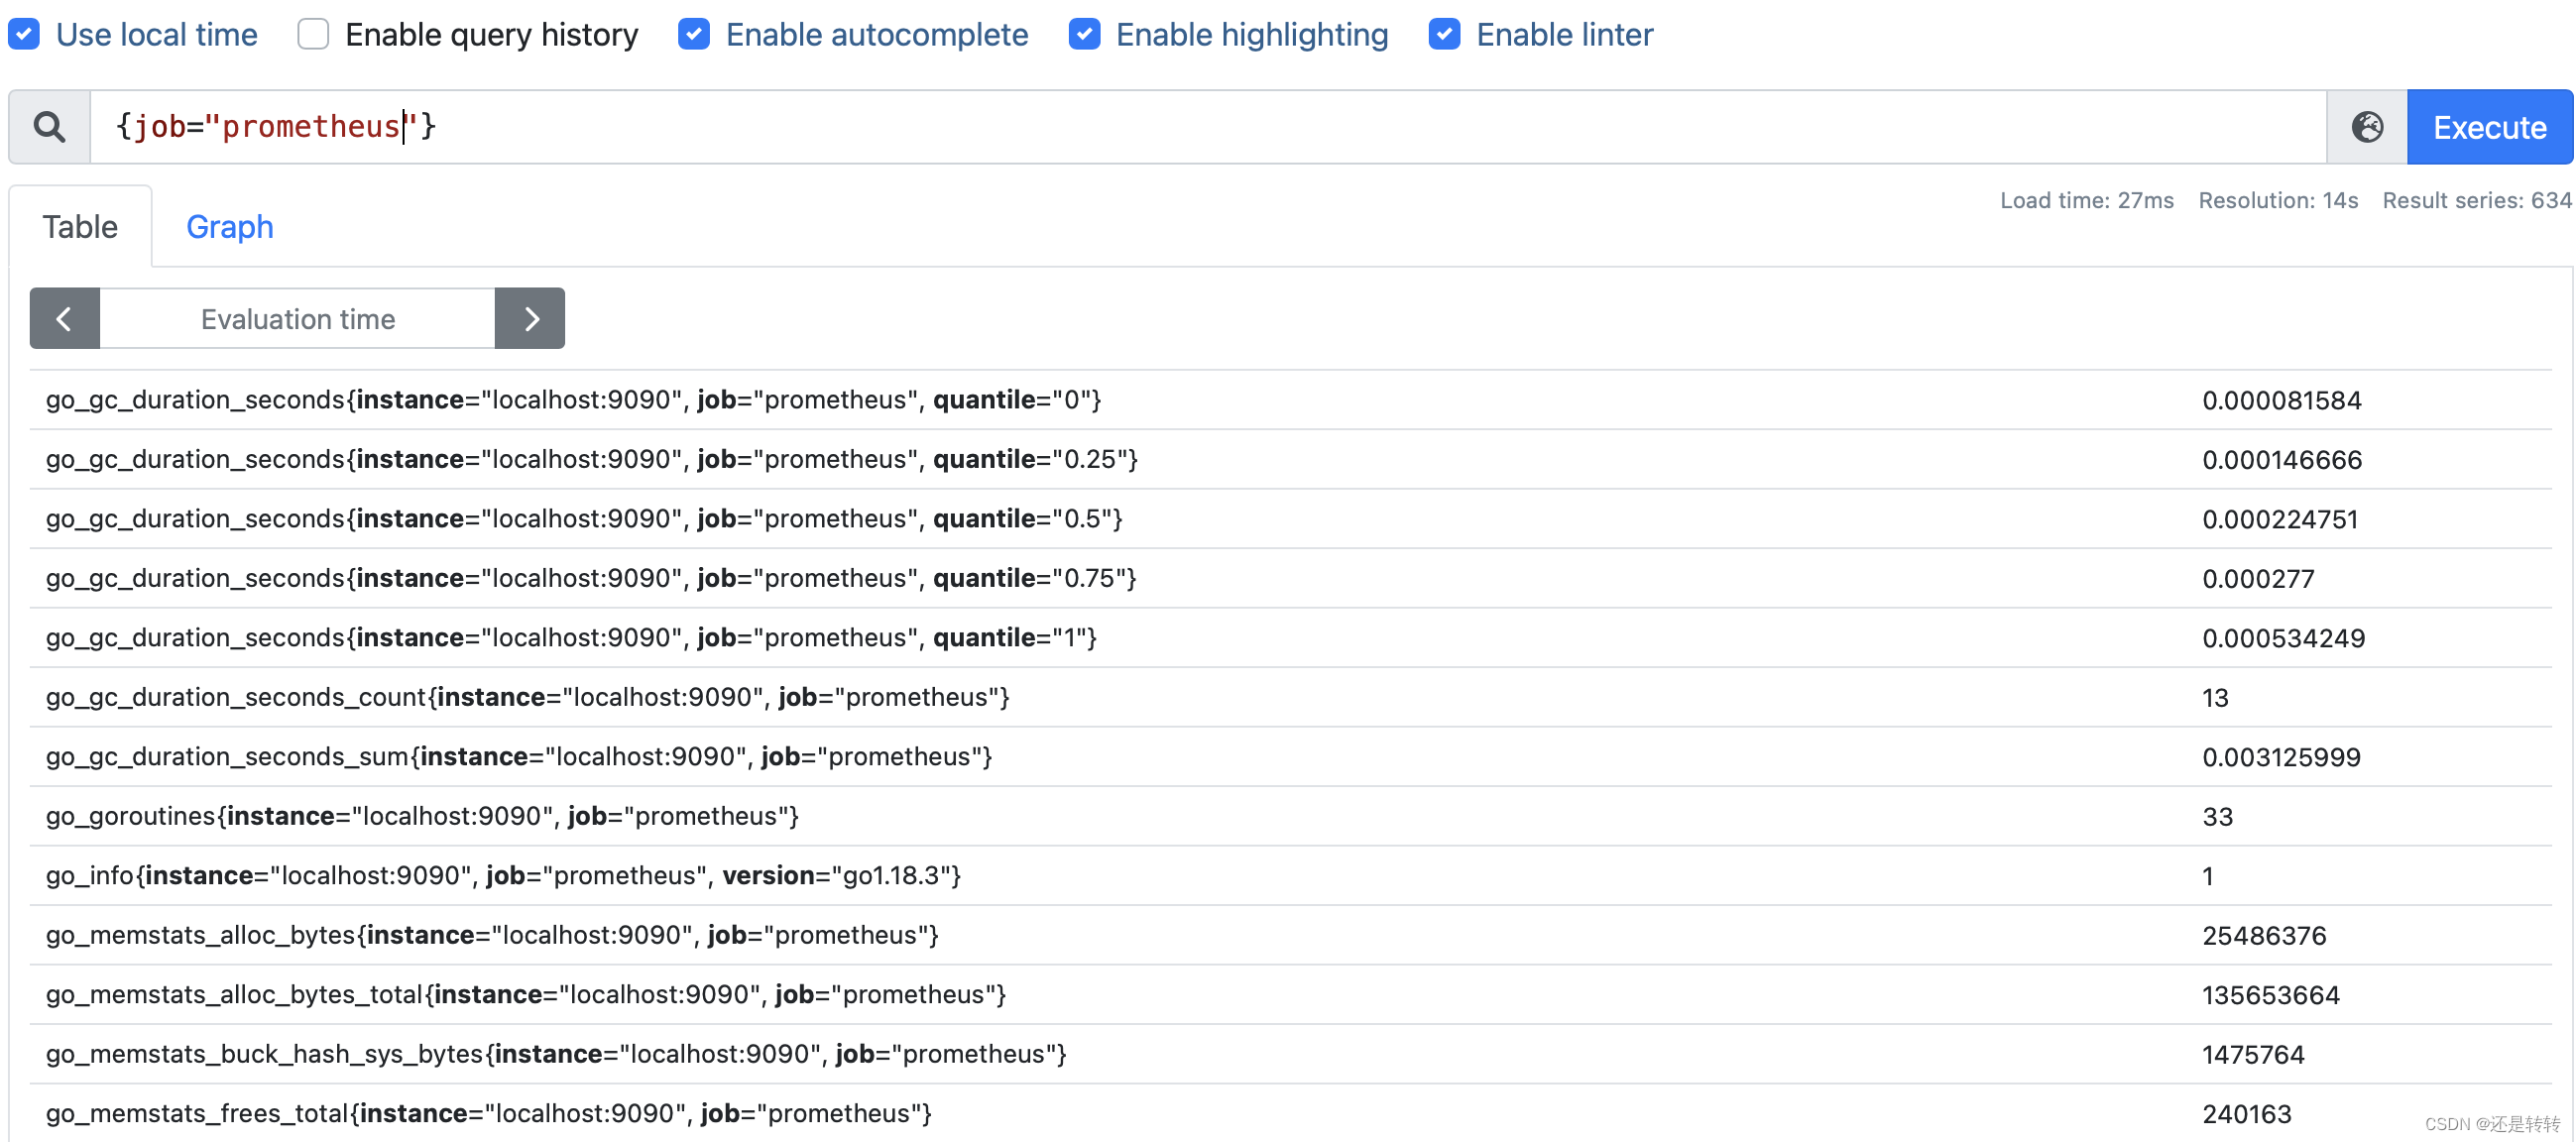
Job支持自定义标签。将prometheus的任务管理改成如下所示:
scrape_configs:
    - job_name: "prometheus"
      static_configs:
        - targets: ["localhost:9090"]
          labels:
             group: dev
重启prometheus,就能看到标签生效了:
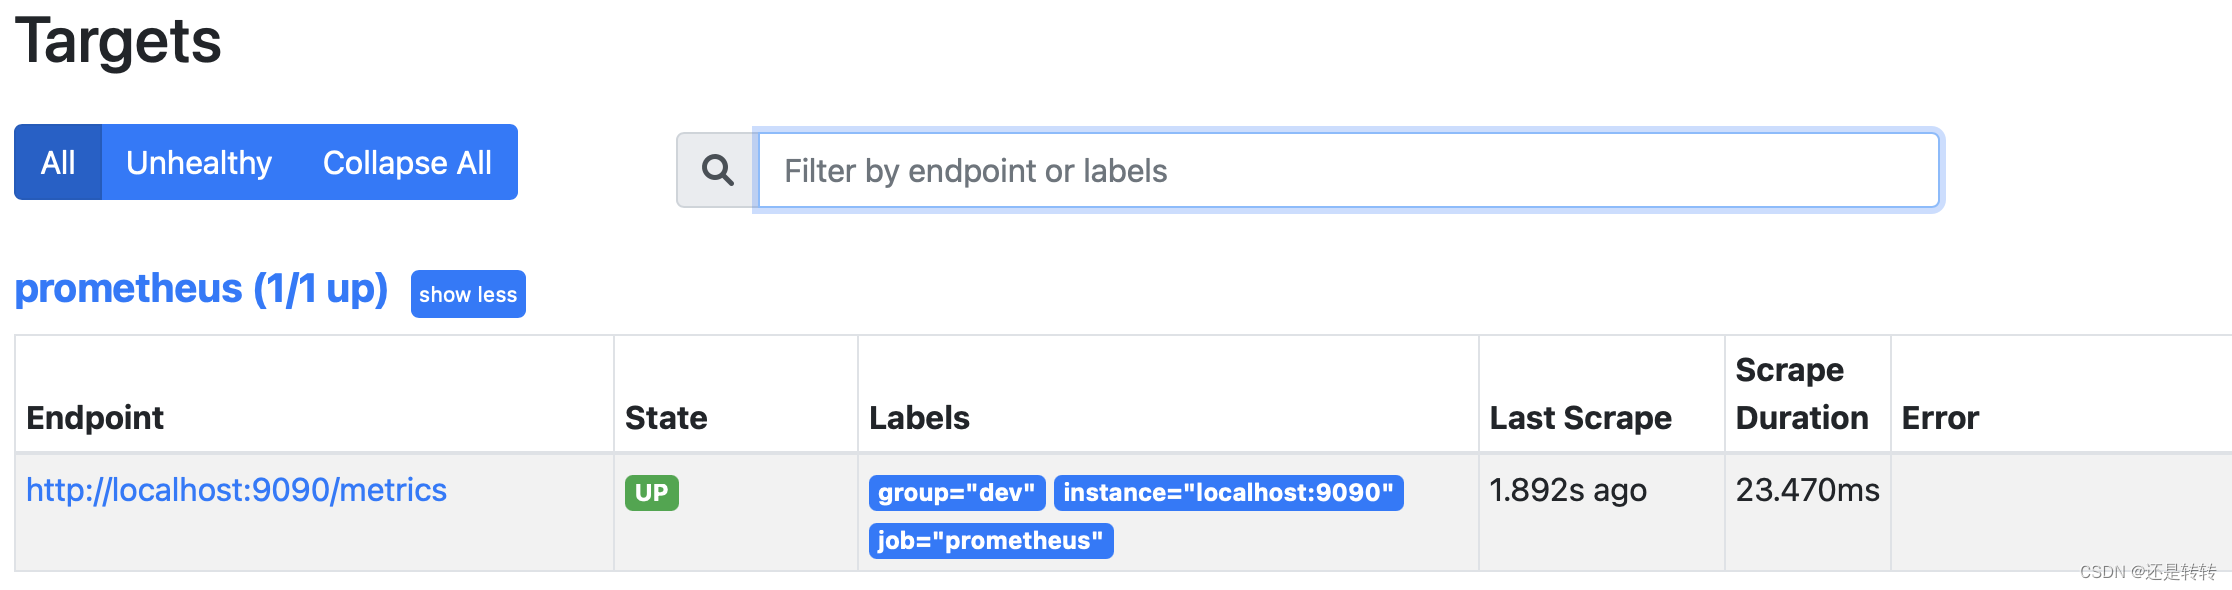
注意,修改job后只对新抓取的数据有效
static_configs
static_configs为静态配置,需要手动在配置文件中填写targets的目标信息,如下所示:
scrape_configs:
   - job_name: "myjob"
      static_configs:
      	- targets:
      	   - '192.168.0.1:9100'
      	   - '192.168.0.2:9100'
      	   - '192.168.0.3:9100'
prometheus对于监控实例的加载,除了静态配置,还可以使用文件配置的方式。只需要在文件中配置好实例信息,然后在job中加载文件即可,文件格式必须是yml或json格式。
/opt/prom/nodex-info.yml:
- targets:
   - '192.168.0.1:9100'
   - '192.168.0.2:9100'
   - '192.168.0.3:9100'
scrape_configs:
   - job_name: "myjob"
      static_configs:
      	- files:
      	   - /opt/prom/nodex-info.yml
另外,prometheus也支持基于kubernetes、DNS或配置中心的服务自动发现方式。
scrape_interval和scrape_timeout
scrape_interval表示抓取数据的间隔时间,scrape_timeout一次抓取的超时时间,默认继承global全局配置。但如果有需求,也可以对单个Job定义自己的参数。如:
scrape_configs:
  - job_name: 'myjob'
    scrape_interval: 15s
    scrape_timeout: 10s
    static_configs:
       - targets: ['192.168.0.1:9100']
注意:scrape_timeout时间不能大于scrape_interval
metric_path
指定抓取路径,如果不配置则默认为/metrics。
scrape_configs:
  - job_name: 'myjob'
    scrape_interval: 15s
    scrape_timeout: 10s
    metric_path: /metrics
    static_configs:
       - targets: ['192.168.0.1:9100']
scheme
指定采集所用协议,http或者https,默认为https。
params
某些特殊的exporter需要在请求中携带参数,如blackbox_exporter,可以通过params进行相关参数配置。
scrape_configs:
  - job_name: 'myjob'
    params:
      module: [http_2xx]
    static_configs:
    - targets: ['192.168.0.1:9100']
basic_auth
默认情况下,exporter不需要账号密码即可获取到相关监控数据,在某些安全要求较高的情况下,可能需要验证后才能获取监控数据,此时可通过basic_auth配置Prometheus的获取exporter信息时使用的账号密码。
scrape_configs:
  - job_name: 'myjob'
    static_configs:
    - targets: ['192.168.0.1:9100']
    basic_auth:
      username: test
      password: password
主机监控
Prometheus使用各种Exporter来监控资源,exporter可以堪称是监控的agent端,它负责收集对应资源的指标,并提供接口给Prometheus读取。不同的监控资源对应不同的exporter,如node-exporter、mysql-exporter、black-exporter等,其中最常见的就是node-exporter。
node-exporter使用go语言编写,主要用来监控主机系统的各项性能参数,可收集各种主机指标,还可以自定义指标。
安装node-exporter
二进制安装
下载安装包并解压:
$ wget https://github.com/prometheus/node_exporter/releases/download/v1.1.2/node_exporter-1.1.2.linux-amd64.tar.gz
$ tar -xvf tar -xvf node_exporter-1.1.2.linux-amd64.tar.gz
$ cd node_exporter-1.1.2.linux-amd64
注意,不同平台的安装包是不同的,这里是用linux平台举例。
启动Node Exporter $ ./node_exporter &
访问:http://ip:9100/metrics,就可以看到node-exporter获取的指标了。
docker安装
官方不建议通过Docker方式部署node-exporter,因为它需要访问主机系统。 通过docker部署的方式,需要把任何非根安装点都绑定到容器中,并通过–path.rootfs参数指定。
docker run -d --net="host" --pid="host" -v "/:/host:ro,rslave" prom/node-exporter --path.rootfs=/host
部署完成后,访问节点地址:http://ip:9100/metrics即可。
配置node-exporter
node-exporter提供了不少配置参数,可使用–help查看。
如果只想启用需要的收集器,其他的全部禁用,可用如下格式配置:
--collector.disable-defaults --collector.<name>
textfile收集器
在node-exporter中通过–help命令可以看到有很多收集器,其中有一个特殊收集器是textfile。
textfile允许用户暴露自定义指标,这些指标或者是没有相关exporter可以使用,或者是你自己可开发的应用指标。
textfile通过扫描指定目录中的文件,提取所有符合prometheus数据格式的字符串,然后暴露给prometheus进行抓取。
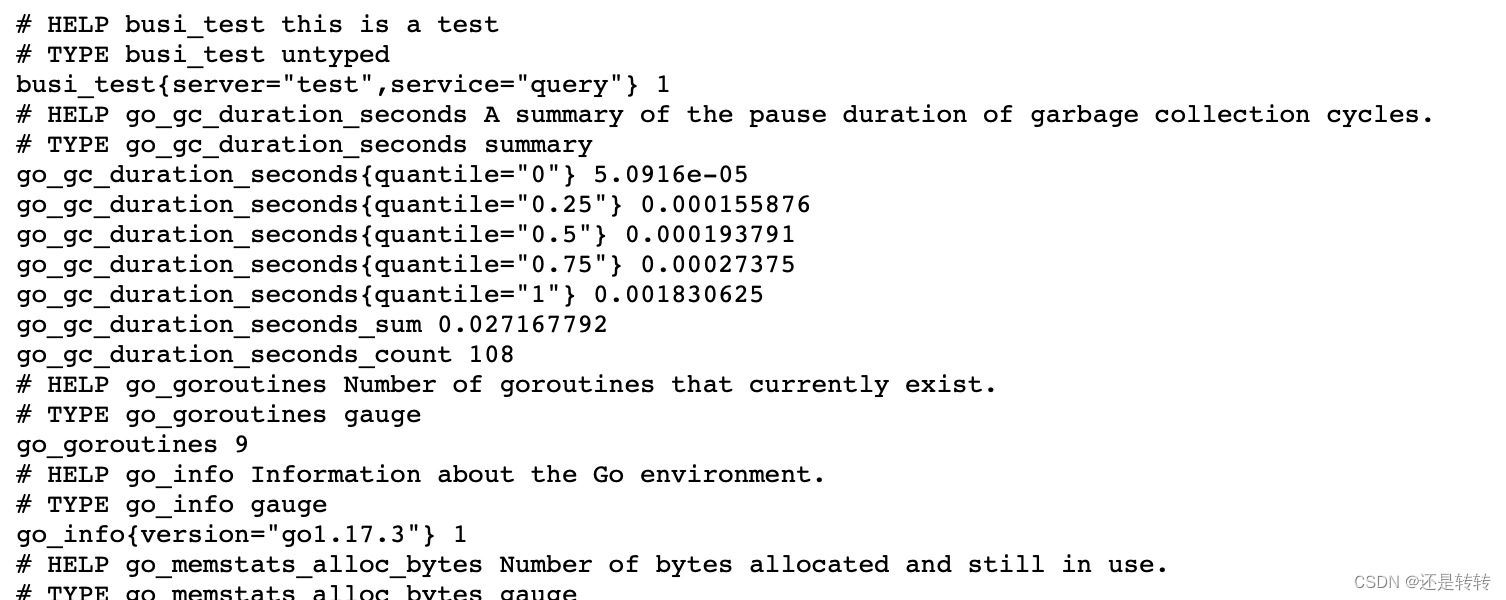
创建一个文件,内容如下:
busi_test{server="test", service="query"} 1
启用textfile:./node-exporter --collector.textfile.directory="/{file_path}" &
访问node-exporter的metrics地址,可看到指标已生效:
prometheus抓取主机指标
在prometheus中配置node-exporter的job,即可抓取node-exporter收集到的指标数据。
scrape_configs:
  - job_name: "node-exporter"
    scrape_interval: 10s
    scrape_timeout: 10s
    scheme: http
    static_configs:
    - targets: ["localhost:9100"]
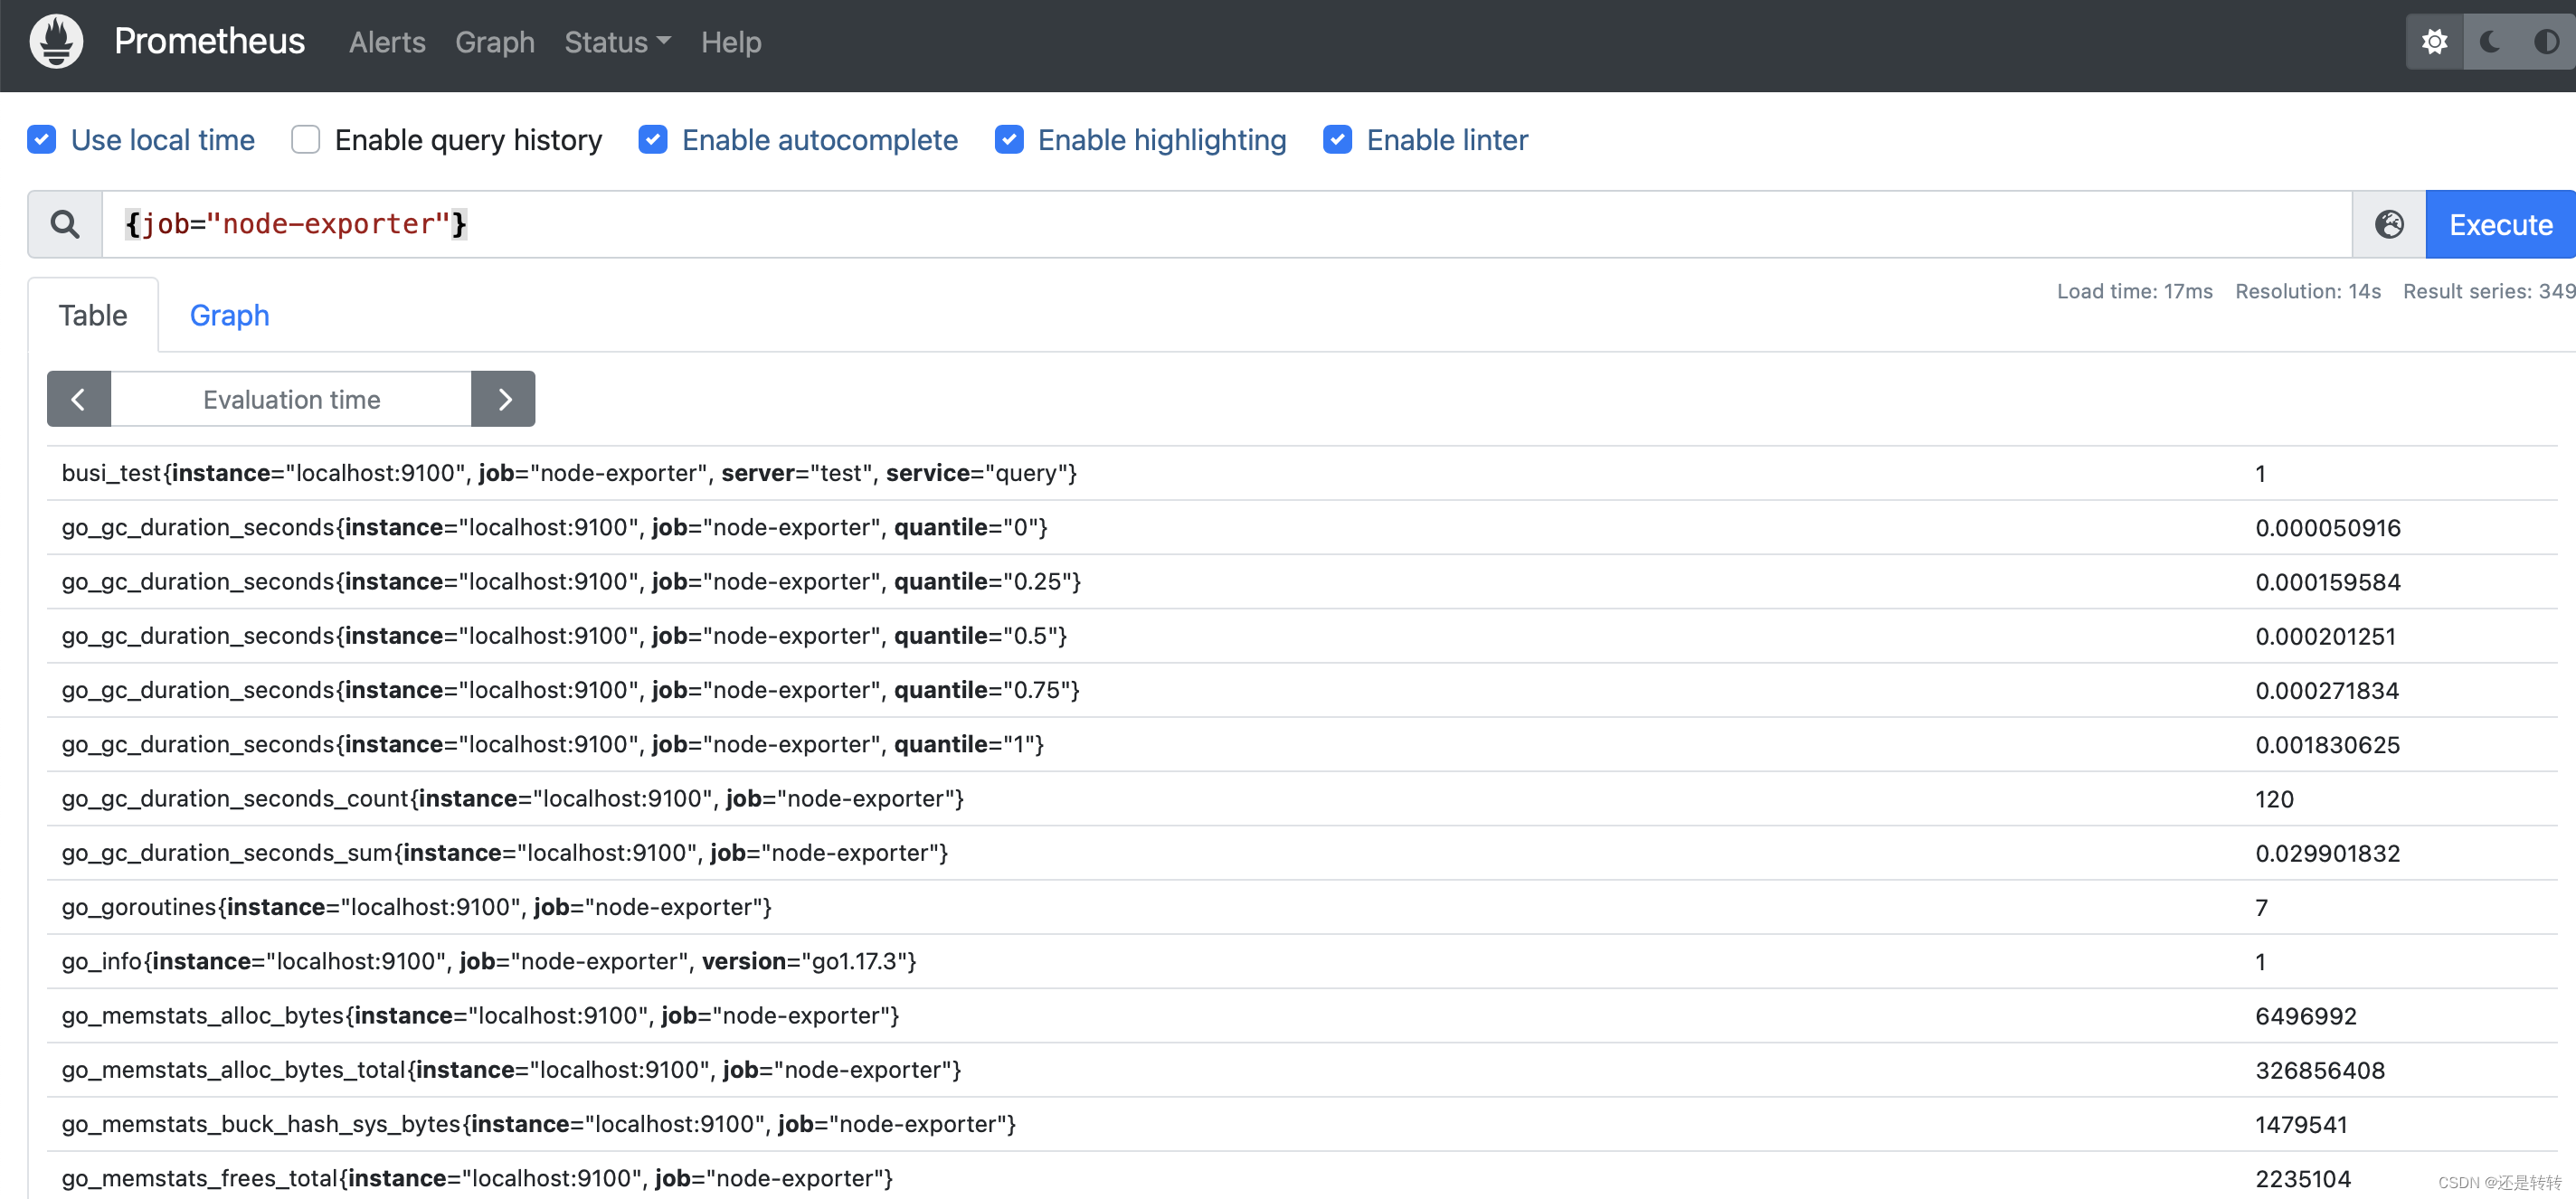
访问prometheus并搜索{job="node-exporter"}, 可查看node-exporter收集到的指标数据:
参考资料
[1]. https://prometheus.io/docs/introduction/
[2]. https://mafeifan.com/DevOps/Prometheus/
[3]. https://mafeifan.com/DevOps/Prometheus/
[4]. https://blog.51cto.com/u_14065119/3327716


 4507
4507


 被折叠的 条评论
为什么被折叠?
被折叠的 条评论
为什么被折叠?
 到【灌水乐园】发言


