


线性回归:
1.目标函数增加L2正则
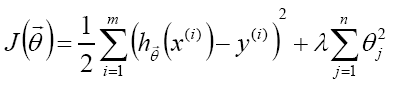
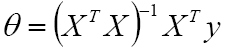
θ存在解析式:
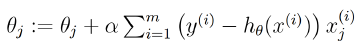
使用梯度下降进行解θ:=>
代码:
import numpy as np
def regression(data, alpha, lamda):
    n=len(data[0])-1
    theta=np.zeros(n)
    for i in range(30):
        for d in data:
            y_hat=np.dot(d[:-1],theta)
            y_loss=y_hat-d[-1:]
            theta=theta-alpha*y_loss*d[:-1]+lamda*theta
        print(i,theta)
data=[[1,1],[2,2],[3,3],[4,4],[5,5],[6,6],[7,7]]
regression(data,0.01,0.1)
Logistic回归:二分类
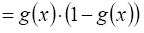
1.Logistic/sigmoid函数: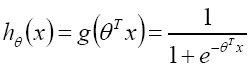 =>
=>
![]()
![]()
=>
代码:
import scipy as sp
import numpy as np
from sklearn.model_selection import train_test_split
from sklearn import metrics
from sklearn.linear_model import LogisticRegression
x = np.loadtxt("wine.data", delimiter=",", usecols=(1, 2, 3, 4, 5, 6, 7, 8, 9, 10, 11, 12, 13))  # 获取属性集
y = np.loadtxt("wine.data", delimiter=",", usecols=(0))  # 获取标签集
print(x)  # 查看样本
# 加载数据集,切分数据集80%训练,20%测试
x_train, x_test, y_train, y_test = train_test_split(x, y, test_size=0.2)  # 切分数据集
# 调用逻辑斯特回归
model = LogisticRegression()
model.fit(x_train, y_train)
print(model)  # 输出模型
# make predictions
expected = y_test  # 测试样本的期望输出
predicted = model.predict(x_test)  # 测试样本预测
# 输出结果
print(metrics.classification_report(expected, predicted))  # 输出结果,精确度、召回率、f-1分数
print(metrics.confusion_matrix(expected, predicted))  # 混淆矩阵
softmax回归:多分类
概率: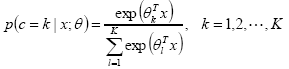
![]()
似然函数(似然函数是一种关于统计模型参数的函数。给定输出x时,关于参数θ的似然函数L(θ|x)(在数值上)等于给定参数θ后变量X的概率:L(θ|x)=P(X=x|θ)):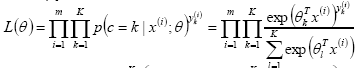
![]()
对数似然: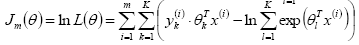
![]()
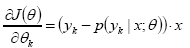
梯度:![]() =>
=>
![]()
代码:


 6346
6346

 被折叠的 条评论
为什么被折叠?
被折叠的 条评论
为什么被折叠?
 到【灌水乐园】发言


