


信号调制和解调
华中科技大学《数字信号分析理论实践》滤波器 学习总结记录
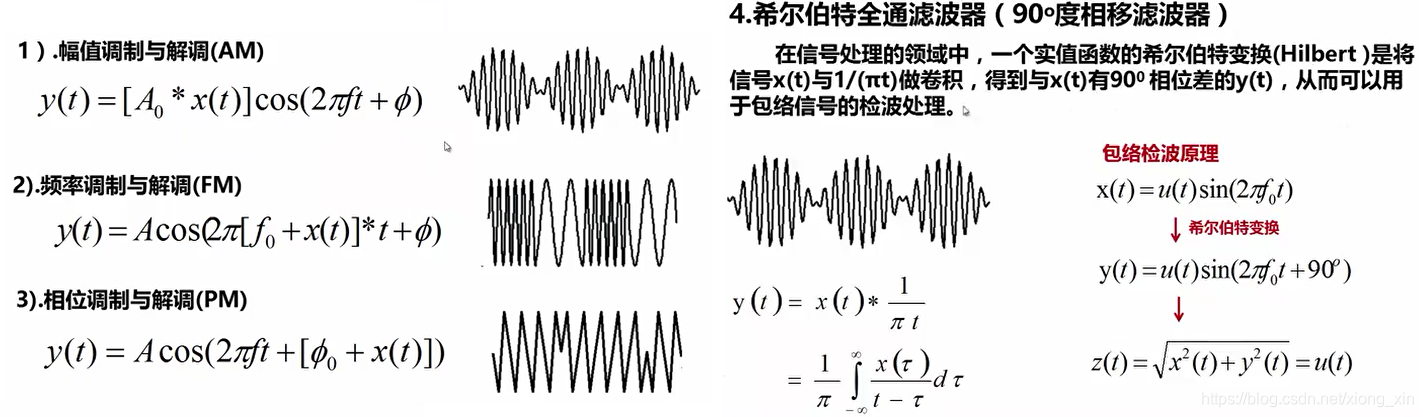
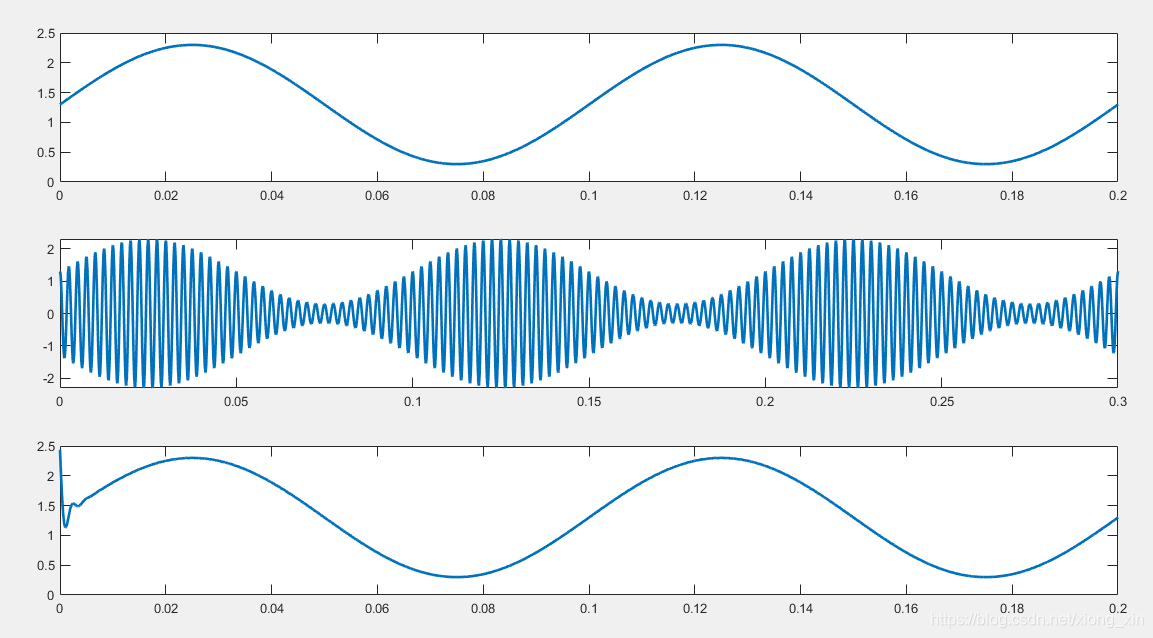
- 幅值调制和解调
AMammodamdemod
Fs = 44100;
Fc = 400;
dt = 1.0/Fs;
T = 1;
N = T/dt;
t = linspace(0,T,N);
x1 = sin(2*pi*10*t)+1.3;
subplot(311)
plot(t,x1,'linewidth',2)
xlim([0 0.2])
y1 = ammod(x1,Fc,Fs);
subplot(312)
plot(t,y1,'linewidth',2)
xlim([0,0.3])
y2 = amdemod(y1,Fc,Fs);
subplot(313)
plot(t,y2,'linewidth',2)
xlim([0,0.2])
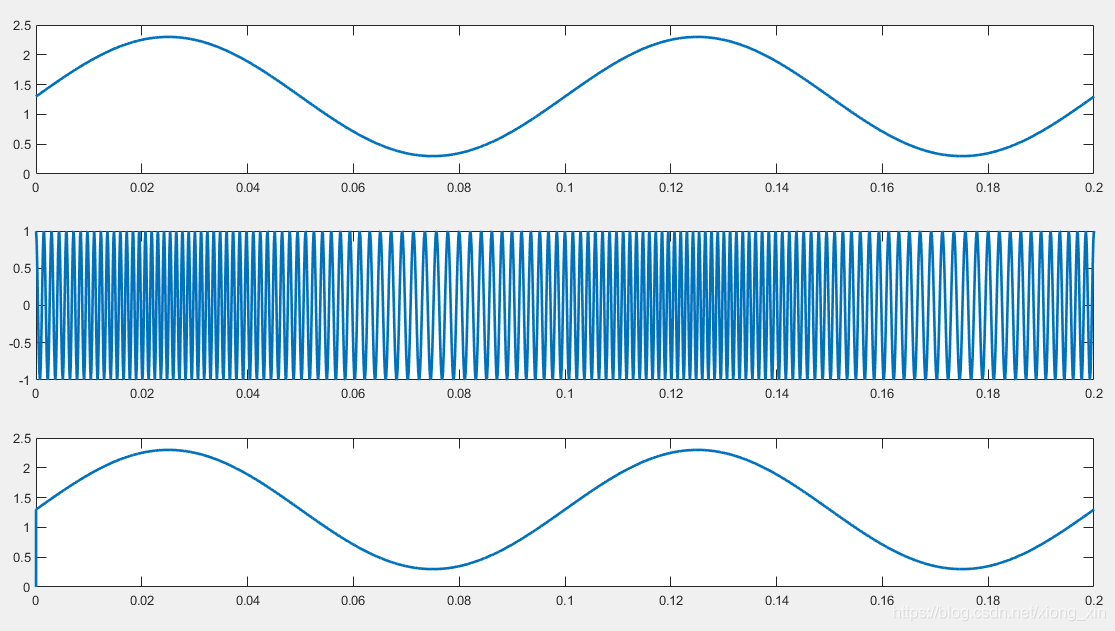
- 频率调制和解调
FMfmmodfmdemod
Fs = 44100;
Fc = 400;
dt = 1.0/Fs;
T = 1;
N = T/dt;
t = linspace(0,T,N);
x1 = sin(2*pi*10*t)+1.3;
subplot(311)
plot(t,x1,'linewidth',2)
xlim([0 0.2])
y1 = fmmod(x1,Fc,Fs,200);
subplot(312)
plot(t,y1,'linewidth',2)
xlim([0,0.2])
y2 = fmdemod(y1,Fc,Fs,200);
subplot(313)
plot(t,y2,'linewidth',2)
xlim([0,0.2])
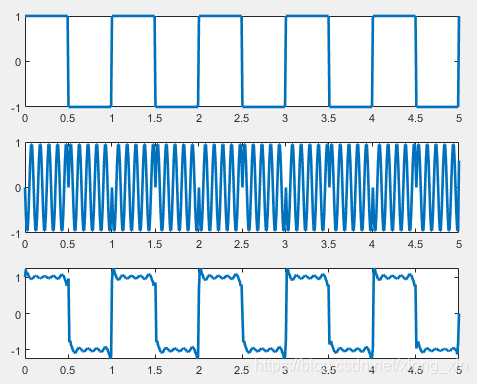
- 相位调制和解调
PMpmmodpmdemod
Fs = 100;
Fc = 10;
dt = 1.0/Fs;
T = 5;
N = T/dt;
dev = 3.14/2;
t = linspace(0,T,N);
x1 = square(2*pi*1*t);
subplot(311)
plot(t,x1,'linewidth',2)
y1 = pmmod(x1,Fc,Fs,dev);
subplot(312)
plot(t,y1,'linewidth',2)
y2 = pmdemod(y1,Fc,Fs,dev);
subplot(313)
plot(t,y2,'linewidth',2)
- 希尔伯特变换进行包络检波
hilbert()
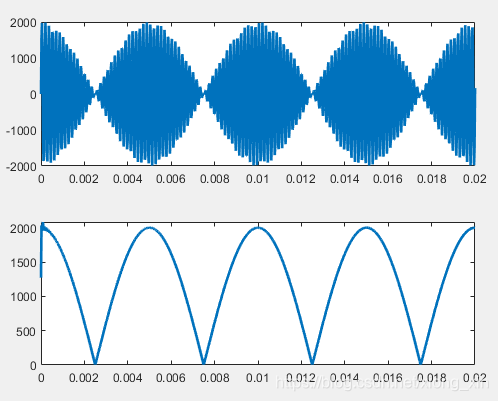
Fs = 44100;
dt = 1.0/Fs;
T = 1;
N = T/dt;
t = linspace(0,T,N);
x = 1000*sin(2*pi*6000*t)+1000*sin(2*pi*6200*t);
subplot(211)
plot(t,x,'linewidth',2)
xlim([0,0.02])
subplot(212)
y = hilbert(x);
plot(t,abs(y),'linewidth',2)
xlim([0,0.02])


 被折叠的 条评论
为什么被折叠?
被折叠的 条评论
为什么被折叠?
 到【灌水乐园】发言


