


一、ELK日志分析系统
- ELK有三部分组成
E:Elasticsearch
L:Logstash
K:Kibana
1、日志服务器
- 优点
提高安全性
集中化管理 - 缺点
对日志分析困难
2、日志处理步骤
1、将日志进行集中化管理
2、将日志格式化(Logstash)并输出到Elasticsearch
3、对格式化后的数据进行索引和存储(Elasticsearch)
4、前端数据的展示(Kibana)
二、Elasticsearch概述
- 提供了一个分布式多用户能力的全文搜索引擎
1、Elasticsearch特性
- 接近实时
- 集群
- 节点
- 索引
索引(库)→类型(表)→文档(记录) - 分片和副本
实际情况下,索引存储的数据可能超过单个节点的硬件限制,如一个10亿文档需1TB空间可能不适合存储在单个节点的磁盘上,或者从单个节点搜索请求太慢了,为了解决这个问题,elasticsearch提供将索引分成多个分片的功能,当在创建索引时,可以定义想要分片的数量。每个分片就是一个全功能的独立索引,可以位于集群中任何节点上。
分片:
1、水平分割扩展,增大存储量
2、分布式并行跨分片操作,提供性能和吞吐量
分布式分片的机制和搜索请求的文档如何汇总完全是有elasticsearch控制的,这些对用户而言是透明的
网络问题等等其他问题可以在任何时候不期而至,为了健壮性,强烈建议要有个故障切换机制,无论何种故障以防止分片或者节点不可用,为此,elasticsearch让我们将索引分片复制一份或多份,称为分片副本或副本
副本:
1、高可用性,以应对分片或者节点故障,出于这个原因,分片副本要在不同的节点上
2、性能加强,增加吞吐量,搜索可以并行在所有副本上执行
三、LogStash概述
- 一款强大的数据处理工具
- 可实现数据传输、格式处理、格式化输出
- 数据输入、数据加工(如过滤,改写等)以及数据输出
由三个组件组成:Input、Output、Filter Plugin
- Input:获取日志
- Output:输出日志
- Filter Plugin:过滤日志、格式处理
1、LogStash主要组件
- Shipper
- Indexer
- Broker
- Search and Storage
- Web Interface
四、Kibana概述
- 一个针对Elasticsearch的开源分析及可视化平台
- 搜索、查看存储在Elasticsearch索引中的数据
- 通过各种图表进行高级数据分析及展示
1、Kibana主要功能
- Elasticsearch无缝之集成
- 整合数据,复杂数据分析
- 让更多团队成员收益
- 接口灵活,分享更容易
- 配置简单、可视化多数据源
- 简单数据导出
五、部署ELK日志分析系统
1、实验需求
1、配置ELK日志分析集群
2、使用Logstash收集日志
3、使用Kibana查看分析日志
2、环境配置
| 主机 | 操作系统 | IP地址 | 安装包 / 软件 / 工具 |
|---|---|---|---|
| node1 | CentOS7 | 192.168.184.10 | Elasticsearch |
| node2 | CentOS7 | 192.168.184.20 | Elasticsearch |
| apache | CentOS7 | 192.168.184.30 | httpd / Logstash |
| 真机 | Windows | 192.168.184.1 | —— |
所有节点,关闭系统防火墙和安全机制
systemctl stop firewalld.service
setenforce 0
- 1
- 2

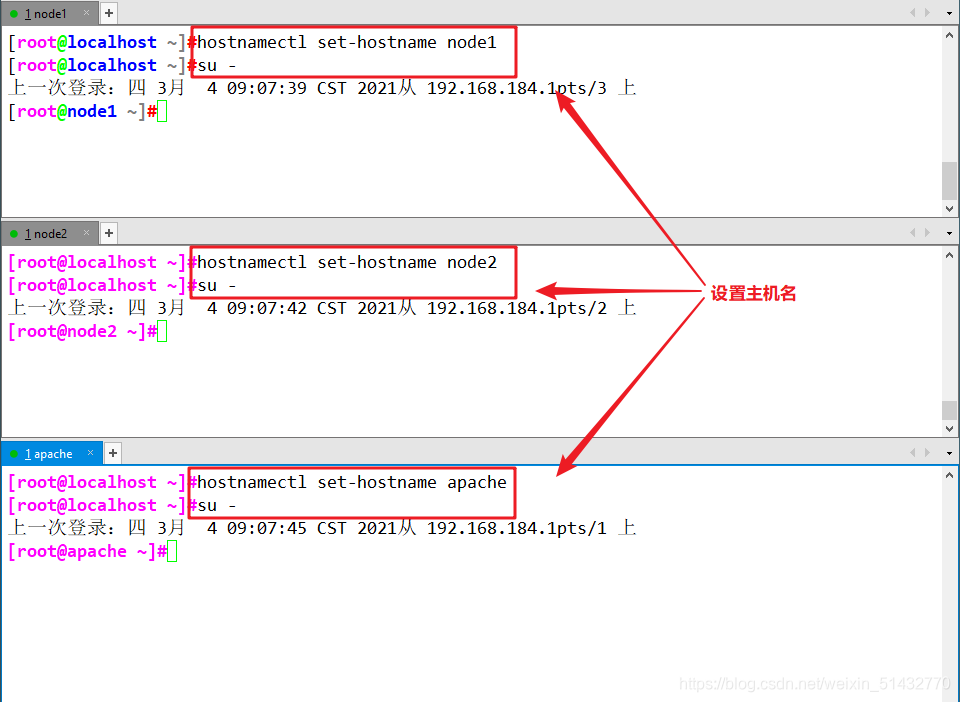
node1(192.168.184.10)
hostnamectl set-hostname node1
su -
- 1
- 2
node2(192.168.184.20)
hostnamectl set-hostname node2
su -
- 1
- 2
apache(192.168.184.30)
hostnamectl set-hostname apache
su -
- 1
- 2
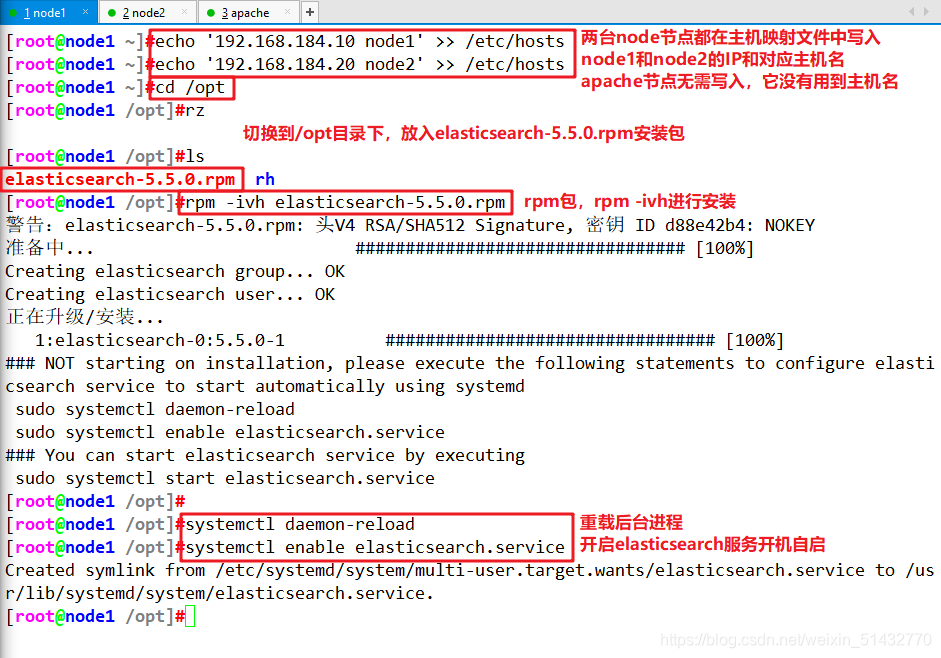
3、配置elasticsearch环境(node1、node2)
node1(192.168.184.10)
node2(192.168.184.20)
仅一处主机名不同,已标注
echo '192.168.184.10 node1' >> /etc/hosts
echo '192.168.184.20 node2' >> /etc/hosts
cd /opt
rz elasticsearch-5.5.0.rpm
rpm -ivh elasticsearch-5.5.0.rpm
systemctl daemon-reload
systemctl enable elasticsearch.service
- 1
- 2
- 3
- 4
- 5
- 6
- 7
- 8
- 9
- 10
- 11
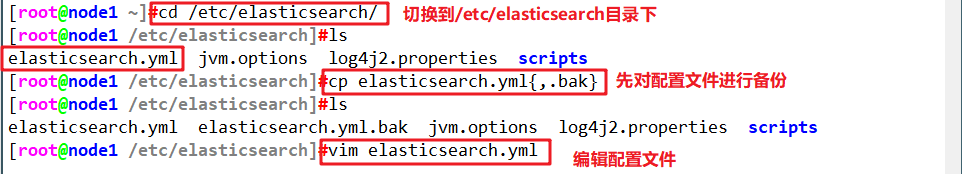
cp /etc/elasticsearch/elasticsearch.yml /etc/elasticsearch/elasticsearch.yml.bak
vim /etc/elasticsearch/elasticsearch.yml
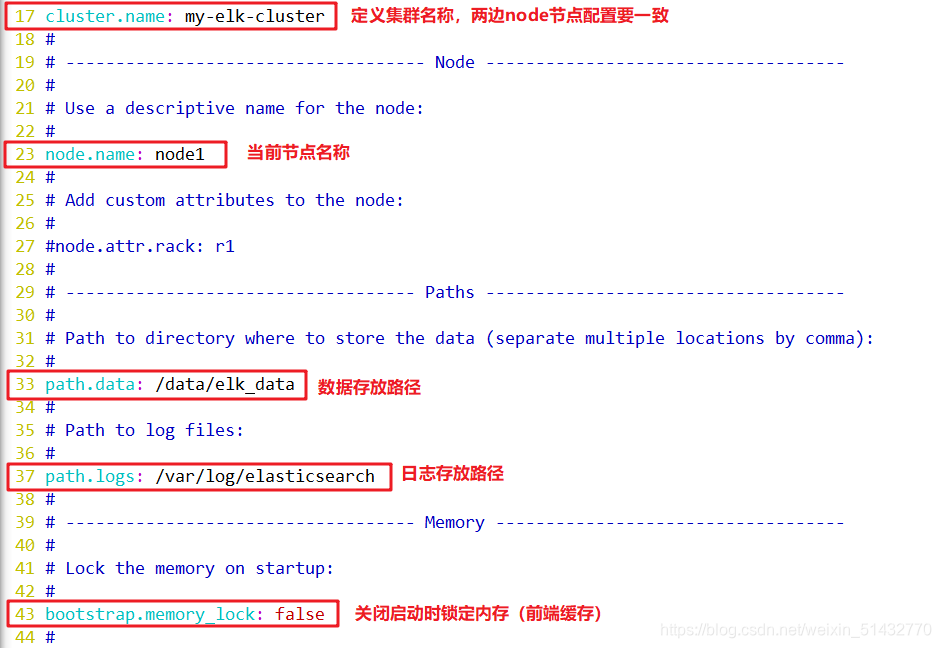
17
cluster.name: my-elk-cluster
23
node.name: node1 #这里node2节点设置为node2
33
path.data: /data/elk_data
37
path.logs: /var/log/elasticsearch/
43
bootstrap.memory_lock: false
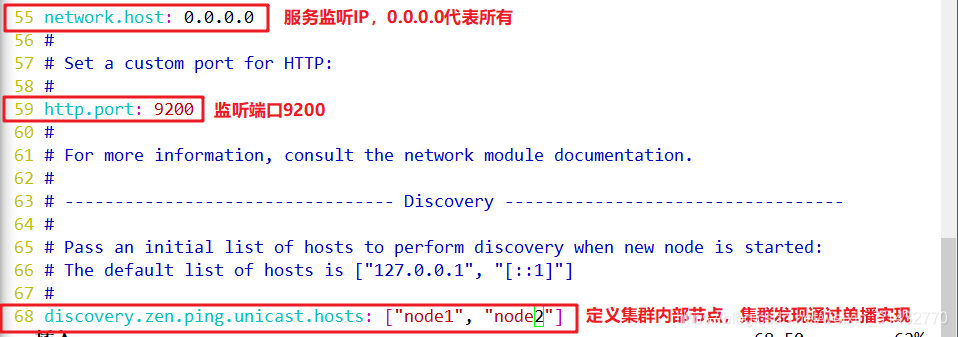
55
network.host: 0.0.0.0
59
http.port: 9200
68
discovery.zen.ping.unicast.hosts: [“node1”, “node2”]
- 1
- 2
- 3
- 4
- 5
- 6
- 7
- 8
- 9
- 10
- 11
- 12
- 13
- 14
- 15
- 16
- 17
- 18
- 19
- 20
- 21
- 22
- 23
- 24
- 25
- 26
- 27
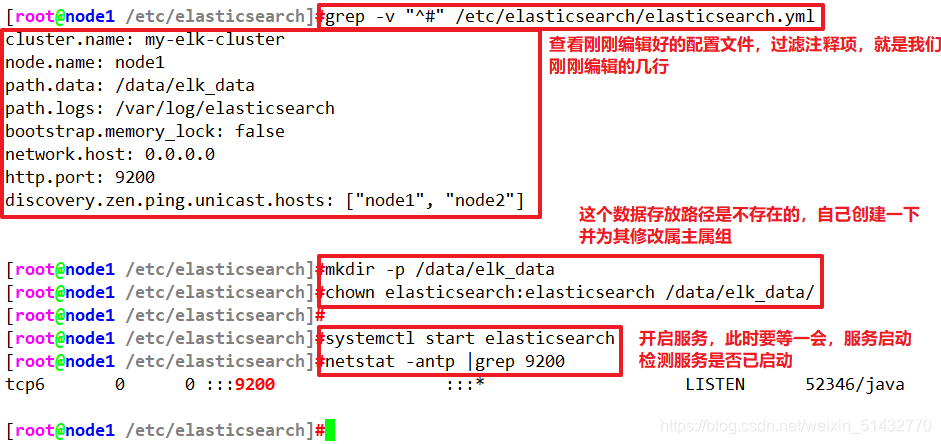
grep -v "^#" /etc/elasticsearch/elasticsearch.yml
mkdir -p /data/elk_data
chown elasticsearch:elasticsearch /data/elk_data/
systemctl start elasticsearch
netstat -antp |grep 9200
- 1
- 2
- 3
- 4
- 5
- 6
- 7
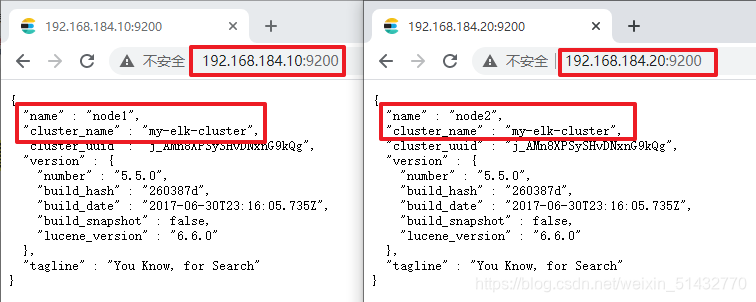
1、此时可真机访问,查看节点信息
http://192.168.184.10:9200
http://192.168.184.20:9200
- 1
- 2
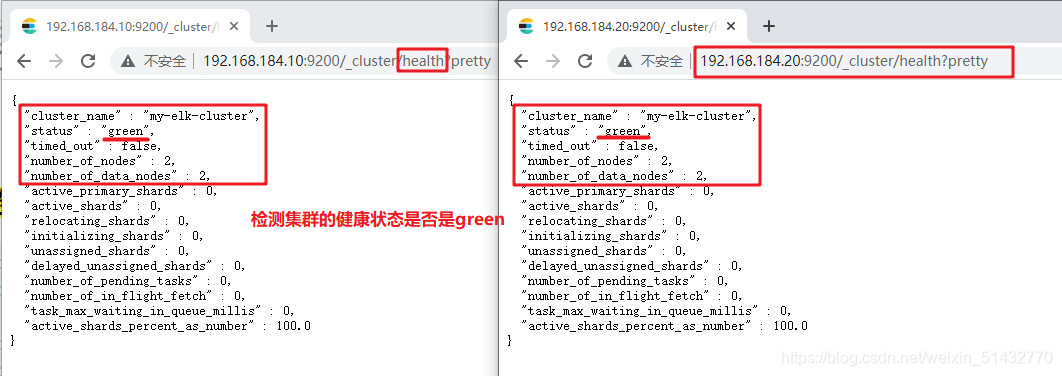
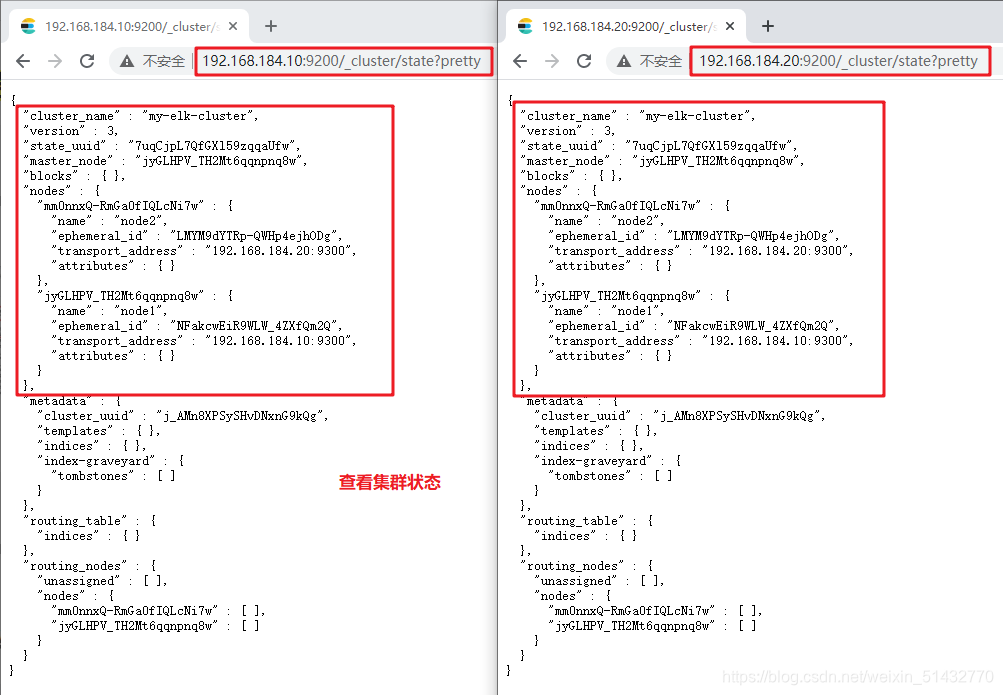
2、真机检测集群健康、查看集群状态
http://192.168.184.10:9200/_cluster/health?pretty
http://192.168.184.20:9200/_cluster/health?pretty
- 1
- 2
http://192.168.184.10:9200/_cluster/state?pretty
http://192.168.184.10:9200/_cluster/state?pretty
- 1
- 2
4、 安装elasticsearch-head插件
上述查看集群的方式,及其不方便,我们可以通过安装elasticsearch-head插件后,来管理集群
node1(192.168.184.10)
node2(192.168.184.20)
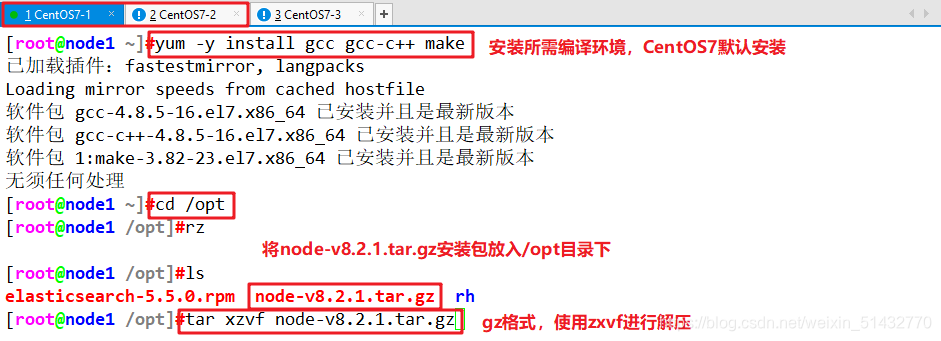
yum -y install gcc gcc-c++ make
cd /opt
rz node-v8.2.1.tar.gz
tar xzvf node-v8.2.1.tar.gz
cd node-v8.2.1/
./configure
make
make install
- 1
- 2
- 3
- 4
- 5
- 6
- 7
- 8
- 9


cd /usr/local/src
rz phantomjs-2.1.1-linux-x86_64.tar.bz2
tar xjvf phantomjs-2.1.1-linux-x86_64.tar.bz2
cd phantomjs-2.1.1-linux-x86_64/bin
cp phantomjs /usr/local/bin
cd /usr/local/src/
rz elasticsearch-head.tar.gz
tar xzvf elasticsearch-head.tar.gz
- 1
- 2
- 3
- 4
- 5
- 6
- 7
- 8
- 9
- 10
- 11
- 12
- 13


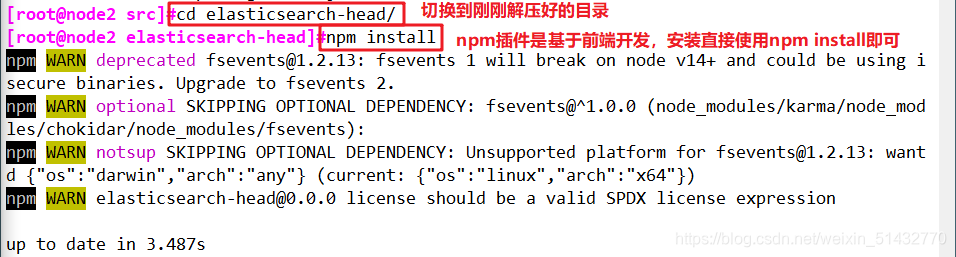
cd elasticsearch-head/
npm install
vim /etc/elasticsearch/elasticsearch.yml
末行插入
http.cors.enabled: true
http.cors.allow-origin: “*”
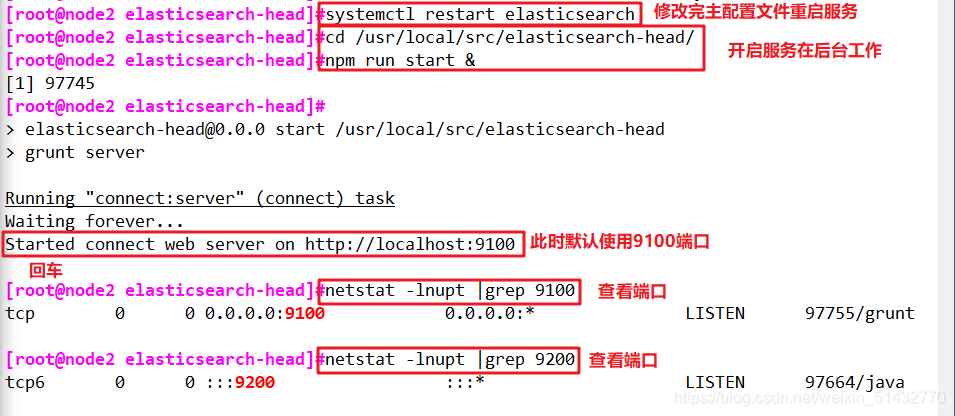
systemctl restart elasticsearch
cd /usr/local/src/elasticsearch-head/
npm run start &
netstat -lnupt |grep 9100
netstat -lnupt |grep 9200
- 1
- 2
- 3
- 4
- 5
- 6
- 7
- 8
- 9
- 10
- 11
- 12
- 13
- 14
- 15


真机上打开浏览器输入
http://192.168.184.10:9100
http://192.168.184.20:9100
- 1
- 2
可以看见群集很健康是绿色
在Elasticsearch 后面的栏目中输入
http://192.168.184.10:9200
http://192.168.184.20:9200
- 1
- 2
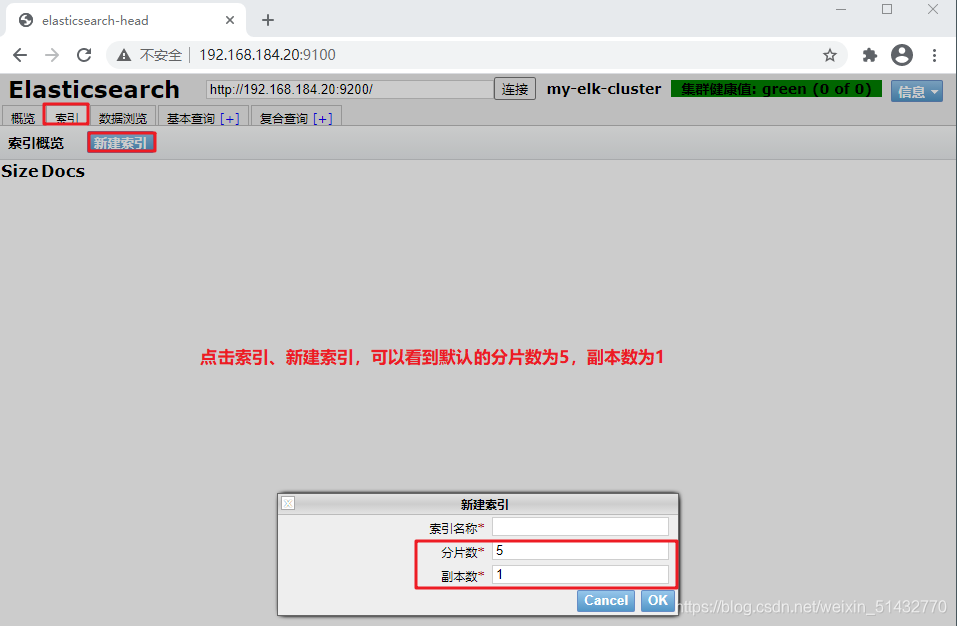
然后点连接 会发现:集群健康值: green (0 of 0)
●node1信息动作
★node2信息动作

node1(192.168.184.10)
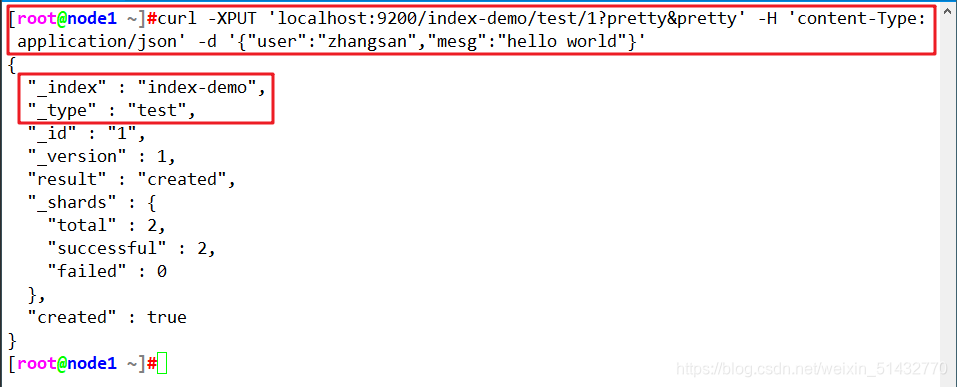
索引为index-demo,类型为test,可以看到成功创建
curl -XPUT 'localhost:9200/index-demo/test/1?pretty&pretty' -H 'content-Type: application/json' -d '{"user":"zhangsan","mesg":"hello world"}'
- 1
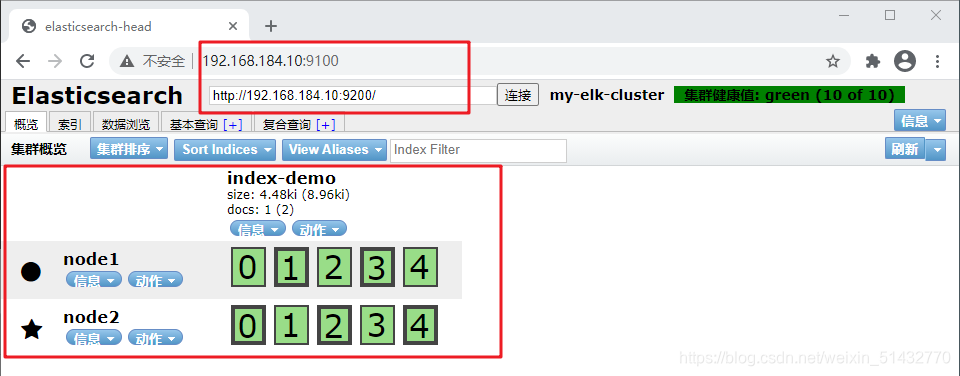
真机访问,查看索引信息
http://192.168.184.10:9100
- 1
上面图可以看见索引默认被分片5个,并且有一个副本
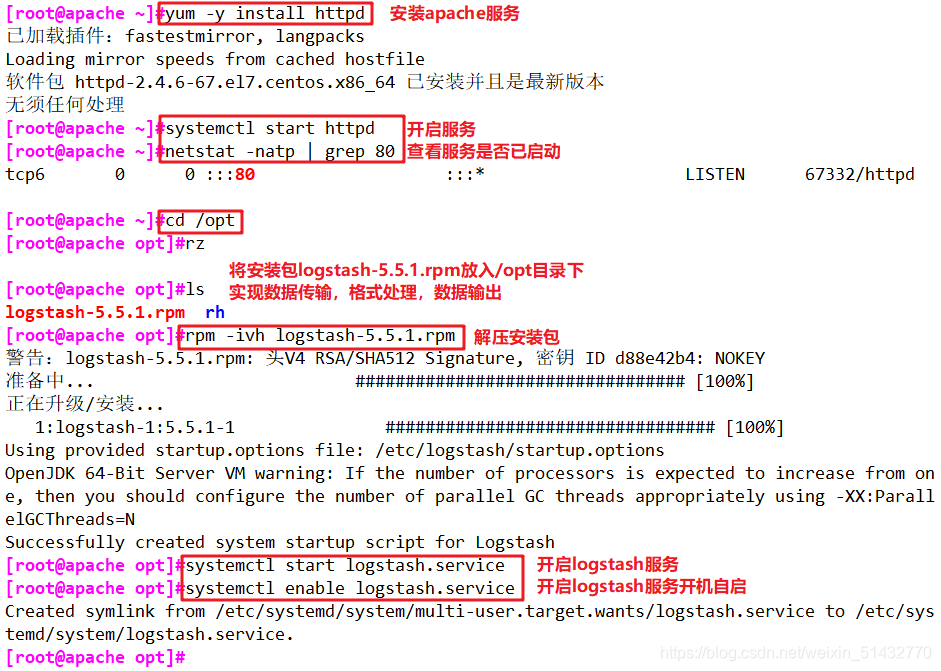
5、安装logstash
安装logstash并做一些日志搜集输出到elasticsearch中
apache(192.168.184.30)
yum -y install httpd
systemctl start httpd
cd /opt
rz logstash-5.5.1.rpm
rpm -ivh logstash-5.5.1.rpm
systemctl start logstash.service
systemctl enable logstash.service
- 1
- 2
- 3
- 4
- 5
- 6
- 7
- 8
- 9
- 10
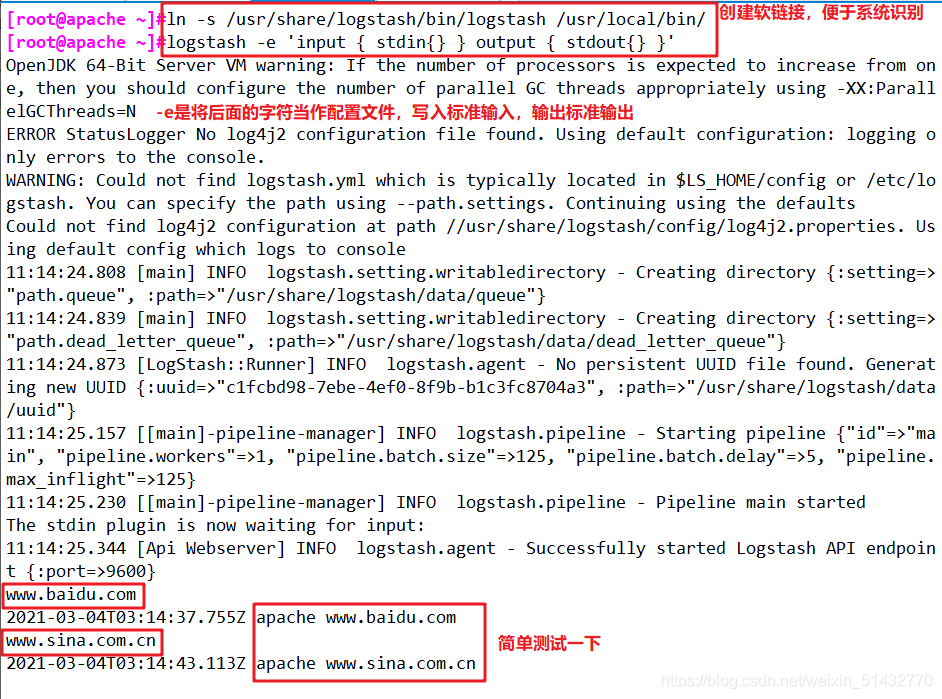
ln -s /usr/share/logstash/bin/logstash /usr/local/bin/
logstash -e ‘input { stdin{} } output { stdout{} }’
Logstash API endpoint {:port=>9600}
www.baidu.com ####需要输入www.baidu.com
2018-10-12T02:10:11.313Z apache www.baidu.com
www.sina.com.cn ####需要输入www.sina.com.cn
2018-10-12T02:10:29.778Z apache www.sina.com.cn
Ctrl + c
- 1
- 2
- 3
- 4
- 5
- 6
- 7
- 8
- 9
- 10
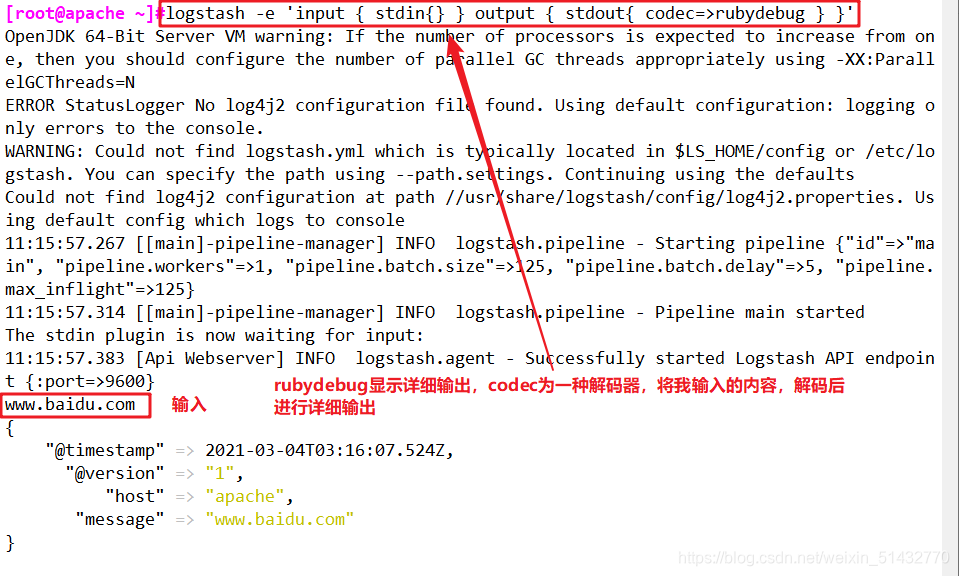
logstash -e 'input { stdin{} } output { stdout{ codec=>rubydebug } }'
Logstash API endpoint {:port=>9600}
www.baidu.com
{
“@timestamp” => 2018-10-12T02:15:39.136Z,
“@version” => “1”,
“host” => “apache”,
“message” => “www.baidu.com”
}
Ctrl + c
- 1
- 2
- 3
- 4
- 5
- 6
- 7
- 8
- 9
- 10
- 11
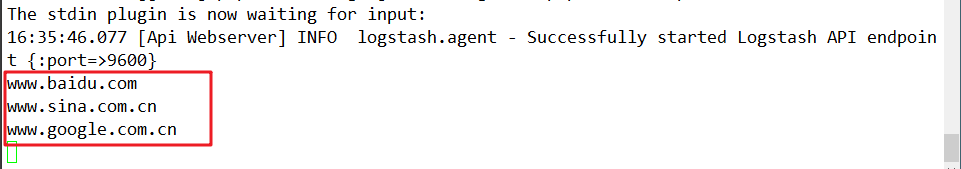
1、使用logstash将信息写入elasticsearch中,输入 输出 对接
[root@apache opt]# logstash -e 'input { stdin{} } output { elasticsearch { hosts=>["192.168.184.10:9200"] } }'
Logstash API endpoint {:port=>9600}
www.baidu.com ###输入内容
www.sina.com.cn ###输入内容
www.google.com.cn ###输入内容
Ctrl c
- 1
- 2
- 3
- 4
- 5
- 6
- 7

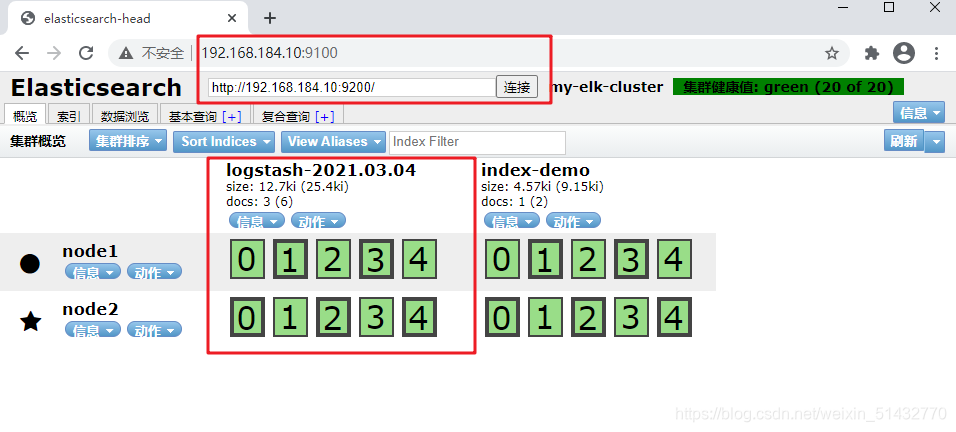
真机访问,查看索引信息
打开浏览器 输入http://192.168.184.10:9100/ 查看索引信息
多出 logstash-21.03.04
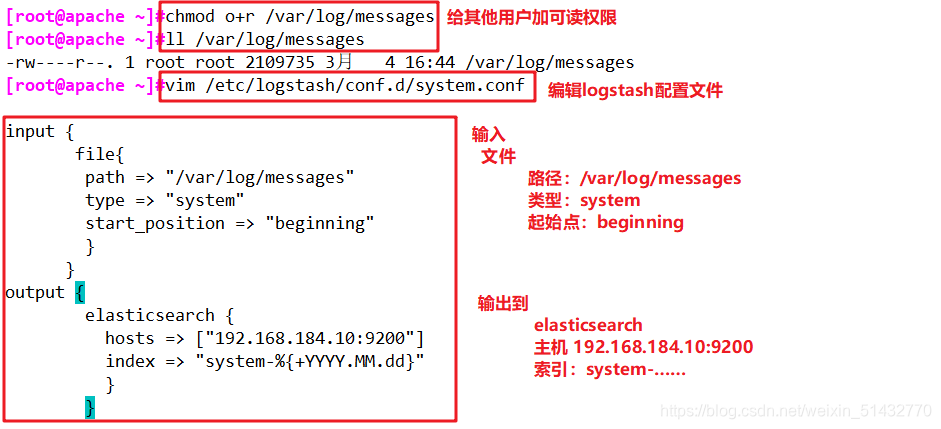
2、apache(192.168.184.30)做对接配置
chmod o+r /var/log/messages
ll /var/log/messages
vim /etc/logstash/conf.d/system.conf
input {
file{
path => “/var/log/messages”
type => “system”
start_position => “beginning”
}
}
output {
elasticsearch {
hosts => [“192.168.184.10:9200”]
index => “system-%{+YYYY.MM.dd}”
}
}
- 1
- 2
- 3
- 4
- 5
- 6
- 7
- 8
- 9
- 10
- 11
- 12
- 13
- 14
- 15
- 16
- 17
systemctl restart logstash.service
- 1

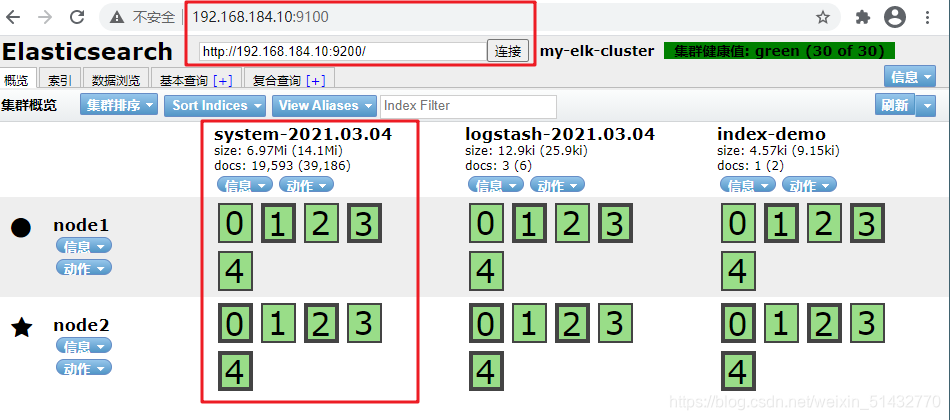
真机
打开浏览器 输入http://192.168.184.10:9100/ 查看索引信息###
多出 system-2021.03.04
6、在node1主机安装kibana
cd /usr/local/src/
rz kibana-5.5.1-x86_64.rpm
rpm -ivh kibana-5.5.1-x86_64.rpm
cd /etc/kibana/
cp kibana.yml kibana.yml.bak
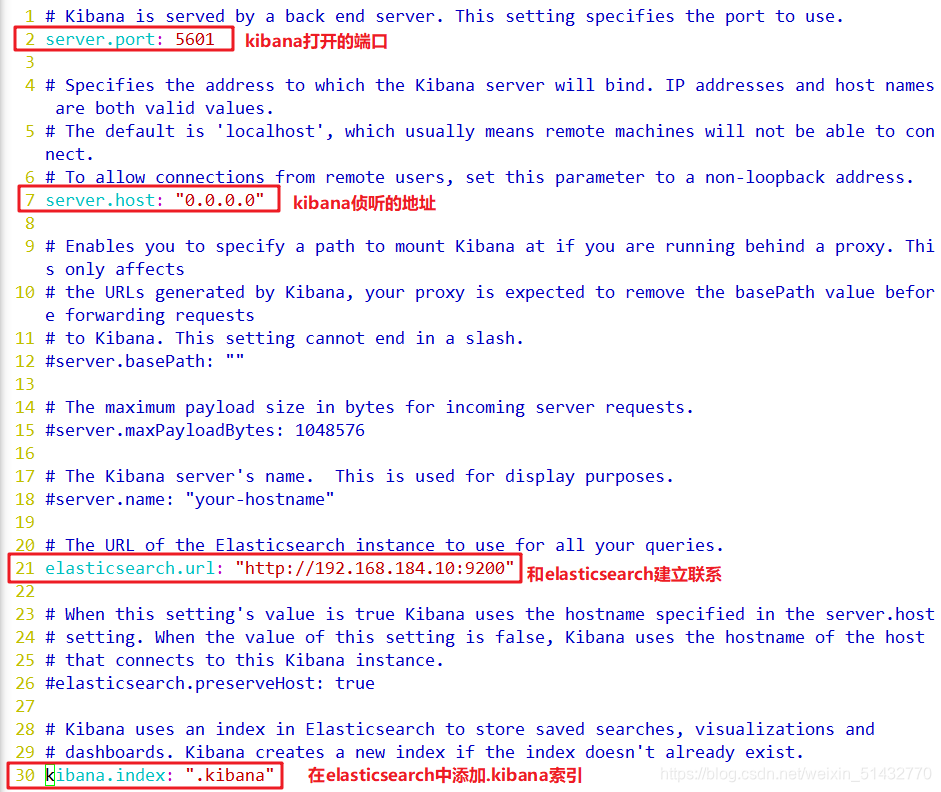
vim kibana.yml
2/ server.port: 5601 #kibana打开的端口
7/ server.host: “0.0.0.0” #kibana侦听的地址
21/ elasticsearch.url: “http://192.168.184.10:9200” #和elasticsearch建立联系
30/ kibana.index: “.kibana” #在elasticsearch中添加.kibana索引
systemctl start kibana.service
systemctl enable kibana.service
- 1
- 2
- 3
- 4
- 5
- 6
- 7
- 8
- 9
- 10
- 11
- 12
- 13
- 14
- 15
- 16


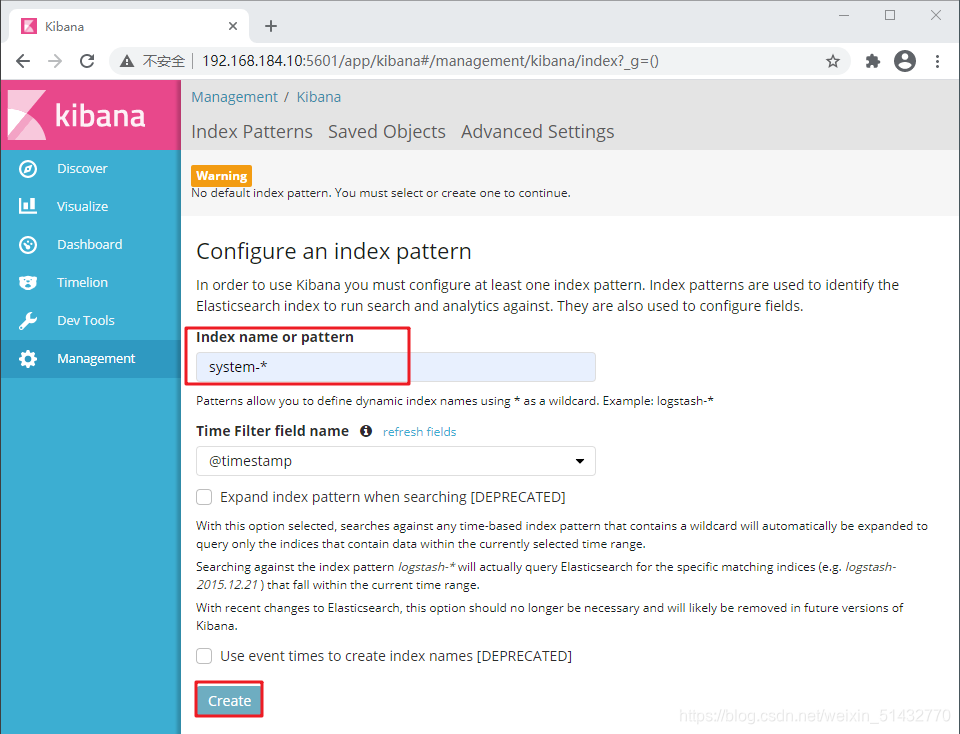
真机访问
192.168.184.10:5601
- 1
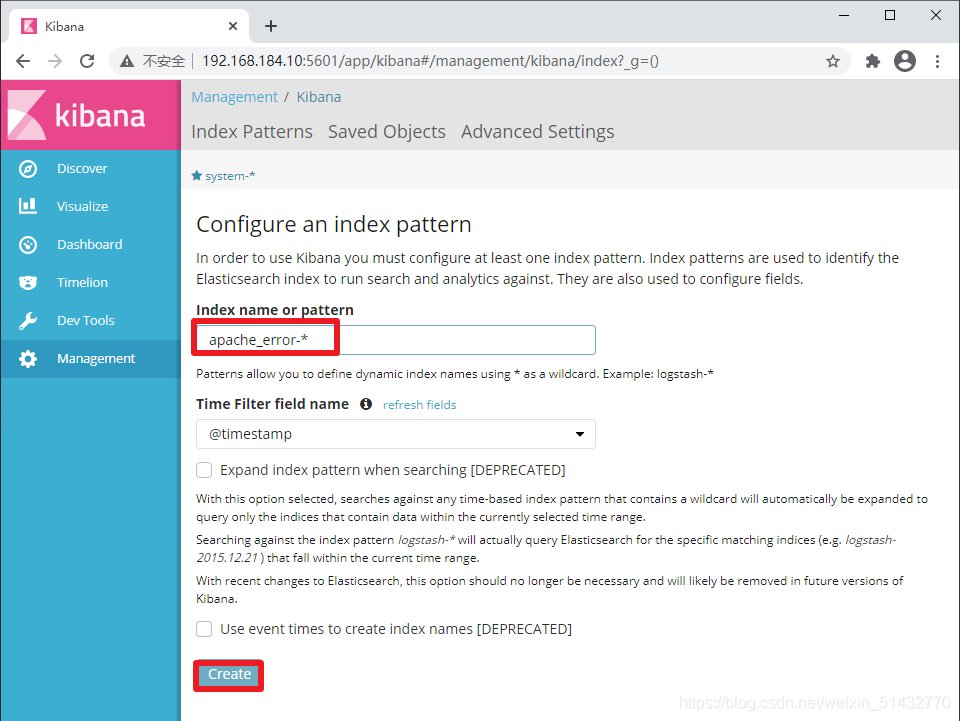
首次登录创建一个索引 名字:system-* ##这是对接系统日志文件
Index name or pattern ###下面输入system-*
然后点最下面的出面的create 按钮创建
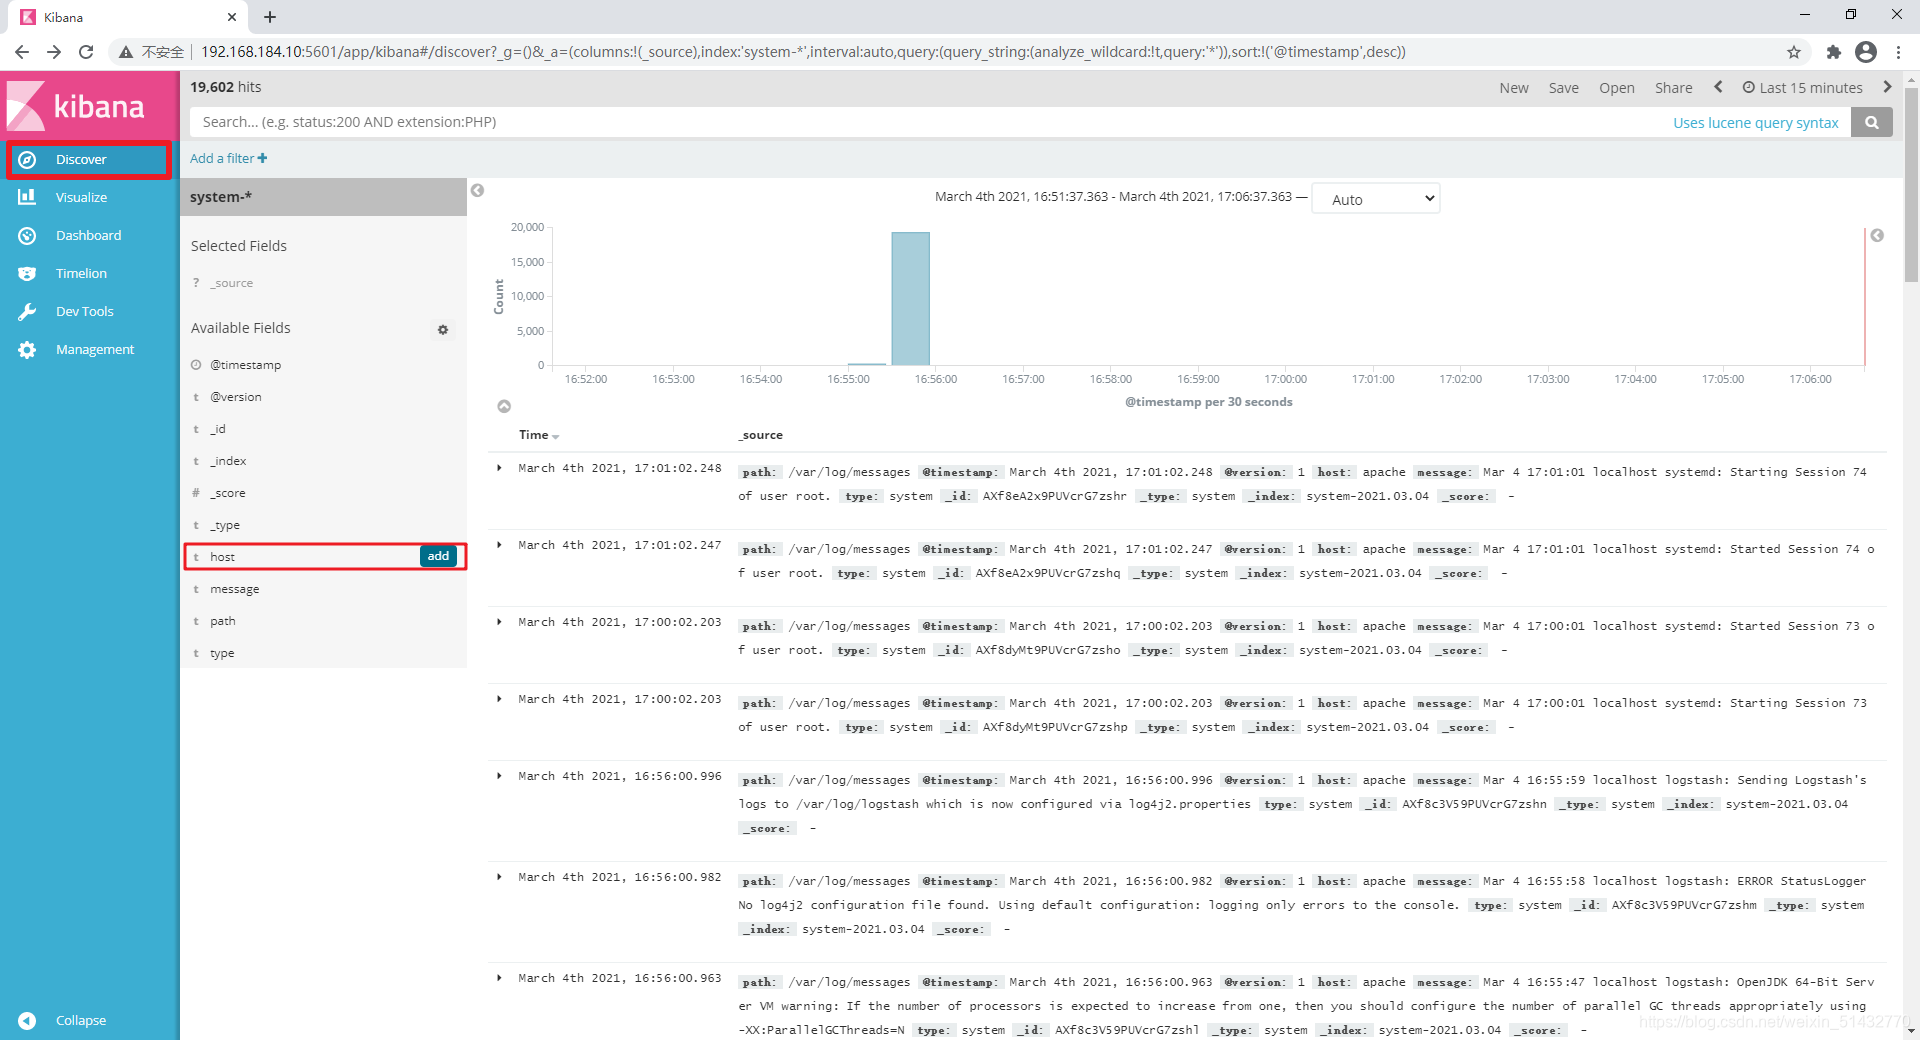
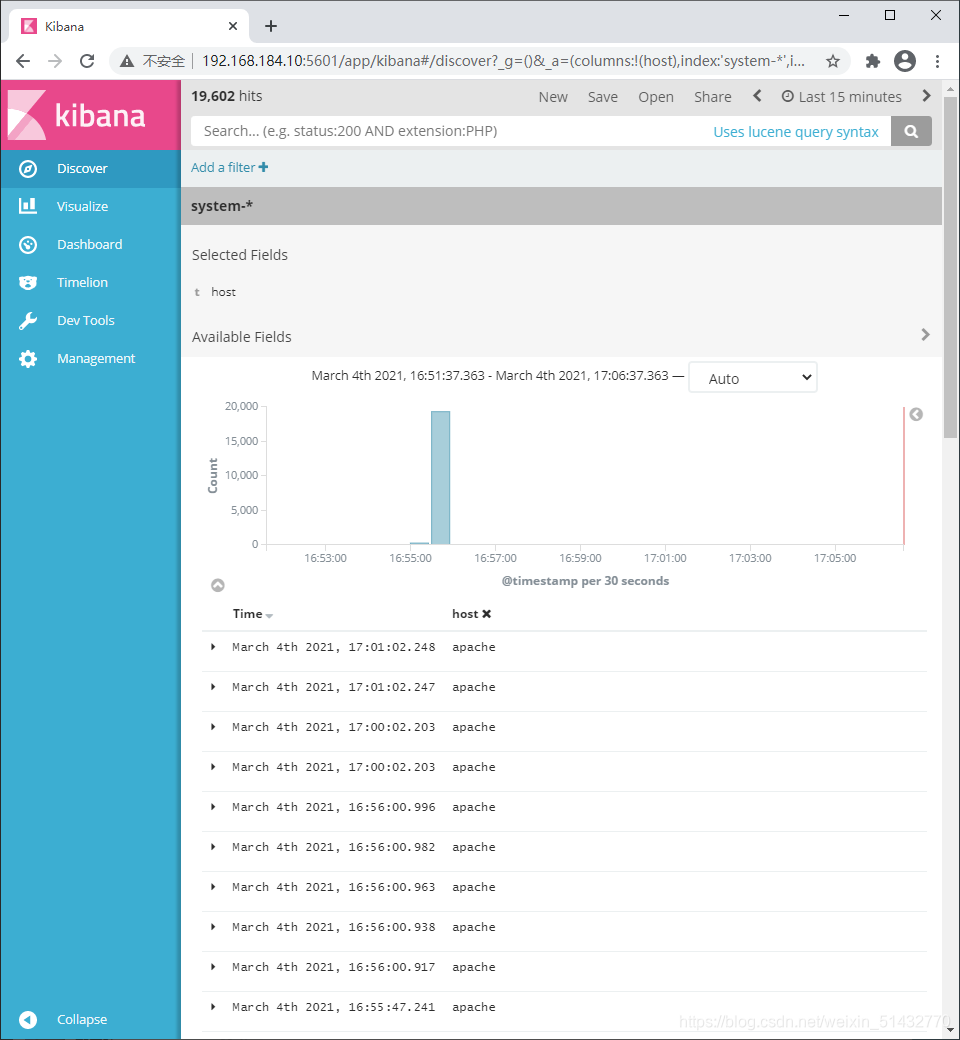
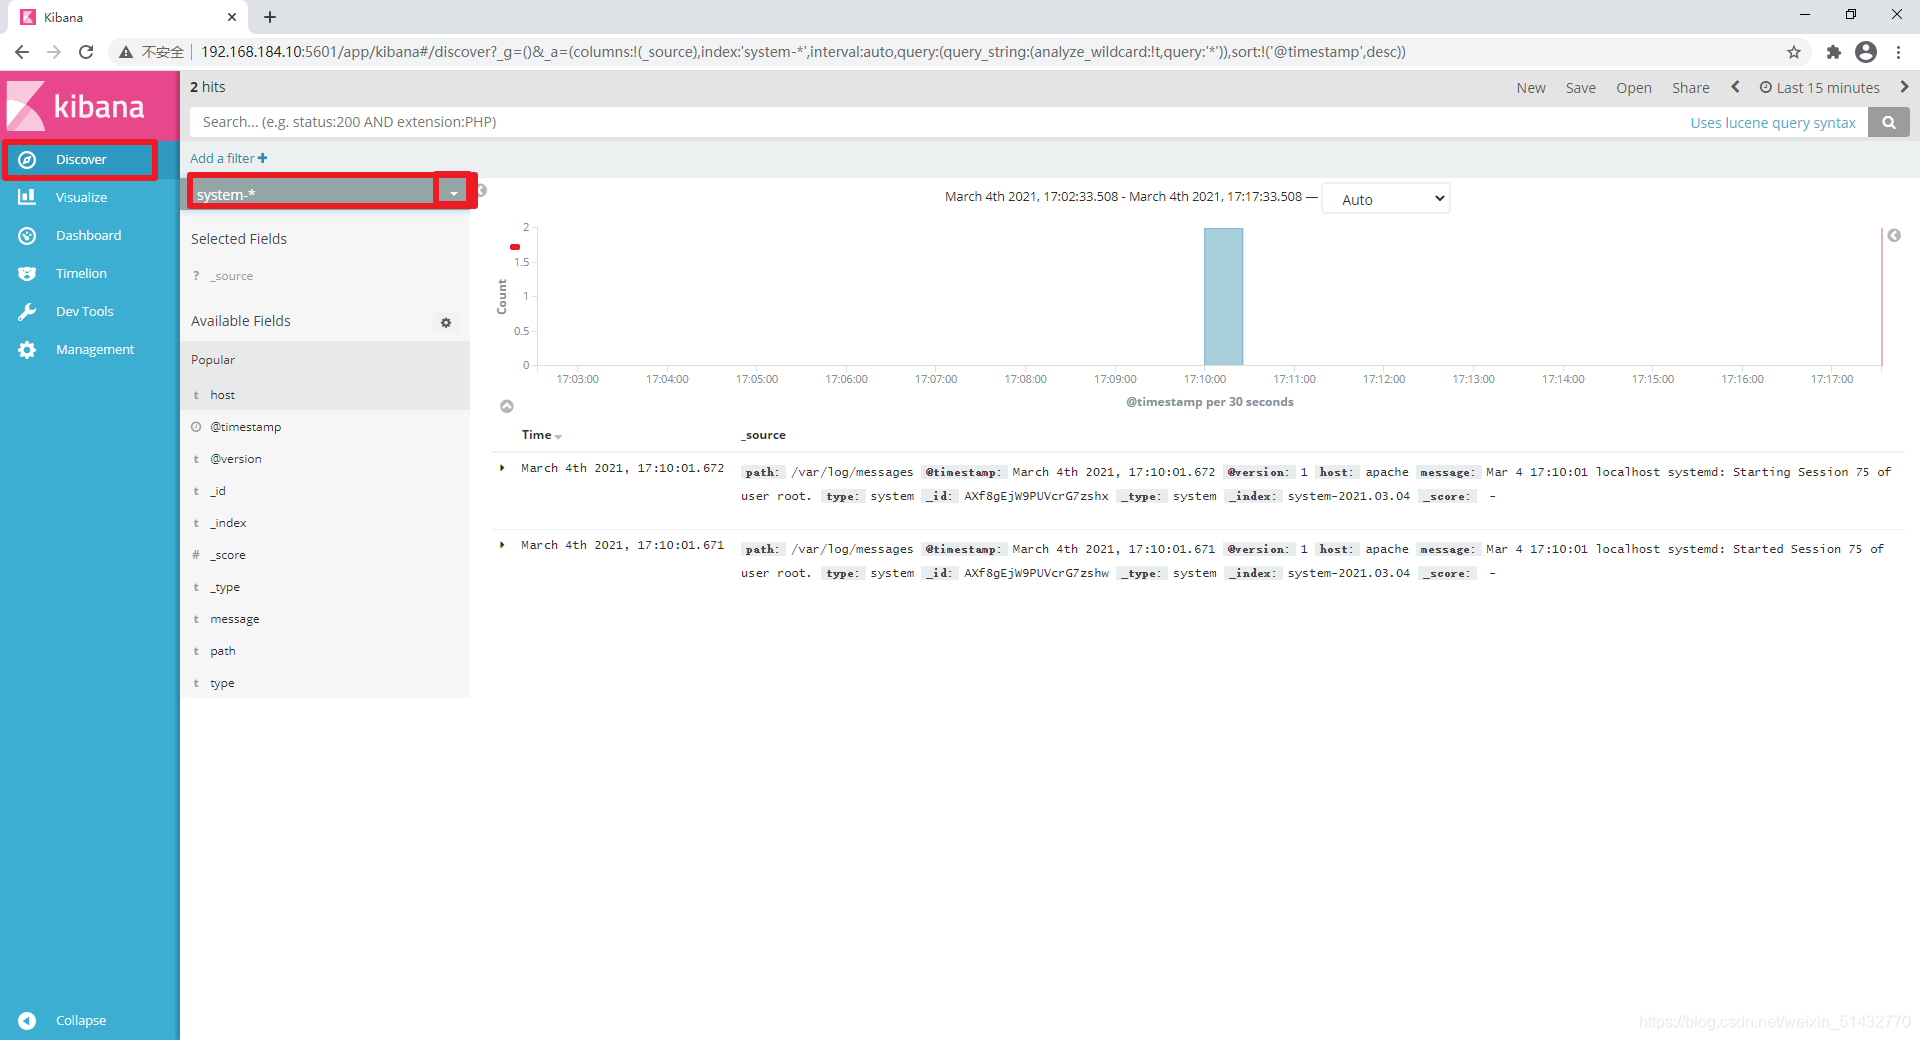
然后点最左上角的Discover按钮 会发现system-*信息
然后点下面的host旁边的add 会发现右面的图只有 Time 和host 选项了 这个比较友好
7、对接apache日志文件(访问、错误)
cd /etc/logstash/conf.d/
vim apache_log.conf
input {
file{
path => “/etc/httpd/logs/access_log”
type => “access”
start_position => “beginning”
}
file{
path => “/etc/httpd/logs/error_log”
type => “error”
start_position => “beginning”
}
}
output {
if [type] == “access” {
elasticsearch {
hosts => [“192.168.184.10:9200”]
index => “apache_access-%{+YYYY.MM.dd}”
}
}
if [type] == “error” {
elasticsearch {
hosts => [“192.168.184.10:9200”]
index => “apache_error-%{+YYYY.MM.dd}”
}
}
}
/usr/share/logstash/bin/logstash -f apache_log.conf
- 1
- 2
- 3
- 4
- 5
- 6
- 7
- 8
- 9
- 10
- 11
- 12
- 13
- 14
- 15
- 16
- 17
- 18
- 19
- 20
- 21
- 22
- 23
- 24
- 25
- 26
- 27
- 28
- 29
- 30
- 31
- 32
真机
打开输入http://192.168.184.30
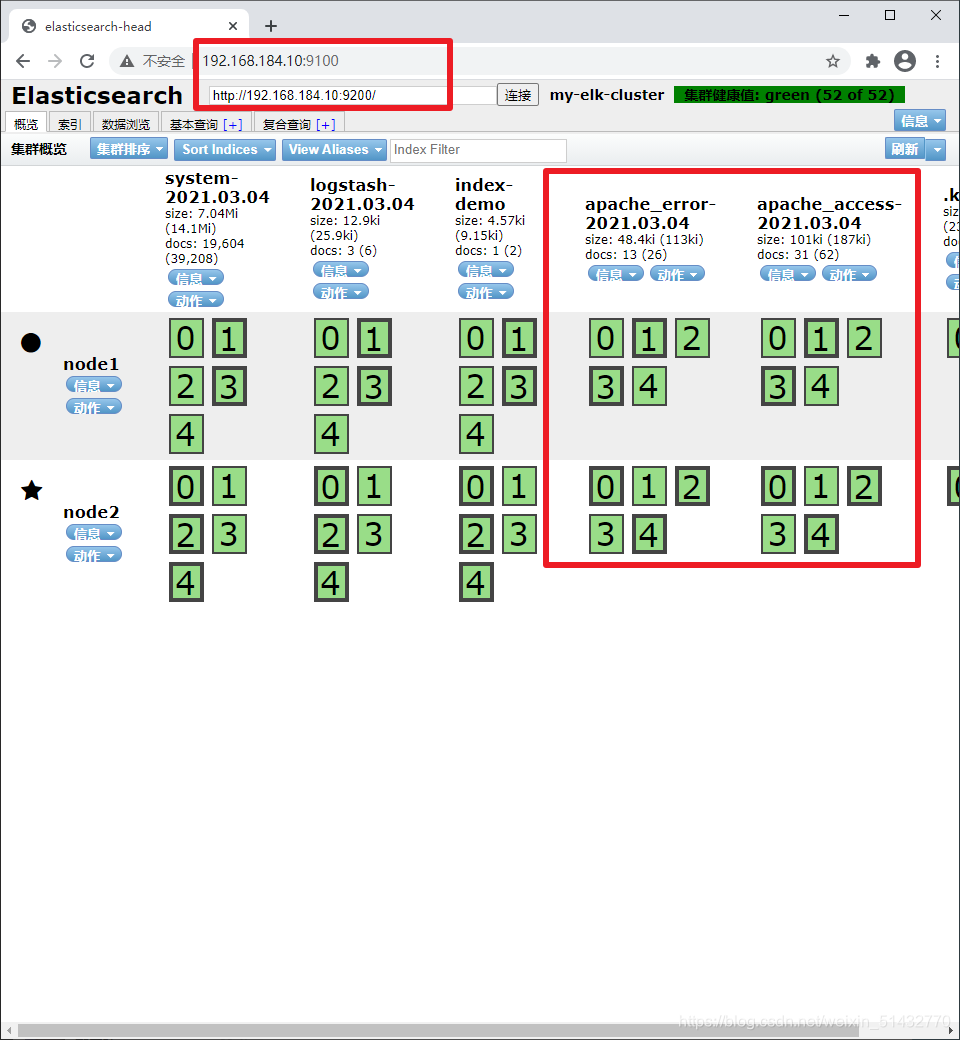
打开浏览器 输入http://192.168.184.10:9100/ 查看索引信息
能发现
apache_error-2021.03.04 apache_access-2021.03.04
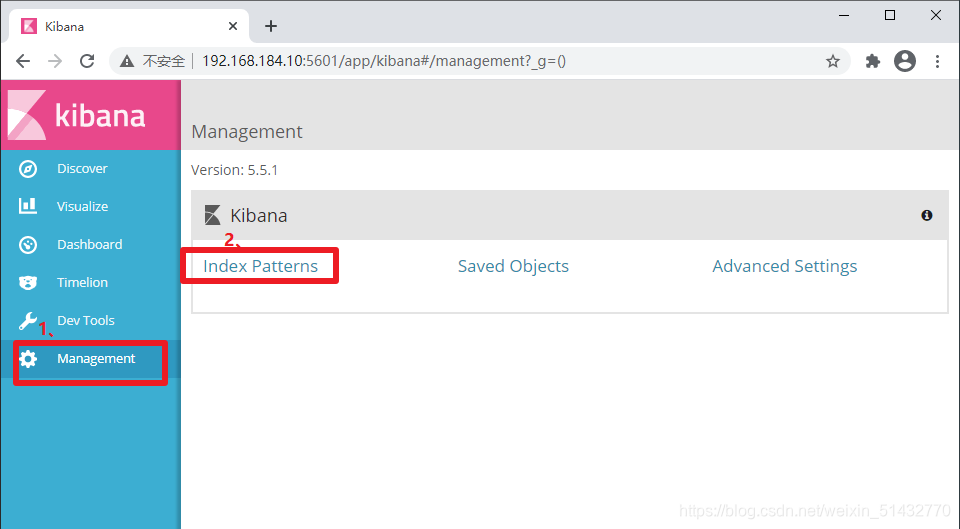
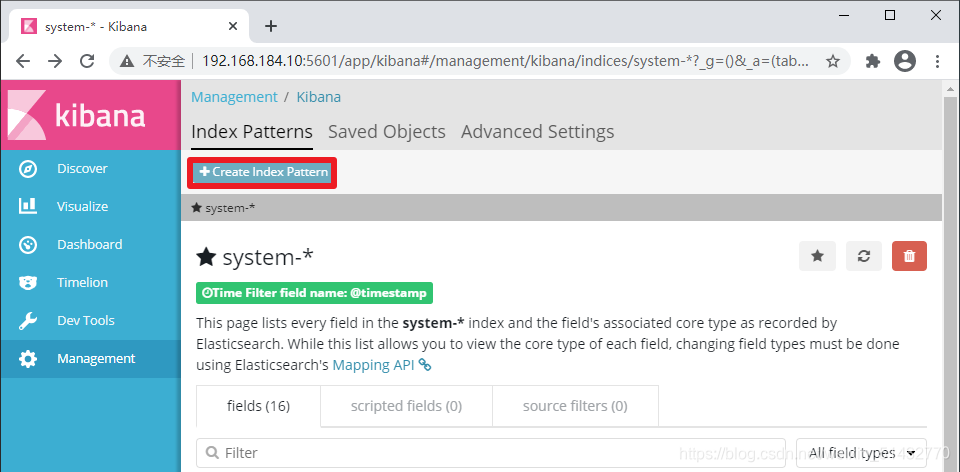
打开浏览器 输入http://192.168.184.10:5601
点击左下角有个management选项—index patterns—create index pattern
----分别创建apache_error-* 和 apache_access-* 的索引


 855
855


 被折叠的 条评论
为什么被折叠?
被折叠的 条评论
为什么被折叠?
 到【灌水乐园】发言


