


在使用gridpanel中,可以使用插件Ext.ux.grid.GroupSummary,实现分组统计,如图所示。
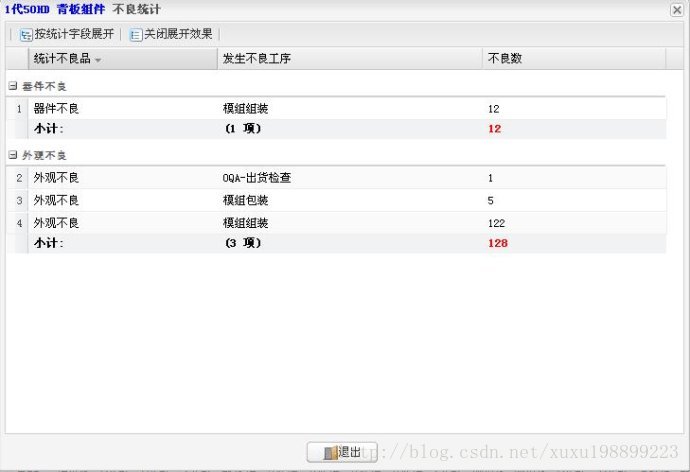
但通常情况下,我们也需要不进行分组统计,直接对数据进行合计显示,如下图:
这个时候,可以使用另外一个插件,Ext.ux.grid.GridSummary,使用方法与Ext.ux.grid.GroupSummary类似
,现举例如下:
<!DOCTYPE HTML PUBLIC "-//W3C//DTD HTML 4.01//EN" "http://www.w3.org/TR/html4/loose.dtd">
<html>
<head>
<title>Ext.ux.grid.GridSummary Plugin Example</title>

<title>Absolute Forms</title>
    <link rel="stylesheet" type="text/css" href="../../resources/css/ext-all.css"/>
<link rel="stylesheet" type="text/css" href="GroupSummary.css"/>


    <!-- GC -->
    <!-- LIBS -->
    <script type="text/javascript" src="../../adapter/ext/ext-base.js"></script>
    <!-- ENDLIBS -->

    <script type="text/javascript" src="../../ext-all.js"></script>
<script src='gridsummary.js'></script><!-- Ext.ux.grid.GridSummary plugin -->

<script>
Ext.util.Format.usMoney = function(v) { // override Ext.util.usMoney
    v = Ext.num(v, 0); // ensure v is a valid numeric value, otherwise use 0 as a base (fixes $NaN.00 appearing in summaryRow when no records exist)
    v = (Math.round((v - 0) * 100)) / 100;
    v = (v == Math.floor(v)) ? v + ".00" : ((v * 10 == Math.floor(v * 10)) ? v + "0" : v);
    v = String(v);

    var ps = v.split('.');
    var whole = ps[0];
    var sub = ps[1] ? '.'+ ps[1] : '.00';
    var r = /(\d+)(\d{3})/;

    while (r.test(whole)) {
            whole = whole.replace(r, '$1' + ',' + '$2');
    }

    v = whole + sub;

    if (v.charAt(0) == '-') {
        return '-$' + v.substr(1);
    }

    return "$" + v;
}

Ext.onReady(function() {
    Ext.QuickTips.init();

    var myData = [
        ['3m Co',71.72,0.02,0.03,'9/1 12:00am'],
        ['Alcoa Inc',29.01,0.42,1.47,'9/1 12:00am'],
        ['Altria Group Inc',83.81,0.28,0.34,'9/1 12:00am'],
        ['American Express Company',52.55,0.01,0.02,'9/1 12:00am'],
        ['American International Group, Inc.',64.13,0.31,0.49,'9/1 12:00am'],
        ['AT&T Inc.',31.61,-0.48,-1.54,'9/1 12:00am'],
        ['Boeing Co.',75.43,0.53,0.71,'9/1 12:00am'],
        ['Caterpillar Inc.',67.27,0.92,1.39,'9/1 12:00am'],
        ['Citigroup, Inc.',49.37,0.02,0.04,'9/1 12:00am'],
        ['E.I. du Pont de Nemours and Company',40.48,0.51,1.28,'9/1 12:00am'],
        ['Exxon Mobil Corp',68.1,-0.43,-0.64,'9/1 12:00am'],
        ['General Electric Company',34.14,-0.08,-0.23,'9/1 12:00am'],
        ['General Motors Corporation',30.27,1.09,3.74,'9/1 12:00am'],
        ['Hewlett-Packard Co.',36.53,-0.03,-0.08,'9/1 12:00am'],
        ['Honeywell Intl Inc',38.77,0.05,0.13,'9/1 12:00am'],
        ['Intel Corporation',19.88,0.31,1.58,'9/1 12:00am'],
        ['International Business Machines',81.41,0.44,0.54,'9/1 12:00am'],
        ['Johnson & Johnson',64.72,0.06,0.09,'9/1 12:00am'],
        ['JP Morgan & Chase & Co',45.73,0.07,0.15,'9/1 12:00am'],
        ['McDonald\'s Corporation',36.76,0.86,2.40,'9/1 12:00am'],
        ['Merck & Co., Inc.',40.96,0.41,1.01,'9/1 12:00am'],
        ['Microsoft Corporation',25.84,0.14,0.54,'9/1 12:00am'],
        ['Pfizer Inc',27.96,0.4,1.45,'9/1 12:00am'],
        ['The Coca-Cola Company',45.07,0.26,0.58,'9/1 12:00am'],
        ['The Home Depot, Inc.',34.64,0.35,1.02,'9/1 12:00am'],
        ['The Procter & Gamble Company',61.91,0.01,0.02,'9/1 12:00am'],
        ['United Technologies Corporation',63.26,0.55,0.88,'9/1 12:00am'],
        ['Verizon Communications',35.57,0.39,1.11,'9/1 12:00am'],
        ['Wal-Mart Stores, Inc.',45.45,0.73,1.63,'9/1 12:00am']
    ];

    // custom renderer example
    function change(val) {
        if (val > 0) {
            return '<span style="color:green;">' + val + '</span>';
        } else if (val < 0) {
            return '<span style="color:red;">' + val + '</span>';
        }
        return val;
    }

    // custom renderer example
    function pctChange(val) {
        if (val > 0) {
            return '<span style="color:green;">' + val + '%</span>';
        } else if(val < 0) {
            return '<span style="color:red;">' + val + '%</span>';
        }
        return val;
    }

    // custom summary renderer example
    function totalCompanies(v, params, data) {
            params.attr = 'ext:qtip="Total no. of companies"'; // summary column tooltip example
            return v? ((v === 0 || v > 1) ? '(' + v +' 公司)' : '(1 Company)') : '';
    }

    // custom summary renderer example
    function averageChange(v, params, data) {
            params.attr = 'ext:qtip="Average % Change"'; // summary column tooltip example
            return v? ('Average: ' + v) : '';
    }


    // this could be inline, but we want to define the Company record
    // type so we can add records dynamically
    var Company = Ext.data.Record.create([
        {name: 'company'},
        {name: 'price', type: 'float'},
        {name: 'change', type: 'float'},
        {name: 'pctChange', type: 'float'},
        {name: 'lastChange', type: 'date', dateFormat: 'n/j h:ia'}
    ]);

    // create the data store
    var store = new Ext.data.Store({
        reader: new Ext.data.ArrayReader({
            id: 0
        }, Company)
    });

    var summary = new Ext.ux.grid.GridSummary();

    // create the Grid
    var cm=new Ext.grid.ColumnModel([
new Ext.grid.RowNumberer(),
            {id:'company',header: "Company", width: 160, sortable: true, dataIndex: 'company', summaryType: 'count'},
            {header: "Price", width: 75, sortable: true, renderer: 'usMoney', dataIndex: 'price', summaryType: 'sum', editor: new Ext.form.NumberField({allowDecimals: true})},
            {header: "Change", width: 100, sortable: true, renderer: change, dataIndex: 'change', summaryType: 'average', summaryRenderer: averageChange},
            {header: "% Change", width: 75, sortable: true, renderer: pctChange, dataIndex: 'pctChange', summaryType: 'min'},
            {header: "Last Updated", width: 300, sortable: true, renderer: Ext.util.Format.dateRenderer('m/d/Y'), dataIndex: 'lastChange'}
]);

var grid = new Ext.grid.EditorGridPanel({
        renderTo: 'grid-example',
        store: store,
        cm:cm,
        plugins: [summary], // have the EditorGridPanel use the GridSummary plugin
        stripeRows: true,
        height:350,
        width:800,
        title:'Array Grid',
viewConfig:
  {
    forceFit:false,

deferEmptyText:false
},
        tbar: [{
            text: 'Add Company',
            handler : function() {
                var p = new Company({
                    company: 'New Company 1',
                    price: 1,
                    change: 1,
                    pctChange: 100,
                    lastChange: (new Date()).clearTime()
                });
                grid.stopEditing();
                store.insert(0, p);
                grid.startEditing(0, 0);
            }
        }]
    });

    new Ext.Button({
        renderTo: 'toggleSummary',
        text: '载入数据',
        handler: function(btn, e) {
            //summary.toggleSummary();
        store.loadData(myData);
        }
    });
});
</script>
</head>
<body scroll="no"><!-- scroll="no" to remove IE's irritating scrollbar -->
    <div id="grid-example"></div>
    <br/>
    <div id="toggleSummary"></div>
</body>
</html>
Ext.ns('Ext.ux.grid');
var debug = !false;
Ext.ux.grid.GridSummary = function(config) {
Ext.apply(this, config);
};
Ext.extend(Ext.ux.grid.GridSummary, Ext.util.Observable, {
    init : function(grid) {
        this.grid = grid;
        this.cm = grid.getColumnModel();
        this.view = grid.getView();

        var v = this.view;

        // override GridView's onLayout() method
        v.onLayout = this.onLayout;
        v.afterMethod('render', this.refreshSummary, this);
        v.afterMethod('refresh', this.refreshSummary, this);
       // v.afterMethod('syncScroll', this.syncSummaryScroll, this);
        v.afterMethod('onColumnWidthUpdated', this.doWidth, this);
        v.afterMethod('onAllColumnWidthsUpdated', this.doAllWidths, this);
        v.afterMethod('onColumnHiddenUpdated', this.doHidden, this);

        // update summary row on store's add/remove/clear/update events
        grid.store.on({
            add: this.refreshSummary,
            remove: this.refreshSummary,
            clear: this.refreshSummary,
            update: this.refreshSummary,
            scope: this
        });

        if (!this.rowTpl) {
            this.rowTpl = new Ext.Template(
                '<div           style="overflow-x:hidden;"      class="x-grid3-summary-row ,x-grid3-gridsummary-row-offset" >',
                    '<table class="x-grid3-summary-table" border="0" cellspacing="0" cellpadding="0" style="{tstyle}">',
                        '<tbody><tr>{cells}</tr></tbody>',
                    '</table>',
                '</div>'
            );
            this.rowTpl.disableFormats = true;
        }
        this.rowTpl.compile();
        if (!this.cellTpl) {
            this.cellTpl = new Ext.Template(
                '<td class="x-grid3-col x-grid3-cell x-grid3-td-{id} {css}" style="{style}">',
                    '<div class="x-grid3-cell-inner x-grid3-col-{id}" unselectable="on" {attr}>{value}</div>',
                "</td>"
            );
            this.cellTpl.disableFormats = true;
        }
        this.cellTpl.compile();
    },

    calculate : function(rs, cm) {
        var data = {}, cfg = cm.config;
         // loop through all columns in ColumnModel
        for (var i = 0, len = cfg.length; i < len; i++) {
            var cf = cfg[i], // get column's configuration
                cname = cf.dataIndex; // get column dataIndex
            // initialise grid summary row data for the current column being
            // worked on
            data[cname] = 0;
            if (cf.summaryType) {
                for (var j = 0, jlen = rs.length; j < jlen; j++) {
                    var r = rs[j]; // get a single Record

                    data[cname] = Ext.ux.grid.GridSummary.Calculations[cf.summaryType](r.get(cname), r, cname, data, j);

                }
            }
        }
        return data;
    },

    onLayout : function(vw, vh) {
        if (Ext.type(vh) != 'number') { // handles grid's height:'auto' config
            return;
        }
        // note: this method is scoped to the GridView
        if (!this.grid.getGridEl().hasClass('x-grid-hide-gridsummary')) {
            // readjust gridview's height only if grid summary row is visible
            this.scroller.setHeight(vh - this.summary.getHeight());
        }
    },

    syncSummaryScroll : function() {

        var mb = this.view.scroller.dom;
        this.view.summaryWrap.dom.scrollLeft = mb.scrollLeft;
        // second time for IE (1/2 time first fails, other browsers ignore)
        this.view.summaryWrap.dom.scrollLeft = mb.scrollLeft;


      alert(  this.view.summaryWrap.dom.scrollLeft );

    },

    doWidth : function(col, w, tw) {
        var s = this.view.summary.dom;
        s.firstChild.style.width = tw;
        s.firstChild.rows[0].childNodes[col].style.width = w;
    },

    doAllWidths : function(ws, tw) {
        var s = this.view.summary.dom, wlen = ws.length;
        s.firstChild.style.width = tw;
        var cells = s.firstChild.rows[0].childNodes;
        for (var j = 0; j < wlen; j++) {
            cells[j].style.width = ws[j];
        }
    },

    doHidden : function(col, hidden, tw) {
        var s = this.view.summary.dom,
            display = hidden ? 'none' : '';
        s.firstChild.style.width = tw;
        s.firstChild.rows[0].childNodes[col].style.display = display;
    },

    renderSummary : function(o, cs, cm) {
        cs = cs || this.view.getColumnData();
        var cfg = cm.config,
            buf = [],
            last = cs.length - 1;

        for (var i = 0, len = cs.length; i < len; i++) {
            var c = cs[i], cf = cfg[i], p = {};
            p.id = c.id;
            p.style = c.style;
            p.css = i == 0 ? 'x-grid3-cell-first ' : (i == last ? 'x-grid3-cell-last ' : '');
            var ds = this.grid.store;
            if ((cf.summaryType || cf.summaryRenderer)&&ds.getTotalCount()>0) {
                p.value = (cf.summaryRenderer || c.renderer)(o.gridData[c.name], p, o);
            } else {
                p.value = '';
            }
            if (p.value == undefined || p.value === "") p.value = " ";
            buf[buf.length] = this.cellTpl.apply(
             p);
        }
        return this.rowTpl.apply({
            tstyle: 'width:' + this.view.getTotalWidth() + ';',
            cells: buf.join('')
        });
    },

    refreshSummary : function() {
        var g = this.grid, ds = g.store,
            cs = this.view.getColumnData(),
            cm = this.cm,
            rs = ds.getRange(),
            data = this.calculate(rs, cm),
            buf = this.renderSummary({gridData: data}, cs, cm);

        if (!this.view.summaryWrap) {

            this.view.summaryWrap = Ext.DomHelper.insertAfter(this.view.scroller, {
                tag: 'div',
                cls: 'x-grid3-gridsummary-row-inner'
            }, true);

        }

        this.view.summary = this.view.summaryWrap.update(buf).first();

         this.view.scroller.setStyle('overflow-x', 'hidden');
         var view2= this.view;
         this.view.summary.setStyle('overflow-x', 'scroll');
          this.view.summary.on("scroll"   ,function(){


           view2.scroller.dom.scrollLeft=view2.summary.dom.scrollLeft
          }
           );
          },


    toggleSummary : function(visible) { // true to display summary row
        var el = this.grid.getGridEl();

        if (el) {
            if (visible === undefined) {
                visible = el.hasClass('x-grid-hide-gridsummary');
            }
            el[visible ? 'removeClass' : 'addClass']('x-grid-hide-gridsummary');

            this.view.layout(); // readjust gridview height
        }
    },

    getSummaryNode : function() {
        return this.view.summary
    }
});
Ext.reg('gridsummary', Ext.ux.grid.GridSummary);

Ext.ux.grid.GridSummary.Calculations = {
    sum : function(v, record, colName, data, rowIdx) {
        return data[colName] + Ext.num(v, 0);
    },

    count : function(v, record, colName, data, rowIdx) {
        return rowIdx + 1;
    },

    max : function(v, record, colName, data, rowIdx) {
        return Math.max(Ext.num(v, 0), data[colName]);
    },

    min : function(v, record, colName, data, rowIdx) {
        return Math.min(Ext.num(v, 0), data[colName]);
    },

    average : function(v, record, colName, data, rowIdx) {
        var t = data[colName] + Ext.num(v, 0), count = record.store.getCount();
        return rowIdx == count - 1 ? (t / count) : t;
    }
}


 879
879

 被折叠的 条评论
为什么被折叠?
被折叠的 条评论
为什么被折叠?
 到【灌水乐园】发言


