


 文章描述了如何使用LetChart.js创建交互式图表,特别关注了如何处理X轴坐标数据,以及在窗口尺寸变化时如何保持图表的动态更新。作者提到避免在数据处理阶段修改原始数组,以保持数据一致性。
let chart = new Chart({
container: props.domId,
autoFit: true,
height: 260
});
chart.data({
type: 'inline',
value: props.data,
transform: [ //!!关键代码,处理X轴坐标数据
{
type: 'map',
callback: (item, index) => {
item.dateTime = item.dateTime.slice(11, 16)
item.index = index
return item
},
},
]
});
chart
.line()
.scale('color', {
type: 'threshold',
domain: [props.max],
range: ['#79aef6', '#c83a5e'],
})
.encode('x', 'dateTime')
.encode('y', 'dataQuality')
.encode('shape', 'smooth') //设置折线图为平滑曲线
.scale('y', {
nice: true,
})
.style('lineWidth', 3)
.style('lineJoin', 'round')
.axis('x', {
title: '',
tick: false,
labelAutoHide: true,
labelSpacing: 12,
grid: true,
gridLineDash: [0,0],
labelAlign: 'parallel'
})
.axis('y', {
title: '',
tick: false,
labelSpacing: 12,
grid: true,
gridLineDash: [0,0]
})
.legend(false)
.tooltip({name: '实时数据', channel: 'y'});
chart
.area() //绘制阴影图
.encode('shape', 'smooth') //设置为平滑
.encode('x', 'dateTime')
.encode('y', 'dataQuality')
.style('connect', true)
.style('connectFill', '#79aef6')//深蓝色
.style('fill', 'linear-gradient(90deg, rgba(52, 183, 255, 1) 0%, rgba(165, 125, 255, 0) 100%)') //设置渐变色
.style('fillOpacity', 0.45)
.tooltip(false)
if (props.data.find(item => item.dataQuality > props.max)) {
chart
.lineY() //绘制标准线
.encode('y', props.max)
.style('stroke', '#bac5e6')//浅蓝色
.style('strokeOpacity', 0.3)
.style('lineWidth', 1)
.style('lineDash', [4, 4])
.label({
text: '标准最大值',
position: 'right',
fontSize: 10,
});
chart
.area() //预警区域面积
.encode('x', 'dateTime')
.encode('y', [props.max, (d) => d.dataQuality > props.max ? d.dataQuality : null])
.style('connect', false)
.style('connectFill', '#c83a5e')//红色
.style('fill', '#c83a5e')
.style('fillOpacity', 0.45)
.tooltip(false);
}
if (props.data.find(item => item.dataQuality < props.min)) {
chart
.lineY()
.encode('y', props.min)
.style('stroke', '#bac5e6')//浅蓝色
.style('strokeOpacity', 0.3)
.style('lineWidth', 1)
.style('lineDash', [4, 4])
.label({
text: '标准最小值',
position: 'right',
fontSize: 10,
});
chart
.area()
.encode('shape', 'smooth')
.encode('x', 'dateTime')
.encode('y', [0, (d) => d.dataQuality < props.min ? d.dataQuality : null])
.style('connect', false)
.style('connectFill', '#c83a5e')//红色
.style('fill', '#c83a5e')
.style('fillOpacity', 0.45)
.tooltip(false);
}
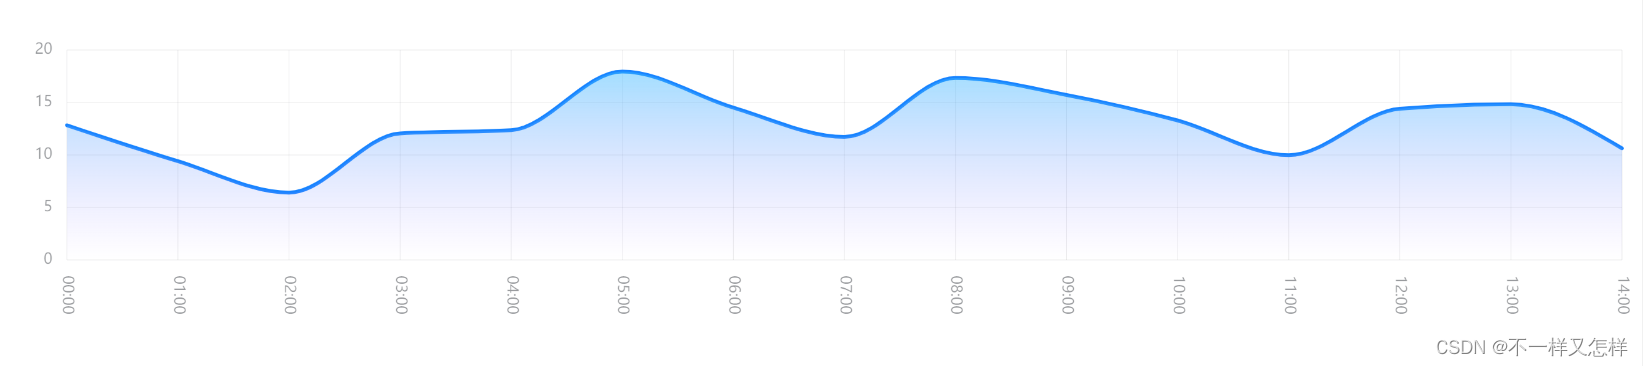
chart.render();正常情况视图为:
改变窗口尺寸后

解决方法: 折线图重绘时会再次执行transform ,不要在这里对原数组进行改变!!!
item.dateTime = item.dateTime.slice(11, 16)
覆盖了原来的值,可另外加一个字段或者后端新增x轴所需处理后的字段直接用!


 1428
1428

 被折叠的 条评论
为什么被折叠?
被折叠的 条评论
为什么被折叠?
 到【灌水乐园】发言


