


 本文介绍了如何在Vue项目中使用vuedraggable库实现图表的拖拽功能,包括组件引入、效果展示、下载以及在不同页面的使用示例,还展示了如何配合ECharts进行图表配置的修改和删除。
1 其他示例
- 如果觉得这篇文章代码太过繁琐,可以看这篇,这是个简单的拖拽例子
https://www.jianshu.com/p/587af7e163c1
2 本文完整代码
2.1 效果图
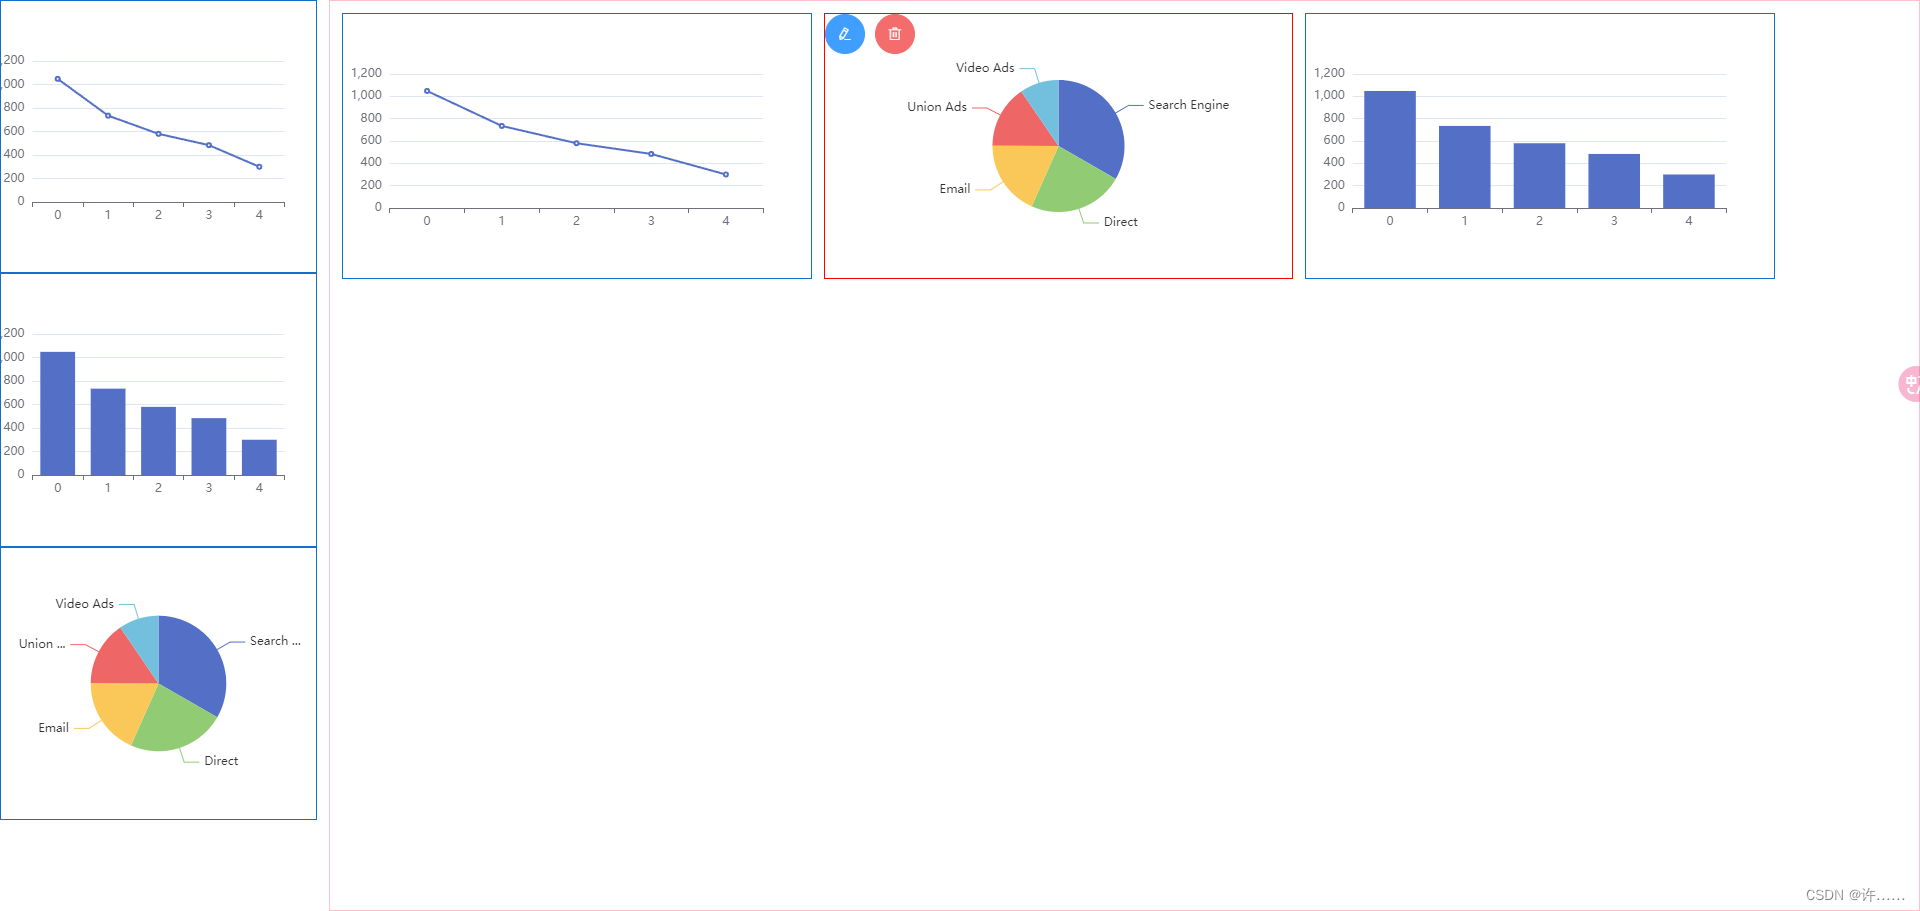
2.2 下载
npm i vuedraggable
2.3 在需要的页面引入(也可全局引入看自己需求)
- 按需引入
import draggable from 'vuedraggable'
  export default {
    components: {
      draggable
   }
}
- 全局引入
// main.js
import draggable from 'vuedraggable'
Vue.component('draggable', draggable)
2.4 完整代码
<template>
<div class="center">
<!-- 可拖拽区域 -->
<div class="flex-center">
<div class="flex-column">
<draggable class="flex-center-L" v-model="echartsList" @end="ends" :options="{ group: { name: 'itxst', pull: 'clone', put: false }, sort: true,}"
animation="300">
<div class="echarts-center" v-for="item in echartsList" :key="item.echartsType">
<div class="echarts-demo"></div>
</div>
</draggable>
</div>
<!-- 拖拽值接收区域 -->
<draggable class="flex-center-R" v-model="echartsDraggable" :options="{ group: { name: 'itxst', pull: 'clone' }, sort: true, }" animation="300">
<div class="echarts-center" :class="{'echarts-center-color': indexEcharts=== index}" @click="indexEcharts = index"
v-for="(item,index) in echartsDraggable" :key="index">
<div class="echarts-demo-clone"></div>
<!-- 操作按钮 -->
<div class="echarts-button" v-if="indexEcharts=== index">
<el-button type="primary" icon="el-icon-edit" circle @click="edit(index)"></el-button>
<el-button type="danger" icon="el-icon-delete" circle @click="deleteData(index)"></el-button>
</div>
</div>
</draggable>
</div>
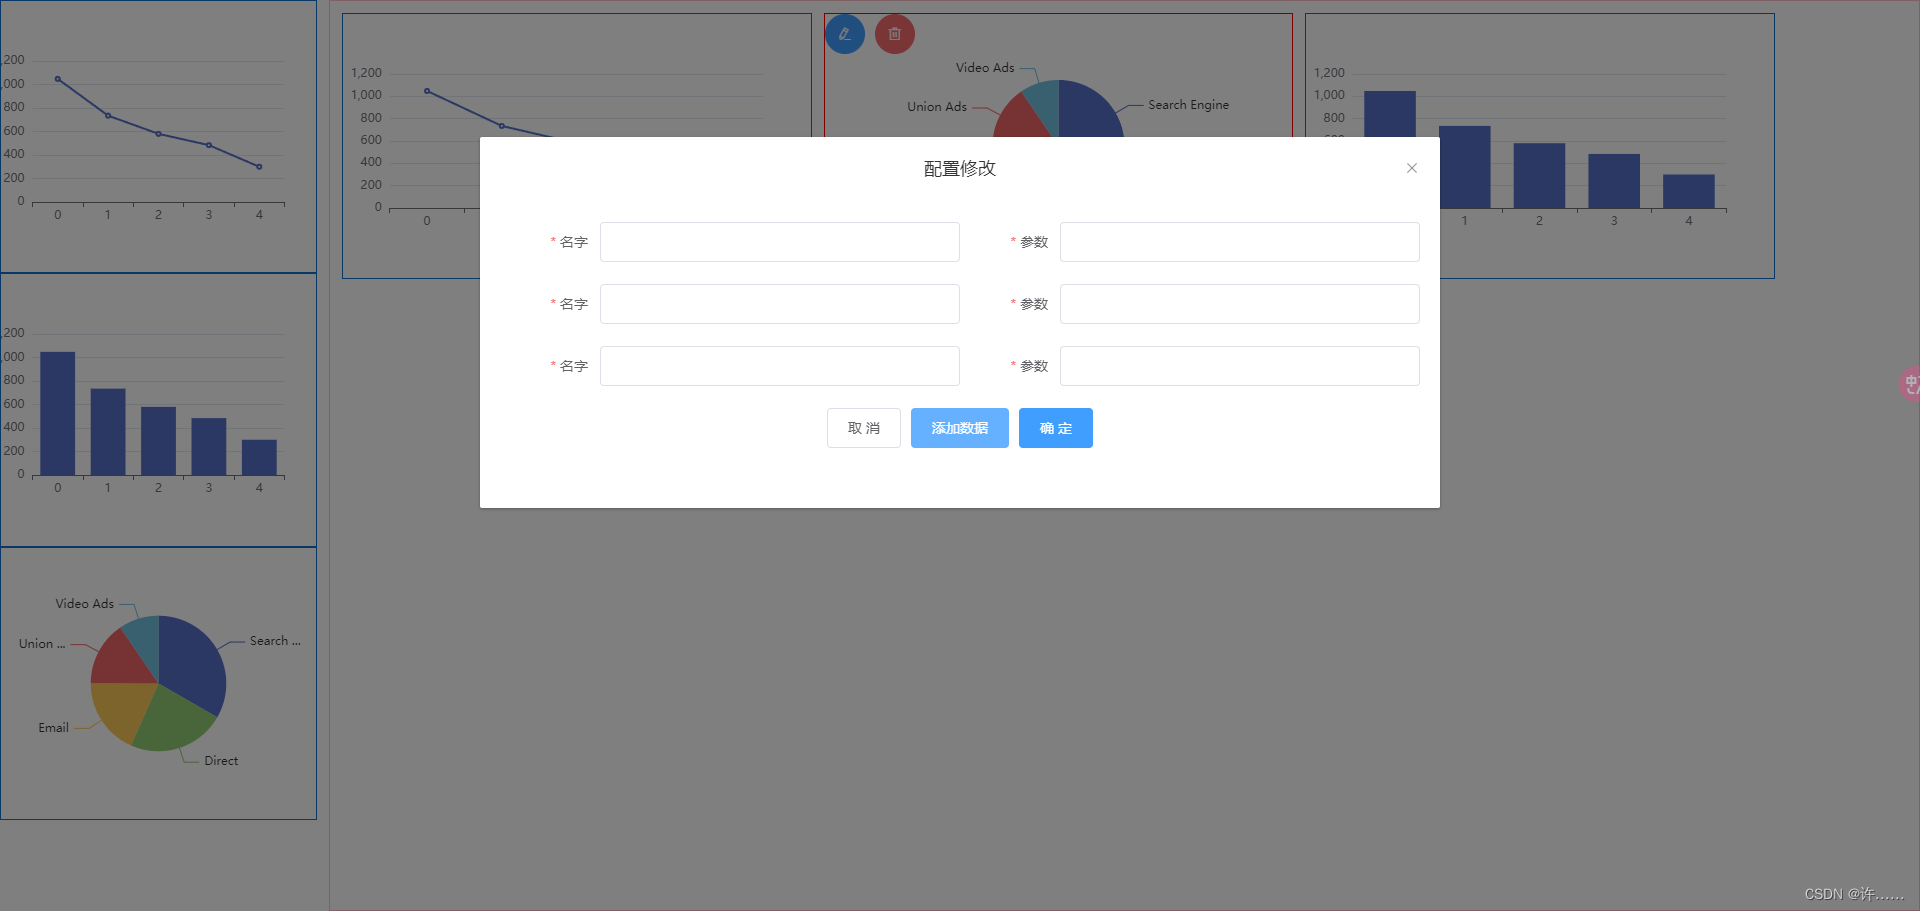
<!-- 修改图表配置弹窗 -->
<el-dialog title="配置修改" :visible.sync="dialogVisible" width="50%" :close-on-click-modal="false">
<el-form :model="ruleForm" :rules="rules" ref="ruleForm" label-width="100px" class="demo-ruleForm">
<div class="form-item-center" v-for="(domain, index) in ruleForm.echartsList" :key="index">
<el-form-item label='名字' :prop="'echartsList.' + index + '.name'" :rules="{required: true, message: '名字不能为空', trigger: 'blur'}">
<el-input v-model="domain.name"></el-input>
</el-form-item>
<el-form-item label='参数' :prop="'echartsList.' + index + '.value'" :rules="{ required: true, message: '参数不能为空', trigger: 'blur'}">
<el-input v-model="domain.value"></el-input>
</el-form-item>
</div>
</el-form>
<span slot="footer" class="dialog-footer">
<el-button @click="dialogVisible = false">取 消</el-button>
<el-button type="primary" @click="addData">添加数据</el-button>
<el-button type="primary" @click="submitForm">确 定</el-button>
</span>
</el-dialog>
</div>
</template>
<script>
import Vuedraggable from 'vuedraggable'
import * as echarts from "echarts";
export default {
name: 'draggable-echarts',
props: {},
components: {
Vuedraggable
},
data () {
return {
dialogVisible: false,
myChart: null,
myChartClone: null,
indexEcharts: null, // 鼠标是否经过当前图表
echartsDraggable: [], // 拖拽后数据会动态填入
echartsList: [
{ echartsType: "line", },
{ echartsType: "bar", },
{ echartsType: "pie", }
],
ruleForm: {
echartsList: [
{ name: "", value: "" },
{ name: "", value: "" }
]
},
rules: {},
}
},
computed: {},
watch: {},
created () { },
mounted () {
this.init()
window.onresize = function () {
if (this.myChart) this.myChart.resize();
if (this.myChartClone) this.myChartClone.resize();
};
},
methods: {
// 左侧待拖拽图表
init () {
const dom = document.querySelectorAll(".echarts-demo");
Array.from(dom).map((x, index) => {
let xAxisConfig = {}
if (this.echartsList[index].echartsType !== 'pie') {
xAxisConfig = {
type: "category",
}
} else {
xAxisConfig = {
show: false,
type: "category",
}
}
let yAxisConfig = {}
if (this.echartsList[index].echartsType !== 'pie') {
yAxisConfig = {
type: "value",
}
} else {
yAxisConfig = {
show: false,
type: "category",
}
}
let seriesConfig = []
if (this.echartsList[index].echartsType !== 'pie') {
seriesConfig = [
{
name: 'index',
type: this.echartsList[index].echartsType,
data: [
{ value: 1048, name: 'Search Engine' },
{ value: 735, name: 'Direct' },
{ value: 580, name: 'Email' },
{ value: 484, name: 'Union Ads' },
{ value: 300, name: 'Video Ads' }],
},
]
} else {
seriesConfig = [
{
name: 'index',
radius: '50%',
type: this.echartsList[index].echartsType,
data: [
{ value: 1048, name: 'Search Engine' },
{ value: 735, name: 'Direct' },
{ value: 580, name: 'Email' },
{ value: 484, name: 'Union Ads' },
{ value: 300, name: 'Video Ads' }],
},
]
}
// 渲染 echarts 图表
this.myChart = echarts.init(x);
this.myChart.setOption({
tooltip: {
trigger: "item",
},
xAxis: xAxisConfig,
yAxis: yAxisConfig,
series: seriesConfig
});
});
},
// 拖拽结束
ends (e) {
// 解决拷贝拖拽,对象类型指向问题
this.echartsDraggable = this.echartsDraggable.map(x => {
return JSON.parse(JSON.stringify(x))
})
// oldIndex 克隆来源索引位,newIndex 克隆目标索引位置
this.$nextTick(() => {
this.draggableEcharts(e.oldIndex, e.newIndex)
})
},
// 拖拽结束渲染右侧图表
draggableEcharts (oldIndex, newIndex) {
const dom = document.querySelectorAll(".echarts-demo-clone");
Array.from(dom).map((x, index) => {
let xAxisConfig = {}
if (this.echartsDraggable[index].echartsType !== 'pie') {
xAxisConfig = {
type: "category",
}
} else {
xAxisConfig = {
show: false,
type: "category",
}
}
let yAxisConfig = {}
if (this.echartsDraggable[index].echartsType !== 'pie') {
yAxisConfig = {
type: "value",
}
} else {
yAxisConfig = {
show: false,
type: "category",
}
}
let seriesConfig = []
if (this.echartsDraggable[index].echartsType !== 'pie') {
seriesConfig = [
{
name: 'index',
// 没有配置类型时,默认类型为 line
type: this.echartsDraggable[index].echartsType || 'line',
// 没有参数时,添加默认参数
data: this.echartsDraggable[index].echartsData || [
{ value: 1048, name: 'Search Engine' },
{ value: 735, name: 'Direct' },
{ value: 580, name: 'Email' },
{ value: 484, name: 'Union Ads' },
{ value: 300, name: 'Video Ads' }],
},
]
} else {
seriesConfig = [
{
name: 'index',
radius: '50%',
// 没有配置类型时,默认类型为 line
type: this.echartsDraggable[index].echartsType,
// 没有参数时,添加默认参数
data: this.echartsDraggable[index].echartsData || [
{ value: 1048, name: 'Search Engine' },
{ value: 735, name: 'Direct' },
{ value: 580, name: 'Email' },
{ value: 484, name: 'Union Ads' },
{ value: 300, name: 'Video Ads' }],
},
]
}
console.log(xAxisConfig, yAxisConfig, seriesConfig);
// 渲染 echarts 图表
this.myChartClone = echarts.init(x);
this.myChartClone.setOption({
tooltip: {
trigger: "item",
},
xAxis: xAxisConfig,
yAxis: yAxisConfig,
series: seriesConfig
});
});
},
// 编辑图表配置
edit () {
this.dialogVisible = true
this.$nextTick(() => {
this.$refs.ruleForm.resetFields();
})
},
// 弹窗添加数据
addData () {
this.ruleForm.echartsList.push({ name: "", value: "" })
},
// 弹窗填写配置确定
submitForm () {
this.$refs.ruleForm.validate((valid) => {
if (valid) {
this.dialogVisible = false
// 根据当前选中的图表,将表单填值再配置上
console.log(this.indexEcharts);
this.echartsDraggable[this.indexEcharts].echartsData = JSON.parse(JSON.stringify(this.ruleForm.echartsList))
// 重新渲染图表
this.draggableEcharts()
} else {
return false;
}
})
},
// 删除图表
deleteData (index) {
this.echartsDraggable.splice(index, 1)
},
},
}
</script>
<style scoped lang="less">
.center {
width: 100%;
height: 100%;
.flex-center {
display: flex;
width: 100%;
height: 100%;
.flex-column {
width: 20%;
height: 100%;
display: flex;
flex-direction: column;
.flex-center-L {
width: 100%;
height: 100%;
}
.echarts-center {
width: 100%;
height: 30%;
border: 1px solid #126fcc;
.echarts-demo {
width: 100%;
height: 100%;
}
}
}
.flex-center-R {
width: 100%;
height: 100%;
border: 1px solid pink;
display: flex;
flex-wrap: wrap;
padding: 12px;
margin-left: 12px;
.echarts-center {
width: 30%;
height: 30%;
border: 1px solid #126fcc;
position: relative;
margin-right: 12px;
.echarts-demo-clone {
width: 100%;
height: 100%;
}
.echarts-button {
position: absolute;
left: 0;
top: 0;
}
}
.echarts-center-color {
border: 1px solid red;
}
}
}
.form-item-center {
display: flex;
::v-deep .el-form-item {
width: 50%;
}
}
::v-deep .el-dialog__footer {
text-align: center;
}
}
</style>


 被折叠的 条评论
为什么被折叠?
被折叠的 条评论
为什么被折叠?
 到【灌水乐园】发言


