


分析SQL
SHOW PROFILE
show profile是在MySQL版本5.1以后引入的 查看版本select version()用来剖析单个语句各个节点的耗时。默认是关闭的。
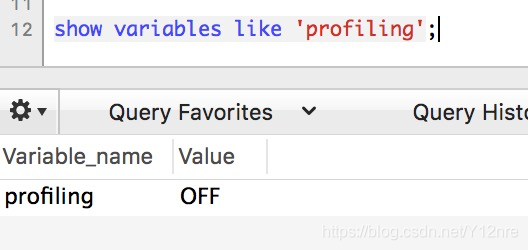
查看profile状态
show variables like 'profiling';
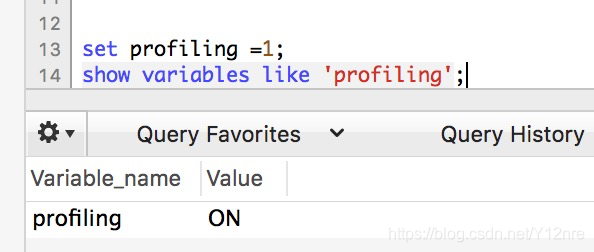
开启profile状态
set profiling = 1;
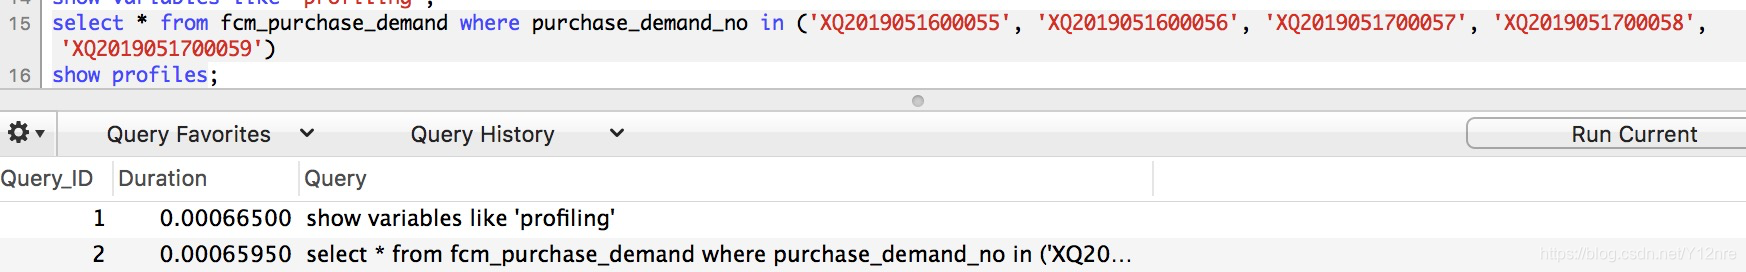
查询分析语句
刚打开profile的时候查询里面应该是空的,当执行查询的时候,里面会有值,query_id是递增的。
show profiles;
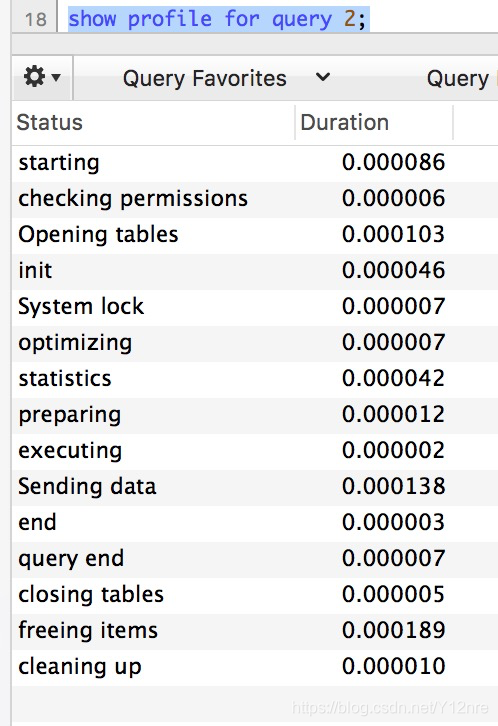
分析每个步骤的耗时
show profile for query query_id show profiles; 表里的query_Id
show profile for query 2;
排序查看耗时
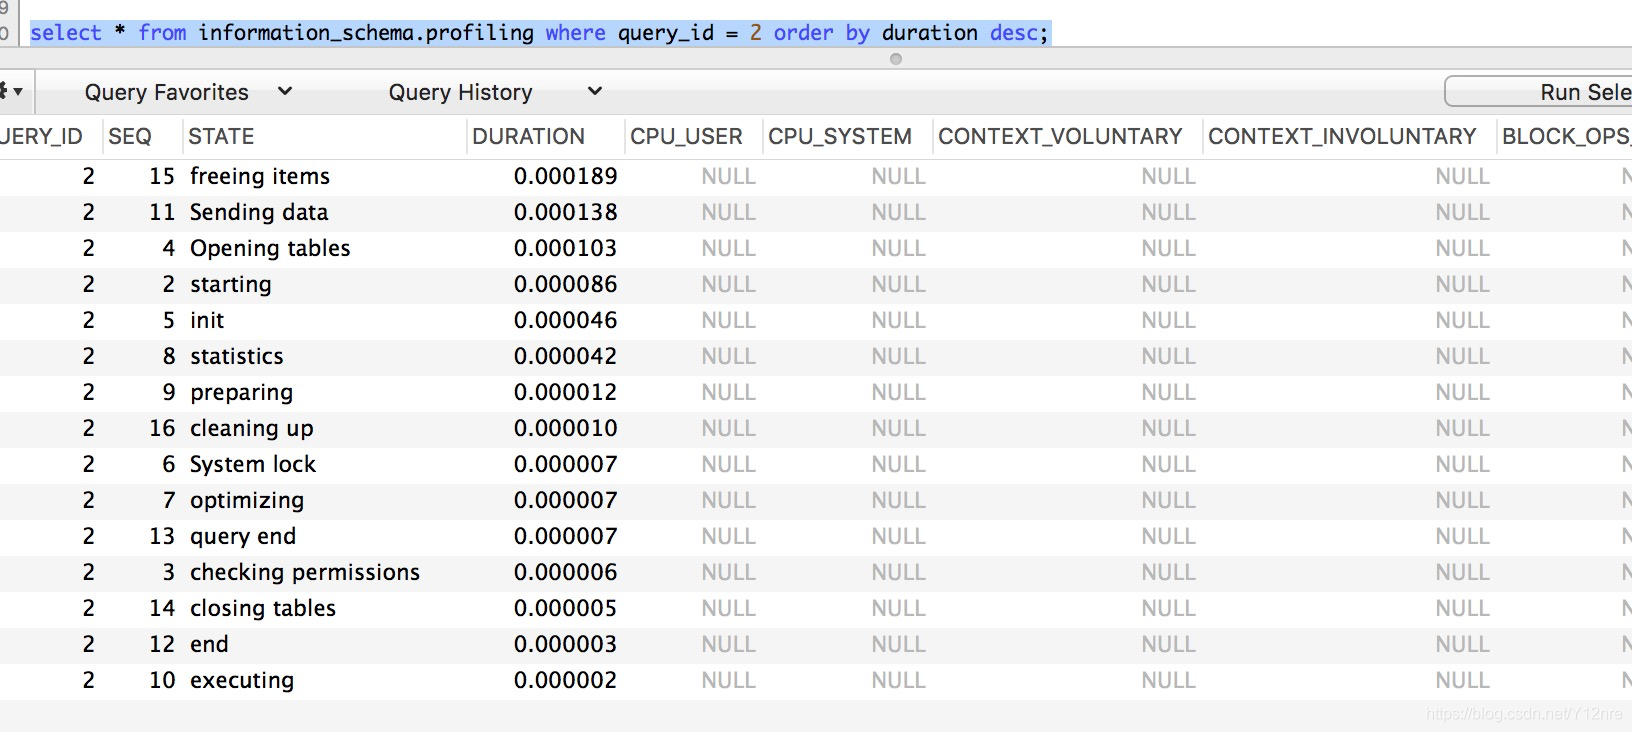
使用show profile 是无法进行排序的,同时能够查询的内容仅限耗时,使用下面的查询方法,可以排序,同时还可以查查询其他东西的耗时,比如CPU等。。。
select * from information_schema.profiling where query_id = 2 order by duration desc;
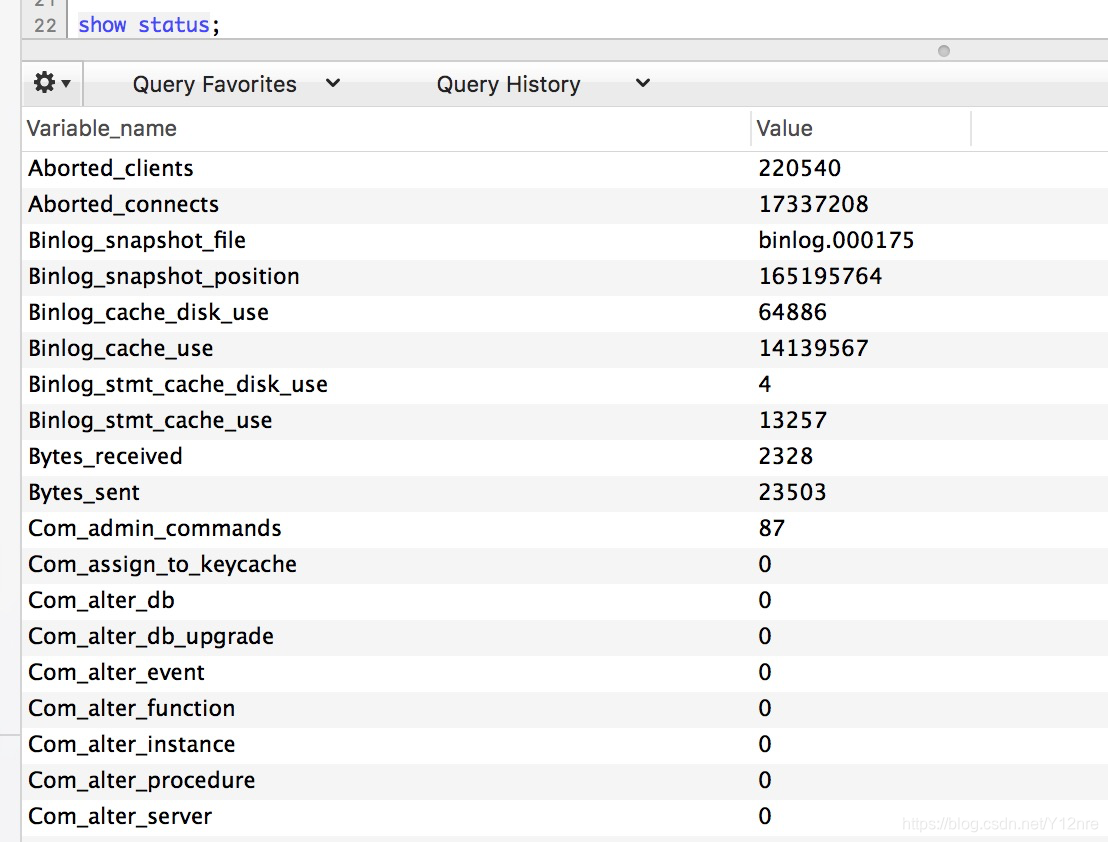
SHOW STATUS
查看状态
show status;
清空状态
在查询全局的时候,可以先清空然后在查询,全局是一个类似计数器的存在,记录的全局,单独查看某个SQL还有干扰性。
如果没有权限,可以使用session级别的show status查看。
flush STATUS;
查看
show session status where variable_name like "Handler%" or Variable_name like 'Created%';
SHOW PROCESSLIST
如果有 SUPER 权限,则可以看到全部的线程,否则,只能看到自己发起的线程(这是指,当前对应的 MySQL 帐户运行的线程)
查看
show processlist;


 115
115


 被折叠的 条评论
为什么被折叠?
被折叠的 条评论
为什么被折叠?
 到【灌水乐园】发言


