


Overview
Prometheus是一个开源的系统监控和报警的工具包,最初由SoundCloud发布。
Features
Prometheus的主要特点是:
- 多维数据模型(有metric名称和键值对确定的时间序列)
- 灵活的查询语言
- 不依赖分布式存储
- 通过pull方式采集时间序列,通过http协议传输
- 支持通过中介网关的push时间序列的方式
- 监控数据通过服务或者静态配置来发现
- 支持图表和dashboard等多种方式
Components
Prometheus包含多个组件,其中有许多是可选的:
- Prometheus主服务器,用来收集和存储时间序列数据
- 应用程序client代码库
- 短时jobs的push gateway
- 基于Rails/SQL的GUI dashboard
- 特殊用途的exporter(包括HAProxy、StatsD、Ganglia等)
- 用于报警的alertmanager
- 命令行工具查询
大多数的组件都是用Go来完成的,使得它们方便构建和部署。
Architecture
下图说明了Prometheus和它的组件的整体架构:
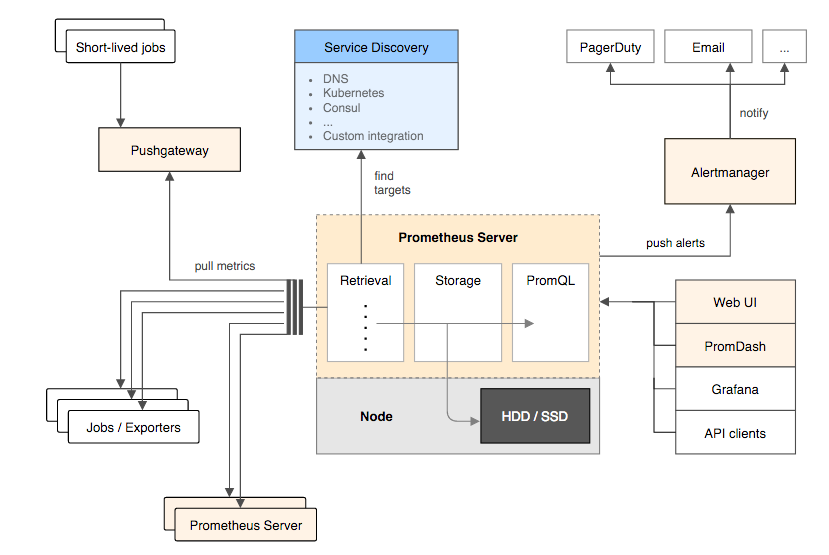
Prometheus通过直接或者短时jobs中介网关收集监控数据,在本地存储所有收集到的数据,并且通过定义好的rules产生新的时间序列数据,或者发送警报。Promdash或者其他使用API的clients可以将采集到的数据可视化。
基本环境配置
接下来给出“Hello World”式的教程,我会介绍如何安装、配置,并且在一个简单的例子中使用Prometheus。在此在本地运行Prometheus,并且配置它监控自己,然后利用查询、规则和图形来使用收集到的时间序列数据。
下载并运行
下载最新版本的Prometheus,然后提取并运行:
tar xvfz prometheus-*.tar.gz
cd prometheus-*
./prometheus
此时应该会报错缺少配置文件。
配置Prometheus进行自我监控
Prometheus可以监控自己,收集自身的监控数据。创建一个名为prometheus.yml的配置文件并保存:
global:
  scrape_interval:     15s # By default, scrape targets every 15 seconds.

  # Attach these labels to any time series or alerts when communicating with
  # external systems (federation, remote storage, Alertmanager).
  external_labels:
    monitor: 'codelab-monitor'

# A scrape configuration containing exactly one endpoint to scrape:
# Here it's Prometheus itself.
scrape_configs:
  # The job name is added as a label `job=<job_name>` to any timeseries scraped from this config.
  - job_name: 'prometheus'

    # Override the global default and scrape targets from this job every 5 seconds.
    scrape_interval: 5s

    target_groups:
      - targets: ['localhost:9090']
        labels:
          group: 'prometheus'

      # Another job or machine
      - targets: ['localhost:3000']
        labels:
group: 'rails-app'有关配置选项的完整规范,请查看配置文档。
启动Prometheus
使用刚刚新创建的文件来启动prometheus服务:
./prometheus -config.file=prometheus.yml此时prometheus服务应该启动起来了,在http://localhost:9090可以看到状态页。你也可以通过http://localhost:9090/metrics查看监控项。
使用表达式查看监控项
为了验证prometheus已经收集到了自身数据,在http://localhost:9090中选择“Console”选项卡中的“Graph”视图。我们以prometheus_target_interval_length_seconds这个监控项为例。
输入并回车后,将返回很多不同的时间序列,都有prometheus_target_interval_length_seconds这个名称,但有不同的标签,这些标签表示不同的时间延迟和不同的用户组。
如果我们只是对第99个百分位数延迟感兴趣,可以利用下面这个查询信息:
prometheus_target_interval_length_seconds{quantile="0.99"}要计算返回的时间序列的数量,可以这样写:
count(prometheus_target_interval_length_seconds)想要了解更多有关表达式语言,请查看表达式语言文档。


 3142
3142

 被折叠的 条评论
为什么被折叠?
被折叠的 条评论
为什么被折叠?
 到【灌水乐园】发言


