


本文为博主自学笔记整理,内容来源于互联网,如有侵权,请联系删除。
01 | 使用 Actuator 组件实现系统监控
引入 Spring Boot Actuator 组件
引入依赖:
<dependency>
    <groupId>org.springframework.boot</groupId>
    <artifactId>spring-boot-starter-actuator</artifactId>
</dependency>
服务启动后,访问 http://localhost:8080/actuator 可以看到如下结果:
{
  "_links":{
    "self":{
      "href":"http://localhost:8080/actuator",
      "templated":false
    },
    "health-path":{
      "href":"http://localhost:8080/actuator/health/{*path}",
      "templated":true
    },
    "health":{
      "href":"http://localhost:8080/actuator/health",
      "templated":false
    },
    "info":{
      "href":"http://localhost:8080/actuator/info",
      "templated":false
    },

    // 上面是默认暴露信息,加上下面就是所有的信息

    "beans":{
      "href":"http://localhost:8080/actuator/beans",
      "templated":false
    },
    "conditions":{
      "href":"http://localhost:8080/actuator/conditions",
      "templated":false
    },
    "configprops":{
      "href":"http://localhost:8080/actuator/configprops",
      "templated":false
    },
    "env":{
      "href":"http://localhost:8080/actuator/env",
      "templated":false
    },
    "env-toMatch":{
      "href":"http://localhost:8080/actuator/env/{toMatch}",
      "templated":true
    },
    "loggers":{
      "href":"http://localhost:8080/actuator/loggers",
      "templated":false
    },
    "loggers-name":{
      "href":"http://localhost:8080/actuator/loggers/{name}",
      "templated":true
    },
    "heapdump":{
      "href":"http://localhost:8080/actuator/heapdump",
      "templated":false
    },
    "threaddump":{
      "href":"http://localhost:8080/actuator/threaddump",
      "templated":false
    },
    "metrics-requiredMetricName":{
      "href":"http://localhost:8080/actuator/metrics/{requiredMetricName}",
      "templated":true
    },
    "metrics":{
      "href":"http://localhost:8080/actuator/metrics",
      "templated":false
    },
    "scheduledtasks":{
      "href":"http://localhost:8080/actuator/scheduledtasks",
      "templated":false
    },
    "mappings":{
      "href":"http://localhost:8080/actuator/mappings",
      "templated":false
    }
  }
}
如果我们想看到所有端点,可以在配置文件中配置:
management:
  endpoints:
    web:
      exposure:
        include: "*"
常见端点梳理如下:
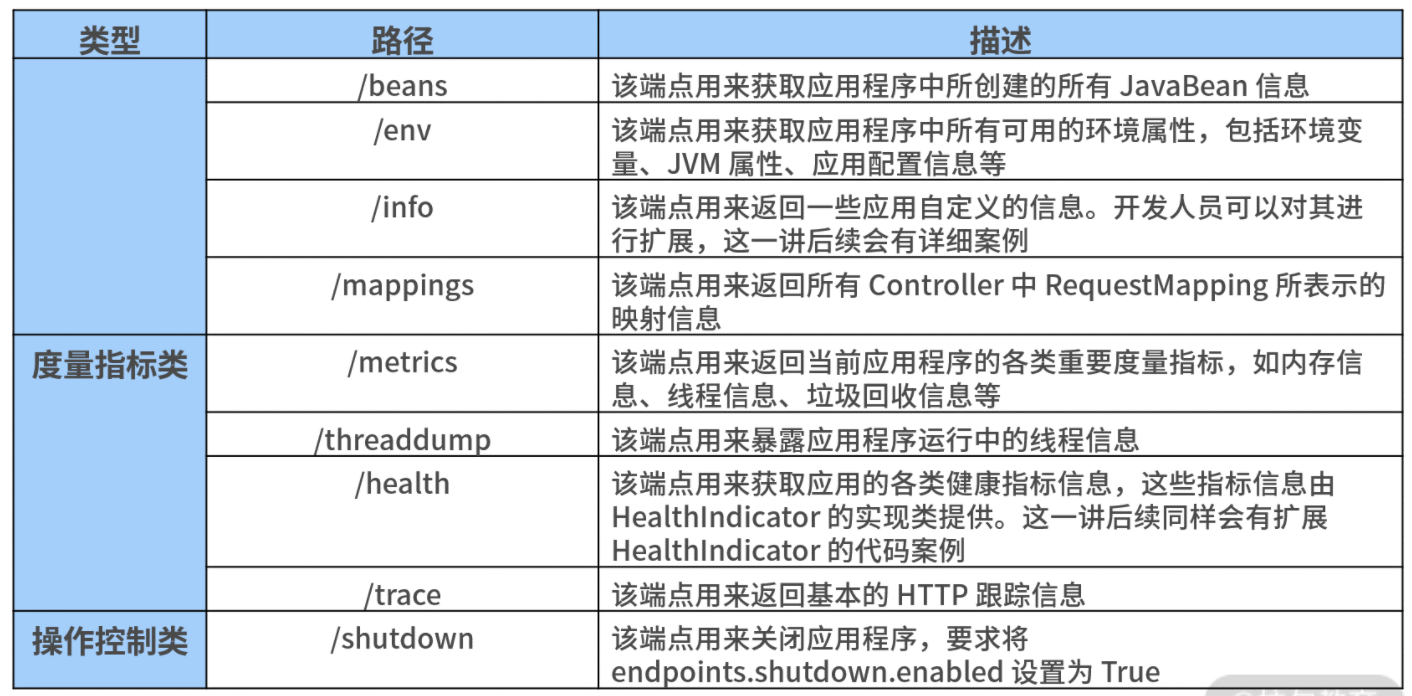
通过访问上表中的各个端点,我们就可以获取自己感兴趣的监控信息了。
health 端点
访问 http://localhost:8082/actuator/health 端点,就可以得到服务的基本状态:
{
  "status":"UP",
  // 下面是更详细的信息
  "components":{
    "diskSpace":{
      "status":"UP",
      "details":{
        "total":201649549312,
        "free":3434250240,
        "threshold":10485760
      }
    },
    "ping":{
      "status":"UP"
    }
  }
}
如果想获取更详细的状态信息,可在配置文件中配置:
management:
  endpoint:
    health:
      show-details: always
扩展 Actuator 端点
Spring Boot 默认暴露了日常开发中最常见的两个端点:Info 端点和 Health 端点。接下来,我们讨论下如何对这两个端点进行扩展。
- 扩展 Info 端点
Info 端点用于暴露 Spring Boot 应用的自身信息。Spring Boot 中常见的 InfoContributor 如下表所示:
| InfoContributor名称 | 描述 |
|---|---|
| EnvironmentInfoContributor | 暴露 Environment 中 key 为 info 的所有 key |
| GitInfoContributor | 暴露 git 信息,如果存在 git.properties 文件 |
| BuildInfoContributor | 暴露构建信息,如果存在 META-INF/build-info.properties 文件 |
EnvironmentInfoContributor 会收集 info 下的所有key,例如在 application.yml 中:
info:
  app:
	  encoding: UTF-8
	  java:
	    source: 1.8.0_31
	    target: 1.8.0_31
我们也可以扩展 info 端点的信息:
@Component
public class CustomBuildInfoContributor implements InfoContributor {

    @Override
    public void contribute(Builder builder) {
        builder.withDetail("build", Collections.singletonMap("timestamp", new Date()));
    }
}
最终效果如下:
{
  "app":{
    "encoding":"UTF-8",
    "java":{
      "source":"1.8.0_31",
      "target":"1.8.0_31"
    }
  },
  "build":{
    "timestamp":1604307503710
  }
}
- 扩展 Health 端点
Health 端点用于检查正在运行的应用程序健康状态,健康状态信息由 HealthIndicator 对象从 Spring 的 ApplicationContext 中获取。
常见的 HealthIndicator 如下表所示:
| HealthIndicator 名称 | 描述 |
|---|---|
| DiskSpaceHealthIndicator | 检查磁盘空间是否足够 |
| DataSourceHealthIndicator | 检查是否可以获得连接 DataSource |
| ElasticsearchHealthIndicator | 检查 Elasticsearch 集群是否启动 |
| JmsHealthIndicator | 检查 JMS 代理是否启动 |
| MailHealthIndicator | 检查邮件服务器是否启动 |
| MongoHealthIndicator | 检查 Mongo 数据库是否启动 |
| RabbitHealthIndicator | 检查 RabbitMQ 服务器是否启动 |
| RedisHealthIndicator | 检查 Redis 服务器是否启动 |
| SolrHealthIndicator | 检查 Solr 服务器是否已启动 |
为了明确某个服务的状态,我们可以自定义一个端点来展示这个服务的状态信息:
@Component
public class CustomerServiceHealthIndicator implements HealthIndicator {

    @Override
    public Health health() {
        try {
            URL url = new URL("http://localhost:8083/health/");
            HttpURLConnection conn = (HttpURLConnection)
            url.openConnection();
            int statusCode = conn.getResponseCode();
            if (statusCode >= 200 && statusCode < 300) {
                return Health.up().build();
            } else {
                return Health.down().withDetail("HTTP Status Code", statusCode).build();
            }
        } catch (IOException e) {
            return Health.down(e).build();
        }
    }
}
效果如下:
{
  "status": "UP",
  "details": {
    "customerservice": {
      "status": "UP"
    }
    …
  }
}
{
  "status": "DOWN",
  "details": {
    "customerservice": {
      "status": "DOWN",
      "details": {
        "HTTP Status Code": "404"
      }
    },
    …
  }
}
{
  "status": "DOWN",
  "details": {
    "customerservice": {
      "status": "DOWN",
      "details": {
        "error": "java.net.ConnectException: Connection refused: connect"
      }
    },
    …
  }
}
02 | 实现自定义的度量指标和 Actuator 端点
在 Spring Boot 中,它为我们提供了一个 Metrics 端点用于实现生产级的度量工具。访问 actuator/metrics 端点后,我们将得到如下所示的一系列度量指标。
{
  "names":[
    "jvm.memory.max",
    "jvm.threads.states",
    "jdbc.connections.active",
    "jvm.gc.memory.promoted",
    "jvm.memory.used",
    "jvm.gc.max.data.size",
    "jdbc.connections.max",
    "jdbc.connections.min",
    "jvm.memory.committed",
    "system.cpu.count",
    "logback.events",
    "http.server.requests",
    "jvm.buffer.memory.used",
    "tomcat.sessions.created",
    "jvm.threads.daemon",
    "system.cpu.usage",
    "jvm.gc.memory.allocated",
    "hikaricp.connections.idle",
    "hikaricp.connections.pending",
    "jdbc.connections.idle",
    "tomcat.sessions.expired",
    "hikaricp.connections",
    "jvm.threads.live",
    "jvm.threads.peak",
    "hikaricp.connections.active",
    "hikaricp.connections.creation",
    "process.uptime",
    "tomcat.sessions.rejected",
    "process.cpu.usage",
    "jvm.classes.loaded",
    "hikaricp.connections.max",
    "hikaricp.connections.min",
    "jvm.gc.pause",
    "jvm.classes.unloaded",
    "tomcat.sessions.active.current",
    "tomcat.sessions.alive.max",
    "jvm.gc.live.data.size",
    "hikaricp.connections.usage",
    "hikaricp.connections.timeout",
    "jvm.buffer.count",
    "jvm.buffer.total.capacity",
    "tomcat.sessions.active.max",
    "hikaricp.connections.acquire",
    "process.start.time"
  ]
}
例如我们想了解当前内存的使用情况,就可以通过 actuator/metrics/jvm.memory.used 端点进行获取,如下代码所示。
{
  "name":"jvm.memory.used",
  "description":"The amount of used memory",
  "baseUnit":"bytes",
  "measurements":[
    {
      "statistic":"VALUE",
      "value":115520544
    }
  ],
  "availableTags":[
    {
      "tag":"area",
      "values":[
        "heap",
        "nonheap"
      ]
    },
    {
      "tag":"id",
      "values":[
        "Compressed Class Space",
        "PS Survivor Space",
        "PS Old Gen",
        "Metaspace",
        "PS Eden Space",
        "Code Cache"
      ]
    }
  ]
}
扩展 Metrics 端点
Metrics 指标体系中包含支持 Counter 和 Gauge 这两种级别的度量指标。通过将 Counter 或 Gauge 注入业务代码中,我们就可以记录自己想要的度量指标。其中,Counter 用来暴露 increment() 方法,而 Gauge 用来提供一个 value() 方法。
下面我们以 Counter 为例介绍在业务代码中嵌入自定义 Metrics 指标的方法,如下代码所示:
@Component
public class CounterService {

    public CounterService() {
        Metrics.addRegistry(new SimpleMeterRegistry());
    }

    public void counter(String name, String... tags) {
        Counter counter = Metrics.counter(name, tags);
        counter.increment();
    }
}
也可以使用 MeterRegistry 进行计数。比如我们希望系统每创建一个客服工单,就对所创建的工单进行计数:
@Service
public class CustomerTicketService {

    @Autowired
    private MeterRegistry meterRegistry;

    public CustomerTicket generateCustomerTicket(Long accountId, String orderNumber) {

        CustomerTicket customerTicket = new CustomerTicket();
        …
        meterRegistry.summary("customertickets.generated.count").record(1);

        return customerTicket;
    }
}
现在访问 actuator/metrics/customertickets.generated.count 端点,就能看到如下信息:
{
  "name":"customertickets.generated.count",
  "measurements":[
    {
      "statistic":"Count",
      "value":1
    },
    {
      "statistic":"Total",
      "value":19
    }
  ]
}
同样可以使用 AbstractRepositoryEventListener 实现上述的效果:
@Component
public class CustomerTicketMetrics extends AbstractRepositoryEventListener<CustomerTicket> {

    private MeterRegistry meterRegistry;

    public CustomerTicketMetrics(MeterRegistry meterRegistry) {
        this.meterRegistry = meterRegistry;
    }

    @Override
    protected void onAfterCreate(CustomerTicket customerTicket) {
        meterRegistry.counter("customerticket.created.count").increment();
    }
}
自定义 Actuator 端点
假设我们需要提供一个监控端点以获取当前系统的用户信息和计算机名称,就可以通过一个独立的 MySystemEndPoint 进行实现,如下代码所示:
@Configuration
@Endpoint(id = "mysystem", enableByDefault=true)
public class MySystemEndpoint {

    @ReadOperation
    public Map<String, Object> getMySystemInfo() {
        Map<String,Object> result= new HashMap<>();
        Map<String, String> map = System.getenv();
        result.put("username",map.get("USERNAME"));
        result.put("computername",map.get("COMPUTERNAME"));
        return result;
    }
}
@ReadOperation 注解用于标识读取数据操作。在 Actuator 中,还提供 @WriteOperation 和 @DeleteOperation 注解。
现在,通过访问 http://localhost:8080/actuator/mysystem,我们就能获取如下所示监控信息。
{
  "computername":"LAPTOP-EQB59J5P",
  "username":"user"
}
有时为了获取特定的度量信息,我们需要对某个端点传递参数,而 Actuator 专门提供了一个 @Selector 注解标识输入参数,示例代码如下所示:
@Configuration
@Endpoint(id = "account", enableByDefault = true)
public class AccountEndpoint {

    @Autowired
    private AccountRepository accountRepository;

    @ReadOperation
    public Map<String, Object> getMySystemInfo(@Selector String arg0) {
        Map<String, Object> result = new HashMap<>();
        result.put(accountName, accountRepository.findAccountByAccountName(arg0));
        return result;
    }
}
接着,使用 http://localhost:8080/actuator/ account/account1 这样的端口地址就可以触发度量操作了。
03 | 使用 Admin Server 管理 Spring 应用程序
Spring Boot Admin 是一个用于监控 Spring Boot 的应用程序,它的基本原理是通过统计、集成 Spring Boot Actuator 中提供的各种 HTTP 端点,从而提供简洁的可视化 WEB UI。
Spring Boot Admin 的整体架构中存在两大角色,服务器端组件 Admin Server 和客户端组件 Admin Client。Admin Client 实际上是一个普通的 Spring Boot 应用程序,而 Admin Server 则是一个独立服务,需要进行专门构建。如下图所示:

构建 Admin Server 的两种实现方式:一种是简单的基于独立的 Admin 服务;另一种需要依赖服务注册中心的服务注册和发现机制。
基于独立服务构建 Admin Server
创建 Spring Boot 应用程序并引入依赖:
<dependency>
  <groupId>de.codecentric</groupId>
  <artifactId>spring-boot-admin-server</artifactId>
</dependency>

<dependency>
  <groupId>de.codecentric</groupId>
  <artifactId>spring-boot-admin-server-ui</artifactId>
</dependency>
在 Bootstrap 类上添加 @EnableAdminServer 注解:
@SpringBootApplication
@EnableAdminServer
public class AdminApplication {

    public static void main(String[] args) {
        SpringApplication.run(AdminApplication.class, args);
    }
}
接下来我们将应用程序关联到 Admin Server。
引入依赖:
<dependency>
  <groupId>de.codecentric</groupId>
  <artifactId>spring-boot-admin-starter-client</artifactId>
</dependency>
然后,我们在配置文件中添加 Admin Server 的配置信息。
spring:
  boot:
    admin:
      client:
        url: http://localhost:9000
启动应用程序和 Admin Server 后,可以看到如下效果:

基于注册中心构建 Admin Server
基于注册中心,Admin Server 与各个 Admin Client 之间的交互方式如下图所示:

引入注册中心的目的是降低 Admin Client 与 Admin Server 之间的耦合度。
Admin Client 和 Admin Server 都需要使用如下所示的 Eureka 客户端组件。
<dependency>
  <groupId>org.springframework.cloud</groupId>
  <artifactId>spring-cloud-starter-netflix-eureka-client</artifactId>
</dependency>
接着在 Admin Server 的配置文件中配置如下:
eureka:
  client:
    registerWithEureka: true
    fetchRegistry: true
    serviceUrl:
      defaultZone: http://localhost:8761/eureka/
控制访问安全性
有些监控功能不应该暴露给所有的开发人员。因此,我们需要控制 Admin Server 的访问安全性。
引入依赖:
<dependency>
  <groupId>org.springframework.boot</groupId>
  <artifactId>spring-boot-starter-security</artifactId>
</dependency>
然后,我们在配置文件中添加如下配置项:
spring:
  security:
    user:
      name: "springcss_admin"
      password: "springcss_password"
重启 Admin Server 后,再次访问 Web 界面时,就需要我们输入用户名和密码了,如下图所示:


 1万+
1万+


 被折叠的 条评论
为什么被折叠?
被折叠的 条评论
为什么被折叠?
 到【灌水乐园】发言


