


主要参考文章
微信小程序使用Echarts-for-weixin实现图表动态更新数据、懒加载(干货满满!!!)-CSDN博客
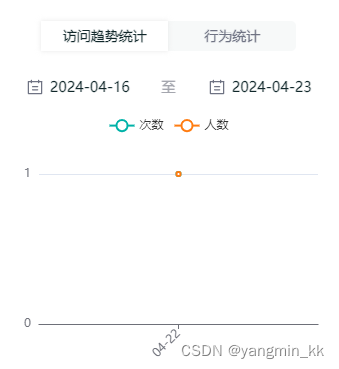

如图,我这边的主要需求是折线图和横向柱状图切换展示
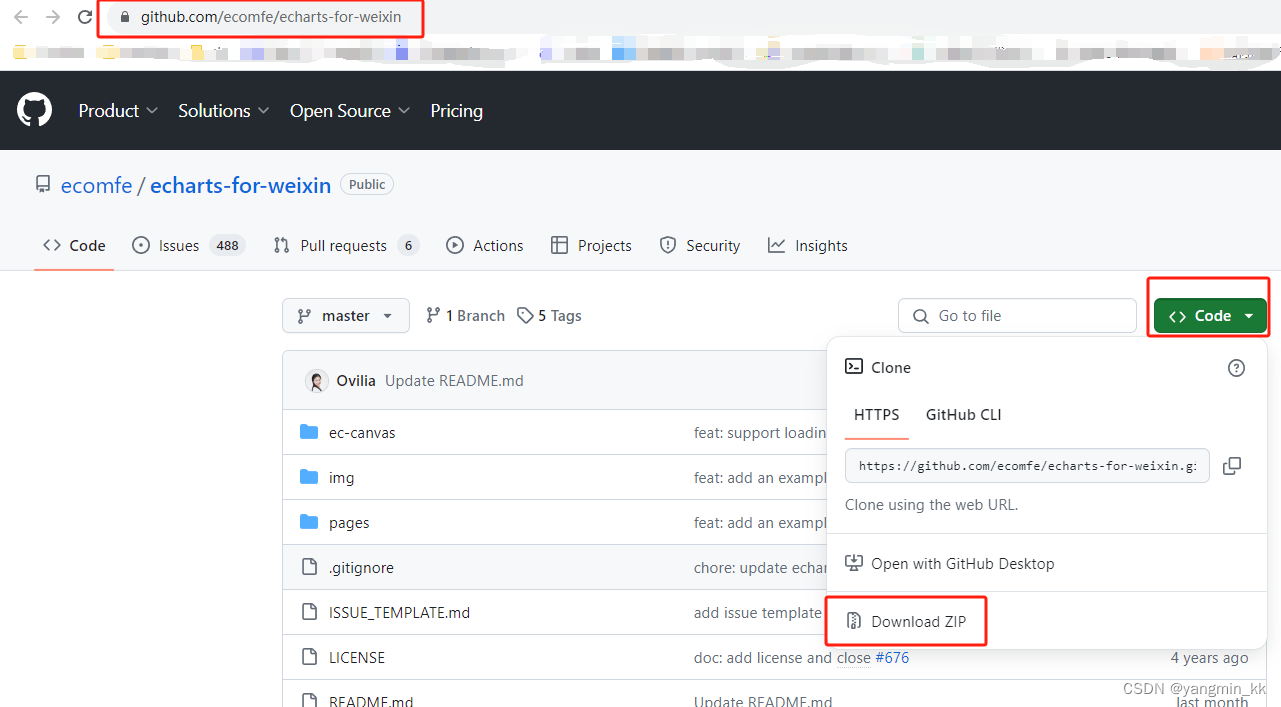
一、下载Echart-for-weixin
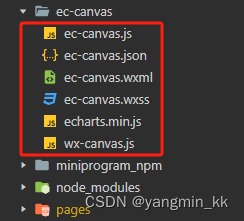
echart-for-weixin1.echart-for-weixin 项目提供了一个小程序组件(ec-canvas),下载下来
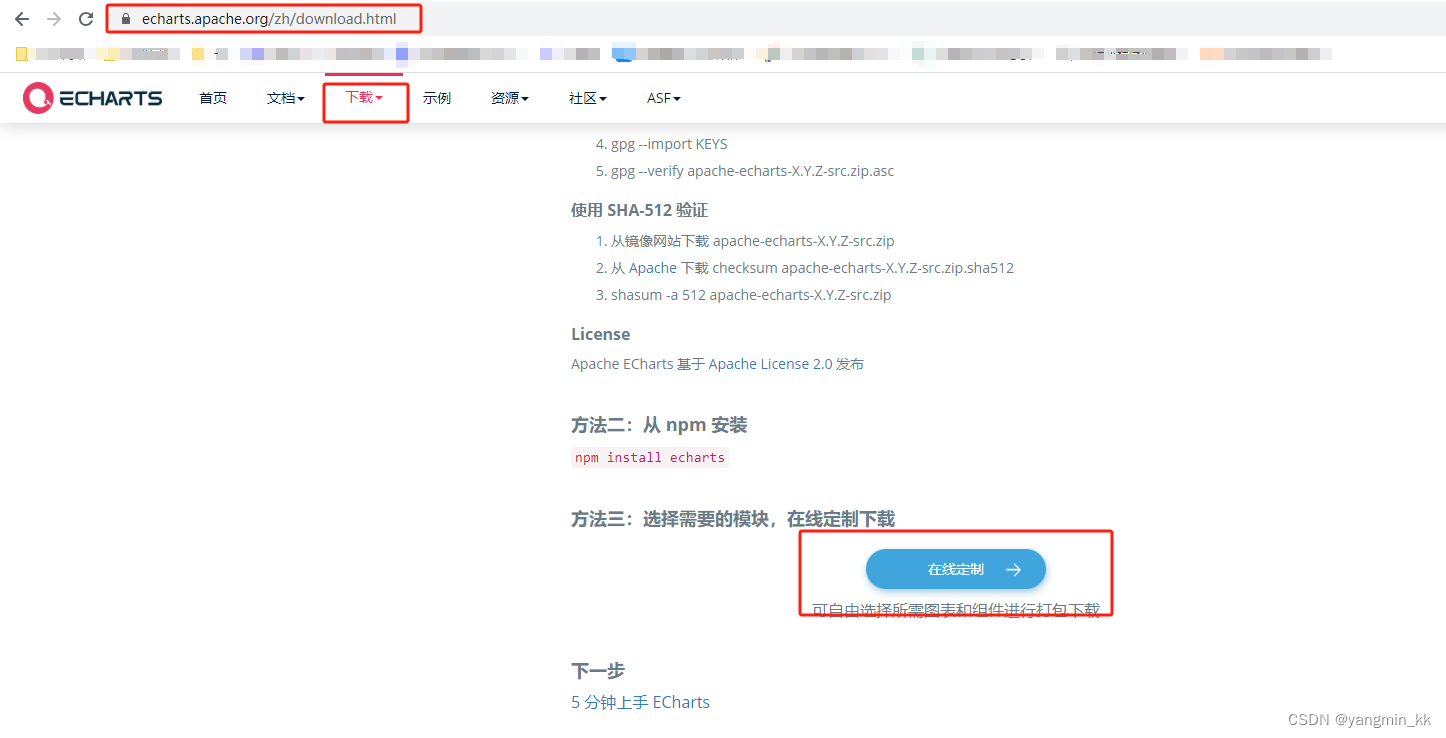
2.下载 - Apache ECharts官网点击左上角下载,然后定制生成一个echarts.min.js文件
用echarts.min.js文件替换上面下载的文件夹里面的echarts.js文件,然后一起放到根目录下
二.echarts的应用
1.js文件页面引入组件

2.js页面定义一下两个图表
三.实现代码
1.代码注意点
a.切换图表时需要隐藏另一个的图表

b.页面下滑时图表不动的bug,需要在外层加一层scroll-view
注:如果自定义了navBar,是把navBar之外的部分加上scroll-view。

2.wxml页面代码
<view class="statistics web-font">
  <scroll-view scroll-y="true" bindscroll="scroll" style="height: calc(100% - 140rpx);">
    <view style="padding-bottom: 100rpx;">
      <view class="second-step" style="box-shadow: 0 0 40rpx 0 {{mainColorShadow}};">
        <view class="title_view">
          <view class="selectTime">
            <view class="{{tab=='1'?'selected_style':''}}" bindtap="selectChart" data-id="1">访问趋势统计</view>
            <view class="{{tab=='2'?'selected_style':''}}" bindtap="selectChart" data-id="2">行为统计</view>
          </view>
        </view>
        <view class="range-style mar-top">
          <!-- 时间段 -->
          <view class="picker_group">
            <picker mode="date" value="{{startDate}}" end="{{endDate}}" bindcancel="deCancel" bindchange="bindDateChange">
              <view class="picker" bindtap="deChange">
                <image class="dateIcon" src="https://v.lawbal.com:9393/65,64350ad120b4b7.svg"></image>
                <text class="{{startDate=='开始日期'?'text-style1':'text-style2'}}">{{startDate}}</text>
              </view>
            </picker>
            <text class="text-style1">至</text>
            <picker mode="date" value="{{endDate}}" start="{{startDate}}" bindcancel="deCancel" bindchange="bindDateChange2">
              <view class="picker" bindtap="deChange">
                <image class="dateIcon" src="https://v.lawbal.com:9393/65,64350ad120b4b7.svg"></image>
                <text class="{{endDate=='结束日期'?'text-style1':'text-style2'}}">{{endDate}}</text>
              </view>
            </picker>
          </view>
        </view>
        <view class="hdenvirw">
          <view class="nodata_style container {{ !((barList.length==0&&tab=='2')||(lineList.length==0&&lineList2.length==0&&tab=='1'))? 'hide-canvas' : ''}}">
            <image src="{{noDataIcon}}"></image>
            <text>暂无数据</text>
          </view>
          <view class="container {{ (tab=='2'||isOpen||(lineList.length==0&&lineList2.length==0))? 'hide-canvas' : ''}}">
            <ec-canvas id="mychartline" canvas-id="mychartline" ec="{{ ec1 }}" force-use-old-canvas="{{true}}"></ec-canvas>
          </view>
          <view class="container {{ (tab=='1'||isOpen||(barList.length==0))? 'hide-canvas' : ''}}">
            <ec-canvas id="mychartbar" canvas-id="mychartbar" ec="{{ ec2 }}" force-use-old-canvas="{{true}}"></ec-canvas>
          </view>
        </view>
      </view>
    </view>
  </scroll-view>
</view>
3.js文件
var http = require('../../common/http.js')
const app = getApp()
import * as echarts from '../../ec-canvas/echarts.min';
function initChart(canvas, width, height) {
const chart = echarts.init(canvas, null, {
width: width,
height: height
});
canvas.setChart(chart);
return chart;
}
Page({
/**
* 页面的初始数据
*/
data: {
ec1: {
onInit: initChart
},
ec2: {
onInit: initChart
},
startDate: '', //(new Date().getFullYear()) + '-' + (new Date().getMonth() + 1) + '-' + (new Date().getDate()), //'开始日期', //默认起始时间
endDate: '', //'结束日期', //默认结束时间
imageWidth: 0,
staticData: [],
categories: [],
tab: '1',
canvasInfo: {},
dataList: [],
currenTab: '-1',
ws: true,
},
ready: function () {
},
/**
* 生命周期函数--监听页面加载
*/
onLoad(options) {
},
/**
* 生命周期函数--监听页面初次渲染完成
*/
onReady() {},
// 选择图表
selectChart(e) {
let tab = e.currentTarget.dataset.id
this.setData({
tab: tab,
})
if (tab === "1") {
this.getData()
}
if (tab === "2") {
this.getData2()
}
},
// 切换访问类型
selectCount(e) {
this.setData({
tabCount: e.currentTarget.dataset.id
})
},
// 访问趋势数据,折线图
getData() {
let that = this;
http.postData("", {
startDate: that.data.startDate,
endDate: that.data.endDate,
userId: wx.getStorageSync('userId'),
}, (function (t) {
that.setData({
currenTab: 1,
})
let xData = t.dataList ? t.dataList : []
let yData = t.viewList ? t.viewList : []
let ydata2 = t.userCount ? t.userCount : []
that.setData({
lineList: t.viewList ? t.viewList : [],
lineList2: t.userCount ? t.userCount : []
})
wx.nextTick(() => {
let chartDom = that.selectComponent('#mychartline')
if (chartDom) {
that.selectComponent('#mychartline').init((canvas, width, height) => {
const chart = initChart(canvas, width, height);
var option = {
title: {
text: ''
},
tooltip: {
trigger: 'axis'
},
grid: {
left: "30",
right: "10",
bottom: "40",
containlabel: true
},
legend: {
x: 'center', // 图例水平居中
y: 'top', // 图例垂直居下
},
toolbox: {
show: true,
feature: {
dataZoom: {
yAxisIndex: 'none'
},
dataView: {
readOnly: false
},
magicType: {
type: ['line', 'bar']
},
restore: {},
saveAsImage: {}
}
},
xAxis: {
type: 'category',
boundaryGap: false,
data: xData, //['Mon', 'Tue', 'Wed', 'Thu', 'Fri', 'Sat', 'Sun']
axisLabel: {
rotate: 45 // 将角度改成-45度,表示逆时针倾斜45度
}
},
yAxis: {
type: 'value',
minInterval : 1,
axisLabel: {
// formatter: '{value} °C'
},
data: yData
},
series: [{
name: '次数',
type: 'line',
data: ydata2,
itemStyle: {
normal: {
// 非渐变色,每条颜色单独设置
color: '#00B2A8'
},
},
markPoint: {
data: [{
type: 'max',
name: 'Max'
},
{
type: 'min',
name: 'Min'
}
]
},
markLine: {
data: [{
type: 'average',
name: 'Avg'
}]
}
},
{
name: '人数',
type: 'line',
data: yData,
itemStyle: {
normal: {
// 非渐变色,每条颜色单独设置
color: '#FF7C11'
},
},
markPoint: {
data: [{
name: '',
value: -2,
xAxis: 1,
yAxis: -1.5
}]
},
markLine: {
data: [{
type: '',
name: ''
},
[{
symbol: '',
x: '',
yAxis: ''
},
{
symbol: 'circle',
label: {
position: 'start',
formatter: 'Max'
},
type: 'max',
name: ''
}
]
]
}
}
]
}
chart.setOption(option);
wx.nextTick(() => {
chart.resize()
})
});
}
})
}), (function (e) {
wx.showToast({
title: e,
icon: 'none',
duration: 1500
})
}), true)
},
//行为统计数据,柱状图
getData2(e) {
debugger
let that = this
that.setData({
//e是首次加载默认tab为1;无e但tab有值就赋值;都没有就默认2
tab: e ? e : that.data.tab ? that.data.tab : '2'
})
console.log(that.data.tab)
http.postData("", {
startDate: that.data.startDate,
endDate: that.data.endDate,
userId: wx.getStorageSync('userId'),
}, (function (t) {
let list = t.userOperateStatics ? t.userOperateStatics : []
that.setData({
barList: list
})
let xData = []
let yData = []
list.forEach((element) => {
xData.push(element.operateTypeName);
yData.push(element.countNum);
});
wx.nextTick(() => {
let chartDom = that.selectComponent('#mychartbar')
if (chartDom) {
that.selectComponent('#mychartbar').init((canvas, width, height) => {
const chart = initChart(canvas, width, height);
const option = {
tooltip: {},
legend: {},
grid: {
left: "20",
right: "15%",
bottom: "0%",
top: "20",
},
xAxis: [{
show: false,
},
{
show: false,
},
],
yAxis: {
data: yData,
type: "category",
inverse: true,
show: false,
},
series: [{
show: true,
type: "bar",
barGap: "-100%",
barWidth: "8px",
showBackground: true, //柱状背景
backgroundStyle: {
//背景颜色,加透明度
color: "#ffffff",
},
z: 2,
itemStyle: {
normal: {
barBorderRadius: 4,
//渐变色
color: new echarts.graphic.LinearGradient(0, 0, 1, 1, [{
offset: 0,
color: '#5B9B8D'
},
{
offset: 1,
color: '#80C78C'
}
])
// 非渐变色,每条颜色单独设置
// color: function (params) {
// let colorList2 = ['#17908e', '#17908e', '#17908e', '#17908e']
// return colorList2[params.dataIndex];
// }
},
//鼠标悬停时:
emphasis: {
shadowBlur: 10,
shadowOffsetX: 0,
shadowColor: 'rgba(0, 0, 0, 0.5)'
},
},
label: {
show: true,
position: 'right'
},
emphasis: {
itemStyle: {
color: '#f00'
}
},
data: yData.map((item, index) => ({
value: item,
name: xData[index]
})),
},
{
show: true,
type: "bar",
xAxisIndex: 1, // 代表使用第二个X轴刻度
barGap: "-100%",
barWidth: 20,
itemStyle: {
normal: {
barBorderRadius: 200,
color: "transparent",
normal: {
barBorderRadius: 4,
//渐变色
color: new echarts.graphic.LinearGradient(0, 0, 1, 1, [{
offset: 0,
color: '#5B9B8D'
},
{
offset: 1,
color: '#80C78C'
}
])
// 非渐变色,每条颜色单独设置
// color: function (params) {
// let colorList2 = ['#17908e', '#17908e', '#17908e', '#17908e']
// return colorList2[params.dataIndex];
// }
},
},
},
label: {
normal: {
show: true,
position: [0, "-20"],
textStyle: {
fontSize: 12,
color: "#4a4a4a",
},
formatter: (data) => {
return xData[data.dataIndex];
},
},
},
data: yData.map((item, index) => ({
value: item,
name: xData[index]
})),
},
],
};
chart.setOption(option);
wx.nextTick(() => {
chart.resize()
})
});
}
})
}), (function (e) {
wx.showToast({
title: e,
icon: 'none',
duration: 1500
})
}), true)
},
/**
* 生命周期函数--监听页面显示
*/
onShow() {
let now = new Date();
let year = now.getFullYear();
let month = now.getMonth() + 1;
let date = now.getDate();
if (month < 10) {
month = "0" + month;
}
if (date < 10) {
date = "0" + date;
}
let currentDate = year + "-" + month + "-" + date
let last = new Date(new Date().getTime() - 1000 * 60 * 60 * 24 * 7)
let year2 = last.getFullYear();
let month2 = last.getMonth() + 1;
let date2 = last.getDate();
if (month2 < 10) {
month2 = "0" + month2;
}
if (date2 < 10) {
date2 = "0" + date2;
}
let lastDate = year2 + "-" + month2 + "-" + date2
if (this.data.startDate == '') {
this.setData({
startDate: lastDate
})
}
if (this.data.endDate == '') {
this.setData({
endDate: currentDate
})
}
if (wx.getStorageSync('userId')) {
this.getData()
this.getData2('1')
}
},
// 开始时间
bindDateChange(e) {
let that = this;
debugger
const date1 = new Date(e.detail.value);
const date2 = new Date(that.data.endDate);
if (date1.getFullYear() !== date2.getFullYear()) {
wx.showToast({
title: '日期不能跨年, 请重新选择!',
duration: 2000,
icon: 'none',
position: 'bottom'
})
return
} else {
that.setData({
startDate: e.detail.value,
})
that.getData()
that.getData2()
}
},
bindDateChange2(e) {
let that = this;
const date1 = new Date(e.detail.value);
const date2 = new Date(that.data.startDate);
if (date1.getFullYear() !== date2.getFullYear()) {
wx.showToast({
title: '日期不能跨年, 请重新选择!',
duration: 2000,
icon: 'none',
position: 'bottom'
})
return
} else {
that.setData({
endDate: e.detail.value,
})
that.getData()
that.getData2()
}
},
onPageScroll() {},
/**
* 生命周期函数--监听页面隐藏
*/
onHide() {
},
/**
* 生命周期函数--监听页面卸载
*/
onUnload() {
},
/**
* 页面相关事件处理函数--监听用户下拉动作
*/
onPullDownRefresh() {
},
/**
* 页面上拉触底事件的处理函数
*/
onReachBottom() {
},
/**
* 用户点击右上角分享
*/
onShareAppMessage() {
}
})4.json文件
{
  "navigationBarBackgroundColor": "#FFFFFF",
  "navigationStyle": "custom",
  "usingComponents": {
    "ec-canvas":"/ec-canvas/ec-canvas"
  }
}
5.wxss文件
.statistics {
  height: 100%;
  width: 100%;
  background-color: #F7F9F9;
  margin-bottom: 100rpx;
}

.back-nav-bar {
  height: 64rpx;
  width: 100vw;
  display: flex;
  flex-direction: row;
  justify-content: space-between;
  align-items: center;
  z-index: 999;
  position: relative;
}

.bg-op {
  position: absolute;
  width: 100%;
  bottom: 0;
  left: 0;
  /* background: linear-gradient(180deg, #C1CFE5 0%, #DEE4EE 100%); */
  background: #FFFFFF;
  z-index: -1;
}

.left-icon {
  width: 48rpx;
  height: 48rpx;
  margin-left: 20rpx;
}

.moreIcon {
  width: 40rpx;
  margin-top: 5px;
  height: 18.3rpx;
}

.icon {
  width: 48rpx;
  height: 48rpx;
  margin-right: 40rpx;
}

.left-icon image {
  display: block;
  width: 100%;
}

.title {
  font-size: 36rpx;
  color: #10272A;
  margin-left: 20rpx;
}

.title image {
  width: 40rpx;
  height: 40rpx;
}

.select_title {
  width: 100%;
  display: flex;
  justify-content: space-between;
  background-color: #FFFFFF;
  height: 140rpx;
  padding-top: 20rpx;
}

.select_view {
  width: 50%;
  text-align: center;
}

.select_view_left {
  border-right: .5px solid #D6E3E4;
  height: 60rpx;
  margin-top: 30rpx;
}

.select_view1 {
  color: #10272A;
  font-size: 48rpx;
  position: relative;
}

.select_view2 {
  color: #6F7383;
  font-size: 28rpx;
}

.second-step {
  padding: 28rpx;
  background: #fff;
  margin: 28rpx;
  border-radius: 16rpx;
}


.canvas {
  position: absolute;
  left: 0;
  top: 0;
  width: 100%;
  height: 100%;
  margin-bottom: 50rpx;
}

.container {
  width: 100%;
  height: 250px;
  position: relative;
}

.nodata_style {
  display: flex;
  flex-direction: column;
  align-items: center;
  top: 80rpx;
}

.nodata_style image {
  width: 40%;
  height: 40%;
}

.nodata_style text {
  color: #BCC0C8;
  padding-top: 20rpx;
}

.base_info {
  display: flex;
  padding: .3rem 0;
  width: 100%;
  align-items: center;
}

.back_imgs {
  height: 100rpx;
  width: 100rpx;
  border-radius: 50%;
  margin-right: 20rpx;
  vertical-align: middle;
}

.hide-canvas {
  display: none;
}

.title_view {
  display: flex;
  justify-content: space-between;
  height: 100rpx;
  line-height: 100rpx;
}

.title_view text {
  color: #10272A;
  font-size: 30rpx;
}

.selectTime {
  display: flex;
  width: 80%;
  height: 60rpx;
  line-height: 60rpx;
  font-size: 28rpx;
  color: #6F7383;
  background-color: #F7F9F9;
  margin-top: 22rpx;
  border-radius: 5px;
  margin-left: 10%;
}

.selectTime view {
  width: 50%;
  text-align: center;
}

.selected_style {
  background-color: #FFFFFF;
  color: #10272A;
  font-weight: 500;
  -webkit-box-shadow: 0 0 5px #e7e7e7;
  box-shadow: 0 0 5px #e7e7e7;
}

.tip_red {
  width: 54rpx;
  height: 28rpx;
  background-image: url("https://v.lawbal.com:9393/55,5bdcf5ce96010d.svg");
  background-repeat: no-repeat;
  color: #FFFFFF;
  font-size: 20rpx;
  position: absolute;
  right: 100rpx;
  top: 20rpx;
}

.ec-container {
  display: flex;
  flex-direction: column;
  align-items: center;
  justify-content: center;
  width: 100vw;
  height: 30vh;
}

ec-canvas {
  width: 100%;
  height: 100%;
}

.displayFlex {
  display: flex;
  justify-content: center;
  align-items: center;
}

.left_info {
  margin: 1rem;
  display: flex;
  color: #10272A;
  font-size: 42rpx;
  font-weight: 500;
  width: 80%;
}

.left_info view {
  display: flex;
  align-items: center;
}

.marginT130 {
  top: 100rpx;
  position: fixed;
  padding-top: 40rpx;
}


.displayFlex {
  display: flex;
  justify-content: center;
  align-items: center;
}


.access-switch {
  padding: .5rem 1rem;
  background: #f6f6f7;
  margin: 1rem;
  border-radius: 16rpx;
  border-radius: 8px;
  margin-top: 6rem;
  display: flex;
  justify-content: space-between;
  align-items: center;
}

.colorGreen {
  color: green;
}

.colorBlue {
  color: #17908E;
}

.browse_list_all {
  margin: 20rpx auto;
}

.browse_list {
  display: flex;
  justify-content: space-between;
  color: #10272A;
  font-size: 30rpx;
  line-height: 2;
}

.title_view2 {
  display: flex;
  justify-content: space-between;
}

.title_view2 text {
  color: #10272A;
  font-size: 30rpx;
}

.selectTime2 {
  display: flex;
  width: 100%;
  height: 120rpx;
  font-size: 26rpx;
  color: #6F7383;
  background-color: #F7F9F9;
  margin: 22rpx auto;
  border-radius: 5px;
}

.selectTime2_view {
  width: 100%;
  display: flex;
  flex-direction: column;
  align-items: center;
  text-align: center;
  justify-content: center;
  border-radius: 5px;
}

.selectTime2_text {
  font-size: 30rpx;
  color: #FFF !important;
  font-weight: 550;
}

.selectTime2_text2 {
  color: #10272A;
  font-size: 30rpx;
  font-weight: 550;
}

.selected_style2 {
  background-color: #FFFFFF;
  color: #FFFFFF;
  font-weight: 500;
  -webkit-box-shadow: 0 0 5px #e7e7e7;
  box-shadow: 0 0 5px #e7e7e7;
}

.range-style {
  /* display: flex;
  align-items: center;
  padding-left: 10rpx;
  background-color: #fff; */
}

.mar-top {
  margin-top: 30rpx;
}

.picker-title {
  /* font-size: 32rpx;
  width: 150rpx; */
}

.picker_group {
  color: #888;
  display: flex;
  align-items: center;
  justify-content: space-between;
  padding: 0 1rem 1rem 1rem;
}

.text-style1 {
  color: #A4A6AE;
  font-size: 0.9rem;
}

.text-style2 {
  color: #10272A;
}

.picker_group .picker {
  font-size: .9rem;
  height: 45rpx;
  line-height: 45rpx;
  display: flex;
  align-items: center;
  justify-content: center;
  text-align: center;
}

.dateIcon {
  width: 40rpx;
  height: 40rpx;
  padding-right: 10rpx;
}

.border_bottom {
  margin-bottom: 20rpx;
  border-bottom: .5px solid rgba(214, 227, 228, 0.5)
}


 439
439


 被折叠的 条评论
为什么被折叠?
被折叠的 条评论
为什么被折叠?
 到【灌水乐园】发言


