


jfreechart采用TimeSeriesChart并更改热点内容
作者同类文章
X
版权声明:本文为博主原创文章,未经博主允许不得转载。
- /**
- *
- */
- package com.huaxia.bank.test;
- import java.awt.Color;
- import java.awt.Dimension;
- import java.awt.Font;
- import java.awt.Toolkit;
- import java.awt.event.WindowAdapter;
- import java.awt.event.WindowEvent;
- import java.text.DateFormat;
- import java.text.DecimalFormat;
- import java.text.NumberFormat;
- import java.text.SimpleDateFormat;
- import org.jfree.chart.ChartFactory;
- import org.jfree.chart.ChartFrame;
- import org.jfree.chart.JFreeChart;
- import org.jfree.chart.axis.DateAxis;
- import org.jfree.chart.axis.DateTickUnit;
- import org.jfree.chart.axis.ValueAxis;
- import org.jfree.chart.labels.StandardCategoryToolTipGenerator;
- import org.jfree.chart.labels.StandardXYToolTipGenerator;
- import org.jfree.chart.labels.XYToolTipGenerator;
- import org.jfree.chart.plot.PlotOrientation;
- import org.jfree.chart.plot.XYPlot;
- import org.jfree.chart.renderer.xy.StandardXYItemRenderer;
- import org.jfree.chart.renderer.xy.XYItemRenderer;
- import org.jfree.chart.title.TextTitle;
- import org.jfree.data.time.Day;
- import org.jfree.data.time.Hour;
- import org.jfree.data.time.Month;
- import org.jfree.data.time.TimeSeries;
- import org.jfree.data.time.TimeSeriesCollection;
- import org.jfree.data.xy.XYDataset;
- import org.jfree.ui.ApplicationFrame;
- import org.jfree.ui.RectangleInsets;
- /**
- * @author cuiran
- *
- */
- public class TimeSeriesTest {
- public final static String MONTH = "MONTH";
- public final static String DAY = "DAY";
- public final static String HOUR = "HOUR";
- private JFreeChart rChart = null; //图表对象
- public String chartTitle = ""; //图表标题
- public String chartXdesc = ""; //X轴标题
- public String chartYdesc = ""; //Y轴标题
- public String chartSeriesDesc = ""; //曲线说明
- public String chartSeriesDesc1 = ""; //曲线说明
- public int graphWidth = 600; //默认宽度
- public int graphHigh = 400; //默认高度
- public String timeFormat = "MM/yyyy"; // 按日:MM-dd ,按小时:hh:mm
- // 用于标志用户选择的是按哪种查询统计周期类型(年、月、天、小时).
- // 年:YEAR, 月:MONTH, 天:DAY, 小时:HOUR
- public String periodType = "";
- // 用于确定时间间隔
- public int dateInterval = 1;
- //统计结果数据集
- TimeSeriesCollection statDataset = new TimeSeriesCollection();
- TimeSeries monthSeries = null; //月份统计图数据集合
- TimeSeries monthSeries1 = null; //月份统计图数据集合
- TimeSeries daySeries = null; //天数统计图数据集合
- TimeSeries hourSeries = null; //小时统计图数据集合
- public void createTread(){
- setTimeSeriesStatType();
- }
- /**
- * 创建趋势图表
- * @return JFreeChart 图表对象JFreeChart
- */
- private JFreeChart createTrendChart(){
- JFreeChart _freeChart = ChartFactory.createTimeSeriesChart(chartTitle, chartXdesc, chartYdesc,
- getTimeSeriesStatDataSet(), true, true, true);
- _freeChart.setBackgroundPaint(Color.white);
- XYPlot _xyplot = _freeChart.getXYPlot();
- _xyplot.setOrientation(PlotOrientation.VERTICAL);
- _xyplot.setBackgroundPaint(Color.lightGray);
- _xyplot.setDomainGridlinePaint(Color.white);
- _xyplot.setRangeGridlinePaint(Color.white);
- _xyplot.setAxisOffset(new RectangleInsets(1.0, 2.0, 2.0, 10.0));
- XYItemRenderer renderer= _xyplot.getRenderer();
- DateFormat df=new SimpleDateFormat("yyyy年MM月");
- NumberFormat nf= NumberFormat.getNumberInstance();
- StandardXYToolTipGenerator toolg=new StandardXYToolTipGenerator(StandardXYToolTipGenerator.DEFAULT_TOOL_TIP_FORMAT,df,nf);
- renderer.setToolTipGenerator(toolg);
- //
- DateAxis dateaxis = (DateAxis) _xyplot.getDomainAxis();
- if (periodType.equalsIgnoreCase("MONTH")){
- if (dateInterval > 0) {
- dateaxis.setTickUnit(new DateTickUnit(DateTickUnit.MONTH, dateInterval));
- }
- }else if (periodType.equalsIgnoreCase("DAY")){
- if (dateInterval > 0) {
- dateaxis.setTickUnit(new DateTickUnit(DateTickUnit.DAY, dateInterval));
- }
- }else if (periodType.equalsIgnoreCase("HOUR")){
- if (dateInterval > 0) {
- dateaxis.setTickUnit(new DateTickUnit(DateTickUnit.HOUR, dateInterval));
- }
- }
- dateaxis.setDateFormatOverride(new SimpleDateFormat(timeFormat));
- return _freeChart;
- }
- /**
- * 增加走势图数据
- * @param periodType 区间类型
- * @param year 年份
- * @param month 月份
- * @param day 日期
- * @param hour 时间
- * @param statData 统计数据
- */
- public void addTimeSeriesUnitData(int year, int month,int statData) {
- if (periodType.equalsIgnoreCase("MONTH")){
- if (monthSeries == null){
- monthSeries = new TimeSeries(chartSeriesDesc,Month.class);
- }
- monthSeries.add(new Month(month, year), statData);
- System.out.println("月");
- }else if (periodType.equalsIgnoreCase("DAY")){
- if (daySeries == null){
- daySeries = new TimeSeries(chartSeriesDesc, Day.class);
- }
- // daySeries.add(new Day(day, month, year), statData);
- }else if (periodType.equalsIgnoreCase("HOUR")){
- if (hourSeries == null){
- hourSeries = new TimeSeries(chartSeriesDesc, Hour.class);
- }
- // hourSeries.add(new Hour(hour, day, month, year), statData);
- }
- }
- /**
- * 增加走势图数据
- * @param periodType 区间类型
- * @param year 年份
- * @param month 月份
- * @param day 日期
- * @param hour 时间
- * @param statData 统计数据
- */
- public void addTimeSeriesUnitDataAll(int year, int month,int statData) {
- if (periodType.equalsIgnoreCase("MONTH")){
- if (monthSeries1 == null){
- monthSeries1 = new TimeSeries(chartSeriesDesc1,Month.class);
- }
- monthSeries1.add(new Month(month, year), statData);
- System.out.println("月");
- }else if (periodType.equalsIgnoreCase("DAY")){
- if (daySeries == null){
- daySeries = new TimeSeries(chartSeriesDesc1, Day.class);
- }
- // daySeries.add(new Day(day, month, year), statData);
- }else if (periodType.equalsIgnoreCase("HOUR")){
- if (hourSeries == null){
- hourSeries = new TimeSeries(chartSeriesDesc1, Hour.class);
- }
- // hourSeries.add(new Hour(hour, day, month, year), statData);
- }
- }
- /**
- * 设置走势图统计的区间类型
- * @param periodType 区间类型
- */
- private void setTimeSeriesStatType() {
- if (periodType.equalsIgnoreCase("MONTH")){
- statDataset.addSeries(monthSeries);
- statDataset.addSeries(monthSeries1);
- }else if (periodType.equalsIgnoreCase("DAY")){
- statDataset.addSeries(daySeries);
- }else if (periodType.equalsIgnoreCase("HOUR")){
- statDataset.addSeries(hourSeries);
- }
- }
- /**
- * 获得时序图的统计数据
- * @return XYDataset 统计数据
- */
- private XYDataset getTimeSeriesStatDataSet() {
- statDataset.setDomainIsPointsInTime(true);
- return statDataset;
- }
- public int getDateInterval() {
- return dateInterval;
- }
- //字体配置方法(解决中文问题)
- private static void configFont(JFreeChart chart) {
- // 配置字体
- Font xfont = new Font("宋体", Font.PLAIN, 12);// X轴
- Font yfont = new Font("宋体", Font.PLAIN, 12);// Y轴
- Font kfont = new Font("宋体", Font.PLAIN, 12);// 底部
- Font titleFont = new Font("宋体", Font.BOLD, 25); // 图片标题
- XYPlot plot = chart.getXYPlot();// 图形的绘制结构对象
- // 图片标题
- chart.setTitle(new TextTitle(chart.getTitle().getText(), titleFont));
- // 底部
- // chart.getLegend().setItemFont(kfont);
- // 横轴框里的标题字体
- chart.getLegend().setItemFont(kfont);
- // 横轴列表字体
- plot.getDomainAxis().setTickLabelFont(kfont);
- // 横轴小标题字体
- plot.getDomainAxis().setLabelFont(kfont);
- // Y 轴
- ValueAxis rangeAxis = plot.getRangeAxis();
- rangeAxis.setLabelFont(yfont);
- rangeAxis.setLabelPaint(Color.BLUE); // 字体颜色
- rangeAxis.setTickLabelFont(yfont);
- }
- public void setDateInterval(int dateInterval) {
- this.dateInterval = dateInterval;
- }
- public static void main(String arhs[]){
- TimeSeriesTest trendChart = new TimeSeriesTest();
- trendChart.chartTitle = "一年走势图";
- trendChart.chartSeriesDesc = "确认数量";
- trendChart.chartSeriesDesc1 = "风险数量";
- trendChart.chartXdesc = "月份";
- trendChart.chartYdesc = "数量";
- trendChart.graphHigh = 400;
- trendChart.graphWidth = 600;
- trendChart.timeFormat = "yyyy年MM月";
- trendChart.periodType = TimeSeriesTest.MONTH;
- double baseData = 100.0;
- double rData = baseData;
- trendChart.addTimeSeriesUnitData(2011, 11,25);
- trendChart.addTimeSeriesUnitData(2011, 12,45);
- trendChart.addTimeSeriesUnitData(2012, 1, 50);
- trendChart.addTimeSeriesUnitData(2012, 2, 80);
- trendChart.addTimeSeriesUnitData(2012, 3, 30);
- trendChart.addTimeSeriesUnitData(2012, 4, 10);
- trendChart.addTimeSeriesUnitDataAll(2011, 11,45);
- trendChart.addTimeSeriesUnitDataAll(2011, 12,65);
- trendChart.addTimeSeriesUnitDataAll(2012, 1, 70);
- trendChart.addTimeSeriesUnitDataAll(2012, 2, 90);
- trendChart.addTimeSeriesUnitDataAll(2012, 3, 50);
- trendChart.addTimeSeriesUnitDataAll(2012, 4, 40);
- trendChart.createTread();
- JFreeChart chart =trendChart.createTrendChart();
- trendChart.configFont(chart);
- final ChartFrame preview = new ChartFrame("一年走势图",chart);
- preview.addWindowListener(new WindowAdapter() {
- public void windowClosing(final WindowEvent event) {
- preview.dispose();
- }
- });
- preview.pack();
- //调整预览窗口的大小和位置,适合屏幕,并且居中
- // Dimension screenSize = Toolkit.getDefaultToolkit().getScreenSize();
- //
- // preview.setSize(screenSize.width,screenSize.height-50);//适合屏幕,50表示把工具栏要考虑在内
- //
- // Dimension frameSize = preview.getSize();
- //
- // if (frameSize.height > screenSize.height) {
- //
- // frameSize.height = screenSize.height;
- //
- // }
- //
- // if (frameSize.width > screenSize.width) {
- //
- // frameSize.width = screenSize.width;
- //
- // }
- //
- // preview.setLocation( (screenSize.width - frameSize.width) / 2,
- //
- // (screenSize.height - frameSize.height-50) / 2);
- //显示报表预览窗口
- preview.setVisible(true);
- }
- }
/**
 *
 */
package com.huaxia.bank.test;

import java.awt.Color;
import java.awt.Dimension;
import java.awt.Font;
import java.awt.Toolkit;
import java.awt.event.WindowAdapter;
import java.awt.event.WindowEvent;
import java.text.DateFormat;
import java.text.DecimalFormat;
import java.text.NumberFormat;
import java.text.SimpleDateFormat;

import org.jfree.chart.ChartFactory;
import org.jfree.chart.ChartFrame;
import org.jfree.chart.JFreeChart;
import org.jfree.chart.axis.DateAxis;
import org.jfree.chart.axis.DateTickUnit;
import org.jfree.chart.axis.ValueAxis;
import org.jfree.chart.labels.StandardCategoryToolTipGenerator;
import org.jfree.chart.labels.StandardXYToolTipGenerator;
import org.jfree.chart.labels.XYToolTipGenerator;
import org.jfree.chart.plot.PlotOrientation;
import org.jfree.chart.plot.XYPlot;
import org.jfree.chart.renderer.xy.StandardXYItemRenderer;
import org.jfree.chart.renderer.xy.XYItemRenderer;
import org.jfree.chart.title.TextTitle;
import org.jfree.data.time.Day;
import org.jfree.data.time.Hour;
import org.jfree.data.time.Month;
import org.jfree.data.time.TimeSeries;
import org.jfree.data.time.TimeSeriesCollection;
import org.jfree.data.xy.XYDataset;
import org.jfree.ui.ApplicationFrame;
import org.jfree.ui.RectangleInsets;

/**
 * @author cuiran
 *
 */
public class TimeSeriesTest  {

	  public final static String MONTH = "MONTH";
	  public final static String DAY = "DAY";
	  public final static String HOUR = "HOUR";

	  private JFreeChart rChart = null;     //图表对象
	  public String chartTitle = "";        //图表标题
	  public String chartXdesc = "";        //X轴标题
	  public String chartYdesc = "";        //Y轴标题
	  public String chartSeriesDesc = "";   //曲线说明
	  public String chartSeriesDesc1 = "";   //曲线说明
	  public int graphWidth = 600;          //默认宽度
	  public int graphHigh = 400;           //默认高度
	  public String timeFormat = "MM/yyyy"; // 按日:MM-dd ,按小时:hh:mm

	  // 用于标志用户选择的是按哪种查询统计周期类型(年、月、天、小时).
	  // 年:YEAR, 月:MONTH, 天:DAY, 小时:HOUR
	  public String periodType = "";

	  // 用于确定时间间隔
	  public int dateInterval = 1;

	  //统计结果数据集
	  TimeSeriesCollection statDataset = new TimeSeriesCollection();

	  TimeSeries monthSeries = null;  //月份统计图数据集合
	  TimeSeries monthSeries1 = null;  //月份统计图数据集合
	  TimeSeries daySeries = null;    //天数统计图数据集合
	  TimeSeries hourSeries = null;   //小时统计图数据集合


	  public void createTread(){
		    setTimeSeriesStatType();
	  }

	  /**
	   * 创建趋势图表
	   * @return JFreeChart 图表对象JFreeChart
	   */
	  private JFreeChart createTrendChart(){
	    JFreeChart _freeChart = ChartFactory.createTimeSeriesChart(chartTitle, chartXdesc, chartYdesc,
	        getTimeSeriesStatDataSet(), true, true, true);
	    _freeChart.setBackgroundPaint(Color.white);

	    XYPlot _xyplot = _freeChart.getXYPlot();

	    _xyplot.setOrientation(PlotOrientation.VERTICAL);

	    _xyplot.setBackgroundPaint(Color.lightGray);
	    _xyplot.setDomainGridlinePaint(Color.white);
	    _xyplot.setRangeGridlinePaint(Color.white);

	    _xyplot.setAxisOffset(new RectangleInsets(1.0, 2.0, 2.0, 10.0));
	   XYItemRenderer renderer= _xyplot.getRenderer();

	   DateFormat df=new SimpleDateFormat("yyyy年MM月");
	   NumberFormat nf= NumberFormat.getNumberInstance();
	   StandardXYToolTipGenerator toolg=new StandardXYToolTipGenerator(StandardXYToolTipGenerator.DEFAULT_TOOL_TIP_FORMAT,df,nf);

	   renderer.setToolTipGenerator(toolg);
//

	    DateAxis dateaxis = (DateAxis) _xyplot.getDomainAxis();
	    if (periodType.equalsIgnoreCase("MONTH")){
	      if (dateInterval > 0) {
	        dateaxis.setTickUnit(new DateTickUnit(DateTickUnit.MONTH, dateInterval));
	      }
	    }else if (periodType.equalsIgnoreCase("DAY")){
	      if (dateInterval > 0) {
	        dateaxis.setTickUnit(new DateTickUnit(DateTickUnit.DAY, dateInterval));
	      }
	    }else if (periodType.equalsIgnoreCase("HOUR")){
	      if (dateInterval > 0) {
	        dateaxis.setTickUnit(new DateTickUnit(DateTickUnit.HOUR, dateInterval));
	      }
	    }

	    dateaxis.setDateFormatOverride(new SimpleDateFormat(timeFormat));

	    return _freeChart;
	  }

	  /**
	   * 增加走势图数据
	   * @param periodType 区间类型
	   * @param year  年份
	   * @param month 月份
	   * @param day   日期
	   * @param hour  时间
	   * @param statData 统计数据
	   */
	  public void addTimeSeriesUnitData(int year, int month,int statData) {
	    if (periodType.equalsIgnoreCase("MONTH")){
	      if (monthSeries == null){
	        monthSeries = new TimeSeries(chartSeriesDesc,Month.class);
	      }
	      monthSeries.add(new Month(month, year), statData);

	      System.out.println("月");
	    }else if (periodType.equalsIgnoreCase("DAY")){
	      if (daySeries == null){
	        daySeries = new TimeSeries(chartSeriesDesc, Day.class);
	      }
//	      daySeries.add(new Day(day, month, year), statData);
	    }else if (periodType.equalsIgnoreCase("HOUR")){
	      if (hourSeries == null){
	        hourSeries = new TimeSeries(chartSeriesDesc, Hour.class);
	      }
//	      hourSeries.add(new Hour(hour, day, month, year), statData);
	    }
	  }
	  /**
	   * 增加走势图数据
	   * @param periodType 区间类型
	   * @param year  年份
	   * @param month 月份
	   * @param day   日期
	   * @param hour  时间
	   * @param statData 统计数据
	   */
	  public void addTimeSeriesUnitDataAll(int year, int month,int statData) {
	    if (periodType.equalsIgnoreCase("MONTH")){
	      if (monthSeries1 == null){
	    	  monthSeries1 = new TimeSeries(chartSeriesDesc1,Month.class);
	      }
	      monthSeries1.add(new Month(month, year), statData);

	      System.out.println("月");
	    }else if (periodType.equalsIgnoreCase("DAY")){
	      if (daySeries == null){
	        daySeries = new TimeSeries(chartSeriesDesc1, Day.class);
	      }
//	      daySeries.add(new Day(day, month, year), statData);
	    }else if (periodType.equalsIgnoreCase("HOUR")){
	      if (hourSeries == null){
	        hourSeries = new TimeSeries(chartSeriesDesc1, Hour.class);
	      }
//	      hourSeries.add(new Hour(hour, day, month, year), statData);
	    }
	  }
	  /**
	   * 设置走势图统计的区间类型
	   * @param periodType 区间类型
	   */
	  private void setTimeSeriesStatType() {
	    if (periodType.equalsIgnoreCase("MONTH")){
	      statDataset.addSeries(monthSeries);
	      statDataset.addSeries(monthSeries1);
	    }else if (periodType.equalsIgnoreCase("DAY")){
	      statDataset.addSeries(daySeries);
	    }else if (periodType.equalsIgnoreCase("HOUR")){
	      statDataset.addSeries(hourSeries);
	    }
	  }

	  /**
	   * 获得时序图的统计数据
	   * @return XYDataset 统计数据
	   */
	  private XYDataset getTimeSeriesStatDataSet() {
	    statDataset.setDomainIsPointsInTime(true);
	    return statDataset;
	  }

	  public int getDateInterval() {
	    return dateInterval;
	  }
	   //字体配置方法(解决中文问题)
	    private static void configFont(JFreeChart chart) {
	        // 配置字体
	        Font xfont = new Font("宋体", Font.PLAIN, 12);// X轴
	        Font yfont = new Font("宋体", Font.PLAIN, 12);// Y轴
	        Font kfont = new Font("宋体", Font.PLAIN, 12);// 底部
	        Font titleFont = new Font("宋体", Font.BOLD, 25); // 图片标题
	        XYPlot plot =  chart.getXYPlot();// 图形的绘制结构对象

	        // 图片标题
	        chart.setTitle(new TextTitle(chart.getTitle().getText(), titleFont));

	        // 底部
//	        chart.getLegend().setItemFont(kfont);
	     // 横轴框里的标题字体
	        chart.getLegend().setItemFont(kfont);
	        // 横轴列表字体
	        plot.getDomainAxis().setTickLabelFont(kfont);
	        // 横轴小标题字体
	        plot.getDomainAxis().setLabelFont(kfont);

	        // Y 轴
	        ValueAxis rangeAxis = plot.getRangeAxis();
	        rangeAxis.setLabelFont(yfont);
	        rangeAxis.setLabelPaint(Color.BLUE); // 字体颜色
	        rangeAxis.setTickLabelFont(yfont);

	    }
	  public void setDateInterval(int dateInterval) {
	    this.dateInterval = dateInterval;
	  }
	  public static void main(String arhs[]){
		  TimeSeriesTest trendChart = new TimeSeriesTest();
		  trendChart.chartTitle = "一年走势图";
		  trendChart.chartSeriesDesc = "确认数量";
		  trendChart.chartSeriesDesc1 = "风险数量";
		  trendChart.chartXdesc = "月份";
		  trendChart.chartYdesc = "数量";
		  trendChart.graphHigh = 400;
		  trendChart.graphWidth = 600;
		  trendChart.timeFormat = "yyyy年MM月";
		  trendChart.periodType = TimeSeriesTest.MONTH;

		  double baseData = 100.0;
		  double rData = baseData;

		  trendChart.addTimeSeriesUnitData(2011, 11,25);
		  trendChart.addTimeSeriesUnitData(2011, 12,45);
		  trendChart.addTimeSeriesUnitData(2012, 1, 50);
		  trendChart.addTimeSeriesUnitData(2012, 2,  80);
		  trendChart.addTimeSeriesUnitData(2012, 3, 30);
		  trendChart.addTimeSeriesUnitData(2012, 4,  10);

		  trendChart.addTimeSeriesUnitDataAll(2011, 11,45);
		  trendChart.addTimeSeriesUnitDataAll(2011, 12,65);
		  trendChart.addTimeSeriesUnitDataAll(2012, 1, 70);
		  trendChart.addTimeSeriesUnitDataAll(2012, 2,  90);
		  trendChart.addTimeSeriesUnitDataAll(2012, 3, 50);
		  trendChart.addTimeSeriesUnitDataAll(2012, 4, 40);


		  trendChart.createTread();
		  JFreeChart chart =trendChart.createTrendChart();
		  trendChart.configFont(chart);
		  final ChartFrame preview = new ChartFrame("一年走势图",chart);
		    preview.addWindowListener(new WindowAdapter() {

		         public void windowClosing(final WindowEvent event) {

		           preview.dispose();

		         }

		       });

		       preview.pack();

		       //调整预览窗口的大小和位置,适合屏幕,并且居中

//		       Dimension screenSize = Toolkit.getDefaultToolkit().getScreenSize();
//
//		       preview.setSize(screenSize.width,screenSize.height-50);//适合屏幕,50表示把工具栏要考虑在内
//
//		       Dimension frameSize = preview.getSize();
//
//		       if (frameSize.height > screenSize.height) {
//
//		         frameSize.height = screenSize.height;
//
//		       }
//
//		       if (frameSize.width > screenSize.width) {
//
//		         frameSize.width = screenSize.width;
//
//		       }
//
//		       preview.setLocation( (screenSize.width - frameSize.width) / 2,
//
//		                  (screenSize.height - frameSize.height-50) / 2);


		       //显示报表预览窗口

		       preview.setVisible(true);
	  }

}
运行效果如图:
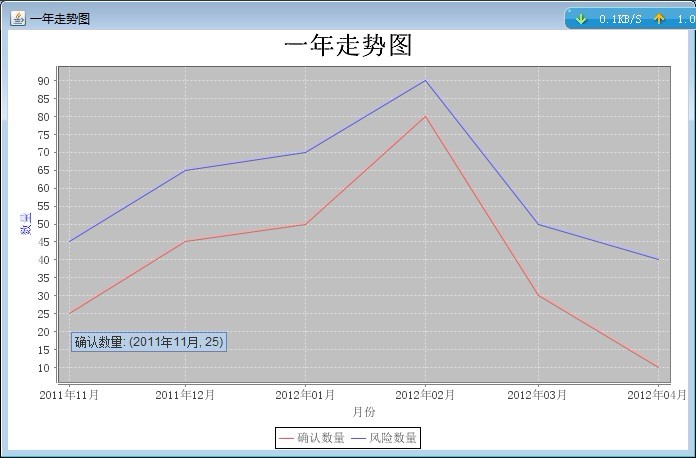
部分代码:
- DateFormat df=new SimpleDateFormat("yyyy年MM月");
- NumberFormat nf= NumberFormat.getNumberInstance();
- StandardXYToolTipGenerator toolg=new StandardXYToolTipGenerator(StandardXYToolTipGenerator.DEFAULT_TOOL_TIP_FORMAT,df,nf);
- renderer.setToolTipGenerator(toolg);
 DateFormat df=new SimpleDateFormat("yyyy年MM月");
	   NumberFormat nf= NumberFormat.getNumberInstance();
	   StandardXYToolTipGenerator toolg=new StandardXYToolTipGenerator(StandardXYToolTipGenerator.DEFAULT_TOOL_TIP_FORMAT,df,nf);

	   renderer.setToolTipGenerator(toolg);
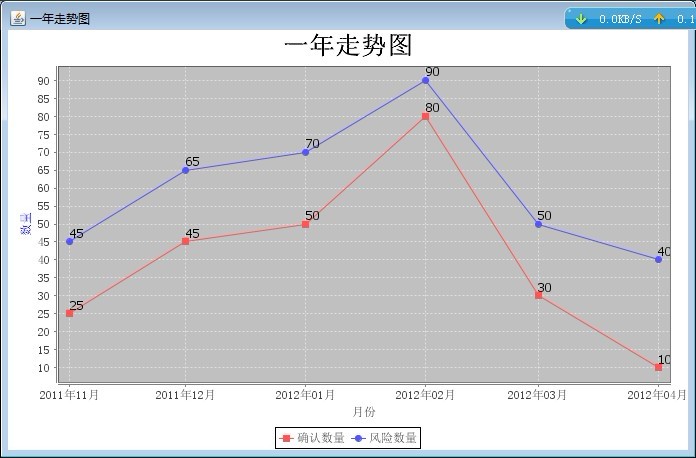
加上代码可以显示对应的图点
- XYLineAndShapeRenderer xylineandshaperenderer = (XYLineAndShapeRenderer)_xyplot.getRenderer();
- //设置网格背景颜色
- _xyplot.setBackgroundPaint(Color.white);
- //设置网格竖线颜色
- _xyplot.setDomainGridlinePaint(Color.pink);
- //设置网格横线颜色
- _xyplot.setRangeGridlinePaint(Color.pink);
- //设置曲线图与xy轴的距离
- _xyplot.setAxisOffset(new RectangleInsets(0D, 0D, 0D, 10D));
- //设置曲线是否显示数据点
- xylineandshaperenderer.setBaseShapesVisible(true);
- //设置曲线显示各数据点的值
   XYLineAndShapeRenderer xylineandshaperenderer = (XYLineAndShapeRenderer)_xyplot.getRenderer();
	  //设置网格背景颜色
	    _xyplot.setBackgroundPaint(Color.white);
	  //设置网格竖线颜色
	    _xyplot.setDomainGridlinePaint(Color.pink);
	  //设置网格横线颜色
	    _xyplot.setRangeGridlinePaint(Color.pink);
	  //设置曲线图与xy轴的距离
	    _xyplot.setAxisOffset(new RectangleInsets(0D, 0D, 0D, 10D));
	  //设置曲线是否显示数据点
	  xylineandshaperenderer.setBaseShapesVisible(true);
	  //设置曲线显示各数据点的值


 838
838

 被折叠的 条评论
为什么被折叠?
被折叠的 条评论
为什么被折叠?
 到【灌水乐园】发言


