echarts——实现自动轮播展示tooltips——技能提升

场景

最近在做
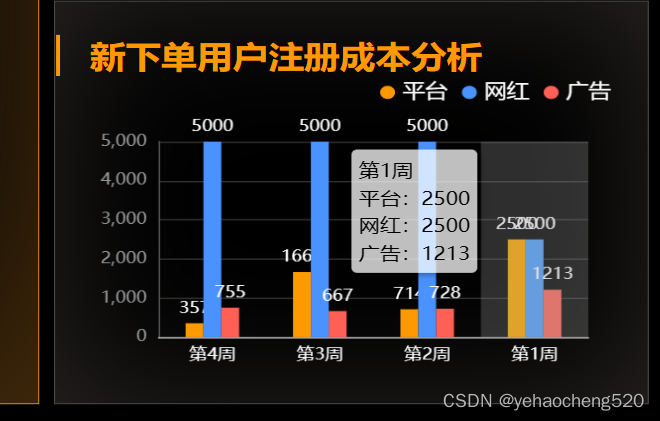
echarts看板的时候,经常会遇到下面的这种情况,给出的数值比较相近,所以在页面的展示上会出现重叠的情况。但是又无法保证数值能够有很大程度的分开。(如何数值有很大的分离,必须10以下,200以上这种的,就不会有这种问题出现)。

如果遇到这种数值相近的情况,则可以通过轮播展示tooltips的方式来处理:
在这里插入图片描述

1.轮播展示tooltips的方法

 //轮播tootip
this.timer = null;
function lunboEcharts(echartsId, dataLen,currentIndex=-1) {
    this.timer = setInterval(() => {
        echartsId.dispatchAction({
            type: 'downplay',
            seriesIndex: 0,
            dataIndex: currentIndex
        });
        currentIndex = (currentIndex + 1) % dataLen;
        echartsId.dispatchAction({
            type: 'highlight',
            seriesIndex: 0,
            dataIndex: currentIndex,
        });
        echartsId.dispatchAction({
            type: 'showTip',
            seriesIndex: 0,
            dataIndex: currentIndex
        });
    }, 3000)
}

2.封装的渲染图表的方法

//柱状图2
function GradientColumn2(id, xaxisData, yaxisData,flash=false) {
   var id = echarts.init(document.getElementById(id));
   let option = {
       legend: {
           x2: '20px',
           y: "0",
           itemWidth: 10,
           itemHeight: 10,
           icon: "circle",
           textStyle: { //图例文字的样式
               color: 'white',
               fontSize: 15
           },
       },
       tooltip: {
           trigger: "axis",
           axisPointer: {
               type: "shadow",
           },
           backgroundColor: "rgba(255,255,255,0.75)",
           extraCssText: "box-shadow: 2px 2px 4px 0px rgba(0,0,0,0.3);",
           textStyle: {
               fontSize: 14,
               color: "#000",
           },
           formatter: (params) => {
               var html = params[0].axisValue+'<br>';
               params.forEach((item,index)=>{
                   html += ''+item.seriesName+':'+item.value+'<br>';
               })
               return html;
           },
       },
       color: ["#4992FF", "#58D9F9", "#7CFFB2", "#f90"],
       grid: {
           x: 30,
           y: 50,
           x2: 40,
           y2: 30,
           containLabel: true,
       },
       xAxis: [
           {
               type: "category",
               axisLabel: {
                   interval: 0,
                   color: "#fff",
                   fontSize: 12,
               },
               axisLine: {
                   lineStyle: {
                       //y轴网格线设置
                       color: "#ccc",
                       width: 1,
                   },
               },

               axisTick: {
                   show: false,
               },
               data: xaxisData,
           },
       ],
       yAxis: [
           {
               name: '',
               type: "value",
               nameTextStyle: {
                   color: "#fff",
                   fontWeight: 400,
                   fontSize: 14,
               },
               axisTick: {
                   show: false,
               },
               axisLine: {
                   show: true,
                   lineStyle: {
                       color: "#555",
                       width: 1,
                   },
               },
               splitLine: {
                   show: true,
                   lineStyle: {
                       color: "#333",
                       width: 1,
                   },
               },
               axisLabel: {
                   show: true,
                   color: "#999",
                   fontSize: 12
               },
           },
       ],
       series: yaxisData,
   };
   id.setOption(option);
   if (flash) lunboEcharts(id, xaxisData.length)
   
}

3.鼠标移入移出时,禁止滚动的写法——在2步骤中添加以下代码:

//hover选中
      myChart.on('mouseover', (e) => {
        let currentIndex = e.dataIndex;
        clearInterval(this.timer);
        console.log('鼠标移入了', currentIndex, this.timer);
        myChart.dispatchAction({
          type: 'downplay',
          seriesIndex: 0,
          dataIndex: currentIndex,
        });
      });
      myChart.on('mouseout', (e) => {
        let currentIndex = e.dataIndex;
        clearInterval(this.timer);
        this.lunboEcharts(myChart, dataX.length, currentIndex);
        console.log('鼠标移出了', currentIndex);
      });

4.汇总:上面方法中的重点内容如下:

下面是自动轮播时,展示的内容结构:
在这里插入图片描述

tooltip: {
    trigger: "axis",
    axisPointer: {
        type: "shadow",
    },
    backgroundColor: "rgba(255,255,255,0.75)",
    extraCssText: "box-shadow: 2px 2px 4px 0px rgba(0,0,0,0.3);",
    textStyle: {
        fontSize: 14,
        color: "#000",
    },
    formatter: (params) => {
        var html = params[0].axisValue+'<br>';
        params.forEach((item,index)=>{
            html += ''+item.seriesName+':'+item.value+'<br>';
        })
        return html;
    },
},
  • 6
    点赞
  • 12
    收藏
    觉得还不错? 一键收藏
  • 打赏
    打赏
  • 3
    评论
实现echarts堆积图的tooltips位置自动轮播并且不能抄框,可以参考以下步骤: 1. 设置tooltip的trigger为'axis',表示显示x轴和y轴上的信息。 2. 设置tooltip的axisPointer类型为'shadow',表示显示阴影指示器。 3. 设置tooltip的position函数,根据鼠标位置自动调整显示位置,避免抄框。 4. 设置tooltip的formatter函数,根据堆积图的数据结构,显示相应的信息。 5. 使用setInterval函数实现tooltip位置的自动轮播,定时更新tooltip的位置。 以下是示例代码: ```javascript option = { tooltip: { trigger: 'axis', axisPointer: { type: 'shadow' }, position: function (point, params, dom, rect, size) { // 自动调整tooltip位置,避免抄框 var x = point[0]; var y = point[1]; var boxWidth = size.contentSize[0]; var boxHeight = size.contentSize[1]; var posX = 0; var posY = 0; if (x + boxWidth > rect.width) { posX = x - boxWidth; } else { posX = x; } if (y + boxHeight > rect.height) { posY = y - boxHeight; } else { posY = y; } return [posX, posY]; }, formatter: function (params) { // 根据堆积图数据结构,显示相应信息 var tooltipHtml = ''; for (var i = 0; i < params.length; i++) { var seriesName = params[i].seriesName; var value = params[i].value; tooltipHtml += seriesName + ': ' + value + '<br/>'; } return tooltipHtml; } }, xAxis: { type: 'category', data: ['Mon', 'Tue', 'Wed', 'Thu', 'Fri', 'Sat', 'Sun'] }, yAxis: { type: 'value' }, series: [{ name: 'A', type: 'bar', stack: 'stack1', data: [120, 132, 101, 134, 90, 230, 210] }, { name: 'B', type: 'bar', stack: 'stack1', data: [220, 182, 191, 234, 290, 330, 310] }, { name: 'C', type: 'bar', stack: 'stack1', data: [150, 232, 201, 154, 190, 330, 410] }] }; // 自动轮播tooltip位置 var index = 0; var intervalId = setInterval(function () { var chart = echarts.getInstanceByDom(document.getElementById('chart')); var option = chart.getOption(); var params = option.series[0].data; var length = params.length; index = (index + 1) % length; chart.dispatchAction({ type: 'showTip', seriesIndex: 0, dataIndex: index }); }, 2000); ``` 其中,setInterval函数每2秒钟自动更新tooltip位置,实现自动轮播效果。如果需要停止自动轮播,可以使用clearInterval函数清除intervalId。

“相关推荐”对你有帮助么?

  • 非常没帮助
  • 没帮助
  • 一般
  • 有帮助
  • 非常有帮助
提交
评论 3
添加红包

请填写红包祝福语或标题

红包个数最小为10个

红包金额最低5元

当前余额3.43前往充值 >
需支付:10.00
成就一亿技术人!
领取后你会自动成为博主和红包主的粉丝 规则
hope_wisdom
发出的红包

打赏作者

叶浩成520

你的鼓励将是我创作的最大动力

¥1 ¥2 ¥4 ¥6 ¥10 ¥20
扫码支付:¥1
获取中
扫码支付

您的余额不足,请更换扫码支付或充值

打赏作者

实付
使用余额支付
点击重新获取
扫码支付
钱包余额 0

抵扣说明:

1.余额是钱包充值的虚拟货币,按照1:1的比例进行支付金额的抵扣。
2.余额无法直接购买下载,可以购买VIP、付费专栏及课程。

余额充值