


图形分解
要想绘制出漂亮的图表,就必须了解图表的构成部分,将图表进行分解成N个部分。
JfreeChart 中文API
--------------------------------
要想绘制出漂亮的图表,就必须了解图表的构成部分,将图表进行分解成N个部分。
然后再对每一个部分进行渲染,设置样式:包括背景色、轮廓线条样式和颜色、填充颜色、字体大小、样式、颜色。
同时,需要确保在整个项目中,图表的样式风格整体统一。
统一,和谐才能打造漂亮、干净、专业的外观.
--------------------------------
1
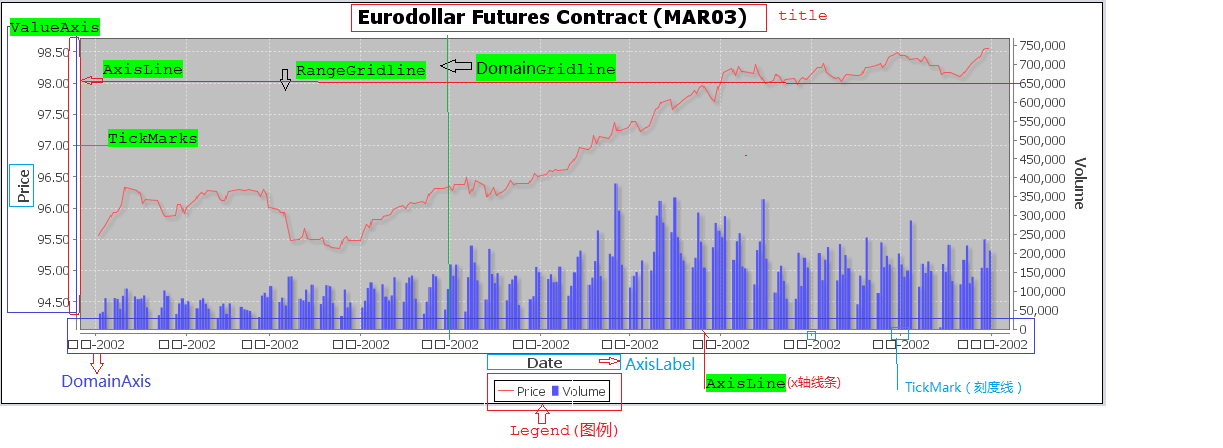
-图表组成部门
整个图表-JFreeChart
图表绘制区域(图表轮廓内部称之为绘制区域)-Plot
标题-Title
副标题-Subtitle
X坐标轴-DomainAxis
Y坐标轴-RangeAxis(ValueAxis)
X坐标轴标题-DomainAxis.AxisLabel
Y坐标轴标题-RangeAxis(ValueAxis).AxisLabel
X坐标轴水平线DomainAxis.AxisLine
Y坐标轴水平线RangeAxis(ValueAxis)AxisLine
X坐标轴标尺值DomainAxis.TickLabel
Y坐标轴标尺值RangeAxis(ValueAxis).TickLabel
X坐标轴标尺竖线DomainAxis.TickMark
Y坐标轴标尺水平线RangeAxis(ValueAxis).TickMark
垂直数据轴网格线:DomainGridlines
水平数据轴网格线:RangeGridlines
标注-Legend
绘制图形的步骤:
1
-创建数据集合,然后根据数据创建JfreeChart
2
-chart.setTextAntiAlias(
false
);
//必须设置文本抗锯齿为false,防止乱码
3
-对图表进行渲染
4
-修改X-Y轴;标注,图表样式
5
-创建ChartPanel;chartPanel =
new
ChartPanel(chart);
--------------------------------
2
-主题样式
JfreeChart主题样式有StandardChartTheme进行统一管理,包括字体,绘制颜色,线条类型,坐标轴样式等!
private
static
Font FONT =
new
Font(
"宋体"
, Font.PLAIN,
12
);
// 设置中文主题样式 解决乱码
StandardChartTheme chartTheme =
new
StandardChartTheme(
"CN"
);
// 设置标题字体
chartTheme.setExtraLargeFont(FONT);
// 设置图例的字体
chartTheme.setRegularFont(FONT);
// 设置轴向的字体
chartTheme.setLargeFont(FONT);
chartTheme.setSmallFont(FONT);
chartTheme.setTitlePaint(
new
Color(
51
,
51
,
51
));
//Paint 可以理解为绘制颜色;标题字体颜色
chartTheme.setSubtitlePaint(
new
Color(
85
,
85
,
85
));
//副标题字体颜色
chartTheme.setLegendBackgroundPaint(Color.WHITE);
// 设置标注背景色
chartTheme.setLegendItemPaint(Color.BLACK);
//设置字体颜色
chartTheme.setChartBackgroundPaint(Color.WHITE);
//图表背景色
// 绘制颜色绘制颜色.轮廓供应商
// paintSequence,outlinePaintSequence,strokeSequence,outlineStrokeSequence,shapeSequence
Paint[] OUTLINE_PAINT_SEQUENCE =
new
Paint[] { Color.WHITE };
//外边框线条颜色
//绘制器颜色源-所有线条 饼图 默认颜色都是来自DefaultDrawingSupplier
DefaultDrawingSupplier drawingSupplier =
new
DefaultDrawingSupplier(CHART_COLORS, CHART_COLORS, OUTLINE_PAINT_SEQUENCE,
DefaultDrawingSupplier.DEFAULT_STROKE_SEQUENCE, DefaultDrawingSupplier.DEFAULT_OUTLINE_STROKE_SEQUENCE,
DefaultDrawingSupplier.DEFAULT_SHAPE_SEQUENCE);
chartTheme.setDrawingSupplier(drawingSupplier);
//设置绘制颜色、线条、外边框供应商
chartTheme.setPlotBackgroundPaint(Color.WHITE);
// 绘制区域背景色
chartTheme.setPlotOutlinePaint(Color.WHITE);
// 绘制区域外边框
chartTheme.setLabelLinkPaint(
new
Color(
8
,
55
,
114
));
// 链接标签颜色
chartTheme.setLabelLinkStyle(PieLabelLinkStyle.CUBIC_CURVE);
chartTheme.setAxisOffset(
new
RectangleInsets(
5
,
12
,
5
,
12
));
//设置X-Y坐标轴偏移量
chartTheme.setDomainGridlinePaint(
new
Color(
192
,
208
,
224
));
// X坐标轴垂直网格颜色
chartTheme.setRangeGridlinePaint(
new
Color(
192
,
192
,
192
));
// Y坐标轴水平网格颜色
chartTheme.setBaselinePaint(Color.WHITE);
chartTheme.setCrosshairPaint(Color.BLUE);
// 不确定含义
chartTheme.setAxisLabelPaint(
new
Color(
51
,
51
,
51
));
// 坐标轴标题文字颜色
chartTheme.setTickLabelPaint(
new
Color(
67
,
67
,
72
));
// 刻度数字颜色
chartTheme.setBarPainter(
new
StandardBarPainter());
// 设置柱状图渲染问哦基本渲染,不采用渐变
chartTheme.setXYBarPainter(
new
StandardXYBarPainter());
// XYBar 渲染,值使用颜色渲染,不采用渐变
chartTheme.setItemLabelPaint(Color.black);
chartTheme.setThermometerPaint(Color.white);
// 温度计
ChartFactory.setChartTheme(chartTheme);
//设置主题样式
--------------------------------
3
-API描述;对每一个部分进行样式控制,只涉及重要API!
JFreeChart类:图标对象,任何类型的图标的最终表现形式都是在该对象上进行一些属性的定制。
JFreeChart引擎本身提供了一个工厂类用于创建不同类型的图表对象。
void
setAntiAlias(
boolean
flag) 设置字体抗锯齿,必须关闭字体抗锯齿,否则文字显示非常模糊:用法chart.setTextAntiAlias(
false
);
void
setBorderPaint(Paint paint) 边界线条颜色
void
setBorderStroke(Stroke stroke) 边界线条笔触
void
setBorderVisible(
boolean
visible) 边界线条是否可见
--------------------------------
标题
TextTitle类:
void
setFont(Font font) 标题字体
void
setPaint(Paint paint) 标题字体颜色
void
setText(String text) 标题内容
--------------------------------
StandardLegend(Legend)类:
void
setBackgroundPaint(Paint paint) 图示背景色
void
setTitle(String title) 图示标题内容
void
setTitleFont(Font font) 图示标题字体
void
setOutlinePaint(Paint paint) 图示边界线条颜色
void
setOutlineStroke(Stroke stroke) 图示边界线条笔触
void
setDisplaySeriesLines(
boolean
flag) 图示项是否显示横线(折线图有效)
void
setDisplaySeriesShapes(
boolean
flag) 图示项是否显示形状(折线图有效)
void
setItemFont(Font font) 图示项字体
void
setItemPaint(Paint paint) 图示项字体颜色
void
setAnchor(
int
anchor) 图示在图表中的显示位置(参数常量在Legend类中定义)
--------------------------------
X轴
Axis类:用于处理图表的两个轴,即纵轴和横轴。
void
setVisible(
boolean
flag) 坐标轴是否可见
void
setAxisLinePaint(Paint paint) 坐标轴线条颜色(3D轴无效)
void
setAxisLineStroke(Stroke stroke) 坐标轴线条笔触(3D轴无效)
void
setAxisLineVisible(
boolean
visible) 坐标轴线条是否可见(3D轴无效)
void
setFixedDimension(
double
dimension) (用于复合表中对多坐标轴的设置)
void
setLabel(String label) 坐标轴标题
void
setLabelFont(Font font) 坐标轴标题字体
void
setLabelPaint(Paint paint) 坐标轴标题颜色
void
setLabelAngle(
double
angle)` 坐标轴标题旋转角度(纵坐标可以旋转)
void
setTickLabelFont(Font font) 坐标轴标尺值字体
void
setTickLabelPaint(Paint paint) 坐标轴标尺值颜色
void
setTickLabelsVisible(
boolean
flag) 坐标轴标尺值是否显示
void
setTickMarkPaint(Paint paint) 坐标轴标尺颜色
void
setTickMarkStroke(Stroke stroke) 坐标轴标尺笔触
void
setTickMarksVisible(
boolean
flag) 坐标轴标尺是否显示
--------------------------------
Y轴
ValueAxis(Axis)类:
void
setAutoRange(
boolean
auto) 自动设置数据轴数据范围
void
setAutoRangeMinimumSize(
double
size) 自动设置数据轴数据范围时数据范围的最小跨度
void
setAutoTickUnitSelection(
boolean
flag) 数据轴的数据标签是否自动确定(默认为
true
)
void
setFixedAutoRange(
double
length) 数据轴固定数据范围(设置
100
的话就是显示MAXVALUE到MAXVALUE-
100
那段数据范围)
void
setInverted(
boolean
flag) 数据轴是否反向(默认为
false
)
void
setLowerMargin(
double
margin) 数据轴下(左)边距
void
setUpperMargin(
double
margin) 数据轴上(右)边距
void
setLowerBound(
double
min) 数据轴上的显示最小值
void
setUpperBound(
double
max) 数据轴上的显示最大值
void
setPositiveArrowVisible(
boolean
visible) 是否显示正向箭头(3D轴无效)
void
setNegativeArrowVisible(
boolean
visible) 是否显示反向箭头(3D轴无效)
void
setVerticalTickLabels(
boolean
flag) 数据轴数据标签是否旋转到垂直
void
setStandardTickUnits(TickUnitSource source) 数据轴的数据标签(可以只显示整数标签,需要将AutoTickUnitSelection设
false
)
--------------------------------
NumberAxis(ValueAxis)类:
void
setAutoRangeIncludesZero(
boolean
flag) 是否强制在自动选择的数据范围中包含
0
void
setAutoRangeStickyZero(
boolean
flag) 是否强制在整个数据轴中包含
0
,即使
0
不在数据范围中
void
setNumberFormatOverride(NumberFormat formatter) 数据轴数据标签的显示格式
void
setTickUnit(NumberTickUnit unit) 数据轴的数据标签(需要将AutoTickUnitSelection设
false
)
--------------------------------
X 日期轴
DateAxis(ValueAxis)类:
void
setMaximumDate(Date maximumDate) 日期轴上的最小日期
void
setMinimumDate(Date minimumDate) 日期轴上的最大日期
void
setRange(Date lower,Date upper) 日期轴范围
void
setDateFormatOverride(DateFormat formatter) 日期轴日期标签的显示格式
void
setTickUnit(DateTickUnit unit) 日期轴的日期标签(需要将AutoTickUnitSelection设
false
)
void
setTickMarkPosition(DateTickMarkPosition position) 日期标签位置(参数常量在org.jfree.chart.axis.DateTickMarkPosition类中定义)
--------------------------------
CategoryAxis(Axis)类:
void
setCategoryMargin(
double
margin) 分类轴边距
void
setLowerMargin(
double
margin) 分类轴下(左)边距
void
setUpperMargin(
double
margin) 分类轴上(右)边距
void
setVerticalCategoryLabels(
boolean
flag) 分类轴标题是否旋转到垂直
void
setMaxCategoryLabelWidthRatio(
float
ratio) 分类轴分类标签的最大宽度
--------------------------------
绘制区域:
Plot类:图标区域对象,基本上这个对象决定着图表的样式,创建该对象时需要Axis,Renderer及数据集对象的支持。
void
setBackgroundImage(Image image) 数据区的背景图片
void
setBackgroundImageAlignment(
int
alignment) 数据区的背景图片对齐方式(参数常量在org.jfree.ui.Align类中定义)
void
setBackgroundPaint(Paint paint) 数据区的背景图片背景色
void
setBackgroundAlpha(
float
alpha) 数据区的背景透明度(
0.0
~
1.0
)
void
setForegroundAlpha(
float
alpha) 数据区的前景透明度(
0.0
~
1.0
)
void
setDataAreaRatio(
double
ratio) 数据区占整个图表区的百分比
void
setOutLinePaint(Paint paint) 数据区的边界线条颜色
void
setOutLineStroke(Stroke stroke) 数据区的边界线条笔触
void
setNoDataMessage(String message) 没有数据时显示的消息
void
setNoDataMessageFont(Font font) 没有数据时显示的消息字体
void
setNoDataMessagePaint(Paint paint) 没有数据时显示的消息颜色
--------------------------------
CategoryPlot(Plot)类:
void
setDataset(CategoryDataset dataset) 数据区的
2
维数据表
void
setColumnRenderingOrder(SortOrder order) 数据分类的排序方式
void
setAxisOffset(Spacer offset) 坐标轴到数据区的间距
void
setOrientation(PlotOrientation orientation) 数据区的方向(PlotOrientation.HORIZONTAL或PlotOrientation.VERTICAL)
void
setDomainAxis(CategoryAxis axis) 数据区的分类轴
void
setDomainAxisLocation(AxisLocation location) 分类轴的位置(参数常量在org.jfree.chart.axis.AxisLocation类中定义)
void
setDomainGridlinesVisible(
boolean
visible) 垂直方向:分类轴网格是否可见
void
setDomainGridlinePaint(Paint paint) 分类轴网格线条颜色
void
setDomainGridlineStroke(Stroke stroke) 分类轴网格线条笔触
void
setRangeAxis(ValueAxis axis) 数据区的数据轴
void
setRangeAxisLocation(AxisLocation location) 数据轴的位置(参数常量在org.jfree.chart.axis.AxisLocation类中定义)
void
setRangeGridlinesVisible(
boolean
visible) 数据轴网格是否可见
void
setRangeGridlinePaint(Paint paint) 数据轴网格线条颜色
void
setRangeGridlineStroke(Stroke stroke) 数据轴网格线条笔触
void
setRenderer(CategoryItemRenderer renderer) 数据区的表示者(详见Renderer组)
void
addAnnotation(CategoryAnnotation annotation) 给数据区加一个注释
void
addRangeMarker(Marker marker,Layer layer) 给数据区加一个数值范围区域
--------------------------------
PiePlot(Plot)类:
void
setDataset(PieDataset dataset) 数据区的
1
维数据表
void
setIgnoreNullValues(
boolean
flag) 忽略无值的分类
void
setCircular(
boolean
flag) 饼图是否一定是正圆
void
setStartAngle(
double
angle) 饼图的初始角度
void
setDirection(Rotation direction) 饼图的旋转方向
void
setExplodePercent(
int
section,
double
percent) 抽取的那块(
1
维数据表的分类下标)以及抽取出来的距离(
0.0
~
1.0
),3D饼图无效
void
setLabelBackgroundPaint(Paint paint) 分类标签的底色
void
setLabelFont(Font font) 分类标签的字体
void
setLabelPaint(Paint paint) 分类标签的字体颜色
void
setLabelLinkMargin(
double
margin) 分类标签与图的连接线边距
void
setLabelLinkPaint(Paint paint) 分类标签与图的连接线颜色
void
setLabelLinkStroke(Stroke stroke) 分类标签与图的连接线笔触
void
setLabelOutlinePaint(Paint paint) 分类标签边框颜色
void
setLabelOutlineStroke(Paint paint) 分类标签边框笔触
void
setLabelShadowPaint(Paint paint) 分类标签阴影颜色
void
setMaximumLabelWidth(
double
width) 分类标签的最大长度(
0.0
~
1.0
)
void
setPieIndex(
int
index) 饼图的索引(复合饼图中用到)
void
setSectionOutlinePaint(
int
section,Paint paint) 指定分类饼的边框颜色
void
setSectionOutlineStroke(
int
section,Stroke stroke) 指定分类饼的边框笔触
void
setSectionPaint(
int
section,Paint paint) 指定分类饼的颜色
void
setShadowPaint(Paint paint) 饼图的阴影颜色
void
setShadowXOffset(
double
offset) 饼图的阴影相对图的水平偏移
void
setShadowYOffset(
double
offset) 饼图的阴影相对图的垂直偏移
void
setLabelGenerator(PieSectionLabelGenerator generator) 分类标签的格式,设置成
null
则整个标签包括连接线都不显示
void
setToolTipGenerator(PieToolTipGenerator generator) MAP中鼠标移上的显示格式
void
setURLGenerator(PieURLGenerator generator) MAP中钻取链接格式
--------------------------------
PiePlot3D(PiePlot)类:
void
setDepthFactor(
double
factor) 3D饼图的Z轴高度(
0.0
~
1.0
)
MultiplePiePlot(Plot)类:
void
setLimit(
double
limit) 每个饼图之间的数据关联(详细比较复杂)
void
setPieChart(JFreeChart pieChart) 每个饼图的显示方式(见JFreeChart类个PiePlot类)
--------------------------------
渲染 Render
AbstractRenderer类:负责如何显示一个图表对象
void
setItemLabelAnchorOffset(
double
offset) 数据标签的与数据点的偏移
void
setItemLabelsVisible(
boolean
visible) 数据标签是否可见
void
setItemLabelFont(Font font) 数据标签的字体
void
setItemLabelPaint(Paint paint) 数据标签的字体颜色
void
setItemLabelPosition(ItemLabelPosition position) 数据标签位置
void
setPositiveItemLabelPosition(ItemLabelPosition position) 正数标签位置
void
setNegativeItemLabelPosition(ItemLabelPosition position) 负数标签位置
void
setOutLinePaint(Paint paint) 图形边框的线条颜色
void
setOutLineStroke(Stroke stroke) 图形边框的线条笔触
void
setPaint(Paint paint) 所有分类图形的颜色
void
setShape(Shape shape) 所有分类图形的形状(如折线图的点)
void
setStroke(Stroke stroke) 所有分类图形的笔触(如折线图的线)
void
setSeriesItemLabelsVisible(
int
series,
boolean
visible) 指定分类的数据标签是否可见
void
setSeriesItemLabelFont(
int
series,Font font) 指定分类的数据标签的字体
void
setSeriesItemLabelPaint(
int
series,Paint paint) 指定分类的数据标签的字体颜色
void
setSeriesItemLabelPosition(
int
series,ItemLabelPosition position) 数据标签位置
void
setSeriesPositiveItemLabelPosition(
int
series,ItemLabelPosition position) 正数标签位置
void
setSeriesNegativeItemLabelPosition(
int
series,ItemLabelPosition position) 负数标签位置
void
setSeriesOutLinePaint(
int
series,Paint paint) 指定分类的图形边框的线条颜色
void
setSeriesOutLineStroke(
int
series,Stroke stroke) 指定分类的图形边框的线条笔触
void
setSeriesPaint(
int
series,Paint paint) 指定分类图形的颜色
void
setSeriesShape(
int
series,Shape shape) 指定分类图形的形状(如折线图的点)
void
setSeriesStroke(
int
series,Stroke stroke) 指定分类图形的笔触(如折线图的线)
--------------------------------
AbstractCategoryItemRenderer(AbstractRenderer)类:
void
setLabelGenerator(CategoryLabelGenerator generator) 数据标签的格式
void
setToolTipGenerator(CategoryToolTipGenerator generator) MAP中鼠标移上的显示格式
void
setItemURLGenerator(CategoryURLGenerator generator) MAP中钻取链接格式
void
setSeriesLabelGenerator(
int
series,CategoryLabelGenerator generator) 指定分类的数据标签的格式
void
setSeriesToolTipGenerator(
int
series,CategoryToolTipGenerator generator) 指定分类的MAP中鼠标移上的显示格式
void
setSeriesItemURLGenerator(
int
series,CategoryURLGenerator generator) 指定分类的MAP中钻取链接格式
--------------------------------
柱状图渲染
BarRenderer(AbstractCategoryItemRenderer)类:
void
setDrawBarOutline(
boolean
draw) 是否画图形边框
void
setItemMargin(
double
percent) 每个BAR之间的间隔(
0
-
1
)
void
setMaxBarWidth(
double
percent) 每个BAR的最大宽度(
0
-
1
)
void
setMinimumBarLength(
double
min) 最短的BAR长度,避免数值太小而显示不出
void
setPositiveItemLabelPositionFallback(ItemLabelPosition position) 无法在BAR中显示的正数标签位置
void
setNegativeItemLabelPositionFallback(ItemLabelPosition position) 无法在BAR中显示的负数标签位置
BarRenderer3D(BarRenderer)类:
void
setWallPaint(Paint paint) 3D坐标轴的墙体颜色
--------------------------------
//堆积柱状图渲染
StackedBarRenderer(BarRenderer)类:
没有特殊的设置
StackedBarRenderer3D(BarRenderer3D)类:
没有特殊的设置
--------------------------------
GroupedStackedBarRenderer(StackedBarRenderer)类:
void
setSeriesToGroupMap(KeyToGroupMap map) 将分类自由的映射成若干个组(KeyToGroupMap.mapKeyToGroup(series,group))
LayeredBarRenderer(BarRenderer)类:
void
setSeriesBarWidth(
int
series,
double
width) 设定每个分类的宽度(注意设置不要使某分类被覆盖)
--------------------------------
//瀑布流图渲染图
WaterfallBarRenderer(BarRenderer)类:
void
setFirstBarPaint(Paint paint) 第一个柱图的颜色
void
setLastBarPaint(Paint paint) 最后一个柱图的颜色
void
setPositiveBarPaint(Paint paint) 正值柱图的颜色
void
setNegativeBarPaint(Paint paint) 负值柱图的颜色
IntervalBarRenderer(BarRenderer)类:
需要传IntervalCategoryDataset作为数据源
--------------------------------
甘特图
GanttBarRenderer(IntervalBarRenderer)类:
void
setCompletePaint(Paint paint) 完成进度颜色
void
setIncompletePaint(Paint paint) 未完成进度颜色
void
setStartPercent(
double
percent) 设置进度条在整条中的起始位置(
0.0
~
1.0
)
void
setEndPercent(
double
percent) 设置进度条在整条中的结束位置(
0.0
~
1.0
)
StatisticBarRenderer(BarRenderer)类:
需要传StatisticCategoryDataset作为数据源
-------------------------------
折线图渲染
LineAndShapeRenderer(AbstractCategoryItemRenderer)类:
void
setDrawLines(
boolean
draw) 是否折线的数据点之间用线连
void
setDrawShapes(
boolean
draw) 是否折线的数据点根据分类使用不同的形状
void
setShapesFilled(
boolean
filled) 所有分类是否填充数据点图形
void
setSeriesShapesFilled(
int
series,
boolean
filled) 指定分类是否填充数据点图形
void
setUseFillPaintForShapeOutline(
boolean
use) 指定是否填充数据点的Paint也被用于画数据点形状的边框
--------------------------------
LevelRenderer(AbstractCategoryItemRenderer)类:
void
setItemMargin(
double
percent) 每个分类之间的间隔
void
setMaxItemWidth(
double
percent) 每个分类的最大宽度
CategoryStepRenderer(AbstractCategoryItemRenderer)类:
void
setStagger(
boolean
shouldStagger) 不同分类的图是否交错
MinMaxCategoryRenderer(AbstractCategoryItemRenderer)类:
void
setDrawLines(
boolean
drawLines) 是否在每个分类线间画连接线
void
setGroupPaint(Paint groupPaint) 一组图形连接线的颜色
void
setGroupStroke(Stroke groupStroke) 一组图形连接线的笔触
void
setMaxIcon(Icon maxIcon) 最大值的ICON
void
setMinIcon(Icon minIcon) 最小值的ICON
void
setObjectIcon(Icon objectIcon) 所有值的ICON
AreaRender(AbstractCategoryItemRenderer)类:
没有特殊的设置
StackedAreaRender(AreaRender)类
--------------------------------
3
-获得核心对象
//得到JFreeChart
JFreeChart chart = ChartFactory.createTimeSeriesChart(title,
""
,
"新增中长期贷款(亿元)"
, lendingDataset);
//得到Plot
XYPlot xyplot = (XYPlot) chart.getPlot();
//得到渲染器
LineAndShapeRenderer renderer = (LineAndShapeRenderer) plot.getRenderer();
//得到X坐标轴
plot.getDomainAxis();
//得到Y坐标轴
ValueAxis axis = plot.getRangeAxis();
plot.getRangeAxis().setUpperMargin(
0.1
);
// 设置顶部Y坐标轴间距,防止数据无法显示
plot.getRangeAxis().setLowerMargin(
0.1
);
// 设置底部Y坐标轴间距
// 得到标注
chart.getLegend();
chart.getLegend().setFrame(
new
BlockBorder(Color.WHITE));
//设置标注表框
--------------------------------
3
-JfreeChart注意问题事项
--------------------------------
(
1
)中文乱码问题
解决:主题样式只需要加载一次,放在静态代码块即可!
public
class
ChartUtils {
private
static
String NO_DATA_MSG =
"数据加载失败"
;
private
static
Font FONT =
new
Font(
"宋体"
, Font.PLAIN,
12
);
public
static
Color[] CHART_COLORS = {
new
Color(
31
,
129
,
188
),
new
Color(
241
,
92
,
128
),
new
Color(
124
,
181
,
236
),
new
Color(
102
,
172
,
204
),
new
Color(
102
,
102
,
0
),
new
Color(
204
,
153
,
102
),
new
Color(
0
,
153
,
255
),
new
Color(
204
,
255
,
255
),
new
Color(
51
,
153
,
153
),
new
Color(
255
,
204
,
102
),
new
Color(
102
,
102
,
0
),
new
Color(
204
,
204
,
204
),
new
Color(
204
,
255
,
255
),
new
Color(
255
,
204
,
204
),
new
Color(
255
,
255
,
204
),
new
Color(
255
,
153
,
204
),
new
Color(
51
,
0
,
0
),
new
Color(
0
,
51
,
102
),
new
Color(
0
,
153
,
102
),
new
Color(
153
,
102
,
153
),
new
Color(
102
,
153
,
204
),
new
Color(
153
,
204
,
153
),
new
Color(
204
,
204
,
153
),
new
Color(
255
,
255
,
153
),
new
Color(
255
,
204
,
153
),
new
Color(
255
,
153
,
204
),
new
Color(
204
,
153
,
153
),
new
Color(
204
,
204
,
255
),
new
Color(
204
,
255
,
204
),
new
Color(
153
,
204
,
153
),
new
Color(
255
,
204
,
102
) };
//颜色
static
{
setChartTheme();
}
public
ChartUtils() {
}
/**
* 中文主题样式 解决乱码
*/
public
static
void
setChartTheme() {
// 设置中文主题样式 解决乱码
StandardChartTheme chartTheme =
new
StandardChartTheme(
"CN"
);
// 设置标题字体
chartTheme.setExtraLargeFont(FONT);
// 设置图例的字体
chartTheme.setRegularFont(FONT);
// 设置轴向的字体
chartTheme.setLargeFont(FONT);
chartTheme.setSmallFont(FONT);
chartTheme.setTitlePaint(
new
Color(
51
,
51
,
51
));
chartTheme.setSubtitlePaint(
new
Color(
85
,
85
,
85
));
chartTheme.setLegendBackgroundPaint(Color.WHITE);
// 设置标注
chartTheme.setLegendItemPaint(Color.BLACK);
//
chartTheme.setChartBackgroundPaint(Color.WHITE);
// 绘制颜色绘制颜色.轮廓供应商
// paintSequence,outlinePaintSequence,strokeSequence,outlineStrokeSequence,shapeSequence
Paint[] OUTLINE_PAINT_SEQUENCE =
new
Paint[] { Color.WHITE };
//绘制器颜色源
DefaultDrawingSupplier drawingSupplier =
new
DefaultDrawingSupplier(CHART_COLORS, CHART_COLORS, OUTLINE_PAINT_SEQUENCE,
DefaultDrawingSupplier.DEFAULT_STROKE_SEQUENCE, DefaultDrawingSupplier.DEFAULT_OUTLINE_STROKE_SEQUENCE,
DefaultDrawingSupplier.DEFAULT_SHAPE_SEQUENCE);
chartTheme.setDrawingSupplier(drawingSupplier);
chartTheme.setPlotBackgroundPaint(Color.WHITE);
// 绘制区域
chartTheme.setPlotOutlinePaint(Color.WHITE);
// 绘制区域外边框
chartTheme.setLabelLinkPaint(
new
Color(
8
,
55
,
114
));
// 链接标签颜色
chartTheme.setLabelLinkStyle(PieLabelLinkStyle.CUBIC_CURVE);
chartTheme.setAxisOffset(
new
RectangleInsets(
5
,
12
,
5
,
12
));
chartTheme.setDomainGridlinePaint(
new
Color(
192
,
208
,
224
));
// X坐标轴垂直网格颜色
chartTheme.setRangeGridlinePaint(
new
Color(
192
,
192
,
192
));
// Y坐标轴水平网格颜色
chartTheme.setBaselinePaint(Color.WHITE);
chartTheme.setCrosshairPaint(Color.BLUE);
// 不确定含义
chartTheme.setAxisLabelPaint(
new
Color(
51
,
51
,
51
));
// 坐标轴标题文字颜色
chartTheme.setTickLabelPaint(
new
Color(
67
,
67
,
72
));
// 刻度数字
chartTheme.setBarPainter(
new
StandardBarPainter());
// 设置柱状图渲染
chartTheme.setXYBarPainter(
new
StandardXYBarPainter());
// XYBar 渲染
chartTheme.setItemLabelPaint(Color.black);
chartTheme.setThermometerPaint(Color.white);
// 温度计
ChartFactory.setChartTheme(chartTheme);
}
}
--------------------------------
(
2
)中文字体模糊
解决:必须取消文本抗锯齿,创建JFreeChart完毕后,调用setAntiAlias取消文本抗锯齿
public
static
void
setAntiAlias(JFreeChart chart) {
chart.setTextAntiAlias(
false
);
}
调用:
JFreeChart chart = ChartFactory.createTimeSeriesChart(title,
""
,
""
, dataset);
ChartUtils.setAntiAlias(chart);
--------------------------------
(
3
)创建折线图时,显示数据,数据被遮盖
解决:
plot.getRangeAxis().setUpperMargin(
0.1
);
// 设置顶部Y坐标轴间距百分比,防止数据无法显示
plot.getRangeAxis().setLowerMargin(
0.1
);
// 设置底部Y坐标轴间距百分比
--------------------------------
(
4
)创建时间序列柱状图图时,柱子显示过细
解决:暂时无法解决
原因:柱子宽度由 Timeseries.add(
new
Day(date), dValue); add里面的RegularTimePeriod决定。
意思就是:如果RegularTimePeriod为
Day,那个这个柱子的宽度占比为
1
/(最大日期-最小日期 之间的天数)
Month,那个这个柱子的宽度占比为
1
/(最大日期-最小日期 之间的月数)
YEAR,那个这个柱子的宽度占比为
1
/(最大日期-最小日期 之间的年数)
所以,时间间隔越小,柱子宽度就越粗。
如果时间间隔过大的话,建议使用时间序列折线图或者柱状图代替。
 ---------------------------------
(5)设置 X 坐标刻度间隔单位(X坐标轴数据太密集处理)
NumberAxis domainAxis = (NumberAxis)plot.getDomainAxis();//x轴设置
domainAxis.setTickUnit(new NumberTickUnit(100));/每100个刻度显示一个刻度值


 595
595

 被折叠的 条评论
为什么被折叠?
被折叠的 条评论
为什么被折叠?
 到【灌水乐园】发言


