


echarts数据地图(二)
1.业务需求
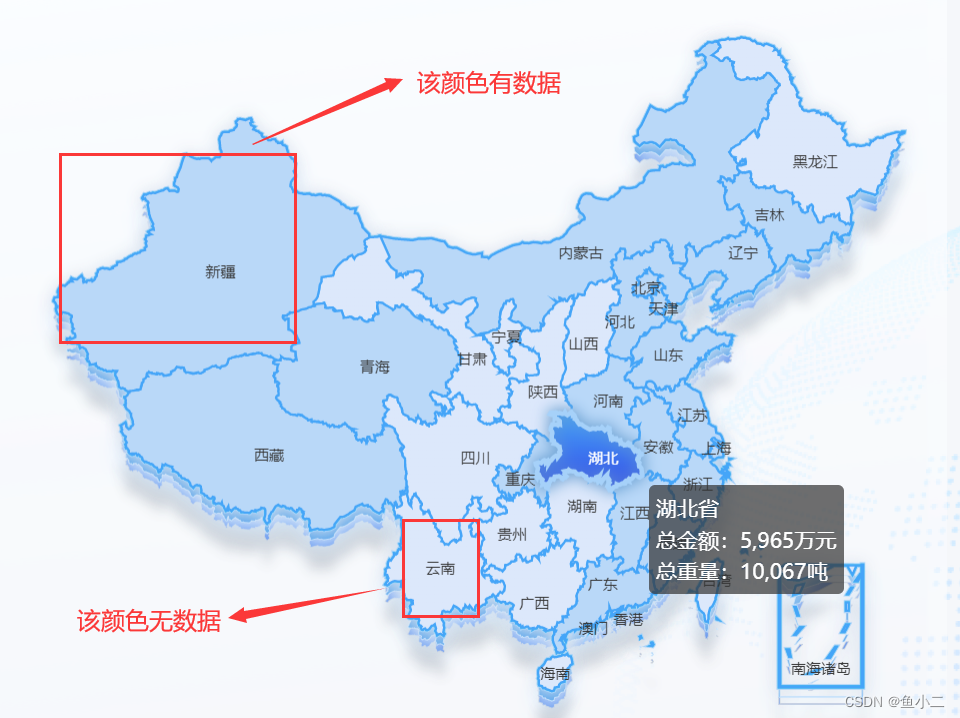
- 省份有无数据使用不同颜色区分
- 有数据省份鼠标操作显示小手样式,无数据省份鼠标操作显示箭头样式
- 有数据省份操作有选中颜色变化,无数据省份操作无变化
2.效果图示
3.相关代码
// 地图渲染方法
initPlaceOrderMap() {
let vm = this;
let mapName = "china";
let data = [
{ name: "北京", value: 0 },
{ name: "天津", value: 0 },
{ name: "河北", value: 0 },
{ name: "山西", value: 0 },
{ name: "内蒙古", value: 0 },
{ name: "辽宁", value: 0 },
{ name: "吉林", value: 0 },
{ name: "黑龙江", value: 0 },
{ name: "上海", value: 0 },
{ name: "江苏", value: 0 },
{ name: "浙江", value: 0 },
{ name: "安徽", value: 0 },
{ name: "福建", value: 0 },
{ name: "江西", value: 0 },
{ name: "山东", value: 0 },
{ name: "河南", value: 0 },
{ name: "湖北", value: 0 },
{ name: "湖南", value: 0 },
{ name: "重庆", value: 0 },
{ name: "四川", value: 0 },
{ name: "贵州", value: 0 },
{ name: "云南", value: 0 },
{ name: "西藏", value: 0 },
{ name: "陕西", value: 0 },
{ name: "甘肃", value: 0 },
{ name: "青海", value: 0 },
{ name: "宁夏", value: 0 },
{ name: "新疆", value: 0 },
{ name: "广东", value: 0 },
{ name: "广西", value: 0 },
{ name: "海南", value: 0 },
];
let toolTipData = this.mapTooltipData
let aData=[]
for(let index=0;index<data.length;index++){
for(let i=0;i<toolTipData.length;i++){
if(data[index].name.slice(0,2)==toolTipData[i].proName.slice(0,2)){
data[index].value=toolTipData[i].roundMoneyUms;
aData.push(data[index])
break
}
}
}
let option = {
tooltip: {
trigger: "axis",
axisPointer: {
type: "shadow",
},
extraCssText: 'z-index: 2'
},
visualMap: {
show:false,
min: 0,
left: 'left',
top: 'bottom',
text: ['高', '低'],
calculable: false,
orient: 'horizontal',
inRange: {
color: ['#B9D8F8', '#B9D8F8'],
symbolSize: [30, 100]
}
},
grid: {
// show: true,
right: "10%",
top: 5,
bottom: "10%",
left: "10%",
},
geo: [
{
map: mapName,
zlevel: -1,
zoom: 1.2,
silent: true,
layoutCenter: ["50%", "50%"],
layoutSize: "100%",
roam: false,
itemStyle: {
normal: {
borderColor: "#A6D1F9", //第一层地图最边边框
borderWidth: 3,
shadowColor: "#DEE4EE", //第一层投影
shadowOffsetY: 0,
shadowBlur: 10,
areaColor: "#FFFFFF",
},
},
label: {
normal: {
//静态的时候展示样式
show: false, //是否显示地图省份得名称
textStyle: {
color: "#fff",
fontSize: 12,
fontFamily: "Arial",
},
},
emphasis: {
//动态展示的样式
show: false,
color: "#fff",
},
},
},
{
show: true,
map: mapName,
zoom: 1.2,
layoutCenter: ["50%", "50%"],
layoutSize: "100%",
label: {
normal: {
//静态的时候展示样式
show: false, //是否显示地图省份得名称
textStyle: {
color: "#fff",
fontSize: 12,
fontFamily: "Arial",
},
},
emphasis: {
//动态展示的样式
color: "#fff",
},
},
blur: {
label: { show: true, color: "#fff" },
},
roam: false, // 是否开启鼠标滚轮缩放
itemStyle: {
normal: {
label: {
show: true,
color: "#fff",
},
color: "#fff",
borderColor: "#32CBE0", //第一层边框(最边框)
borderWidth: 1.5,
areaColor: {
type: "linear-gradient",
x: 0,
y: 1000,
x2: 0,
y2: 0,
colorStops: [
{
offset: 0.5,
color: "#ffffff", // 0% 处的颜色
},
{
offset: 1,
color: "#ffffff", // 100% 处的颜色
},
],
global: true, // 缺省为 false
},
},
emphasis: {
label: {
show: true,
color: "#fff",
},
borderWidth: 3,
borderColor: "#A6D1F9",
shadowColor: "#A6D1F9",
shadowBlur: 30,
textStyle: {
color: "#fff",
fontSize: 12,
backgroundColor: "transparent",
},
areaColor: new echarts.graphic.LinearGradient(
0,
0,
0,
1,
[
{
offset: 0,
color: "#ffffff",
},
{
offset: 1,
color: "#D2EAFF",
},
],
false
),
},
},
},
{
type: "map",
map: mapName,
zlevel: -2,
zoom: 1.2,
layoutCenter: ["50%", "51.4%"],
layoutSize: "100%",
roam: false,
silent: true,
itemStyle: {
normal: {
borderColor: "#D2EAFF", //第二层地图边框
shadowColor: "#D2EAFF", //第二层地图投影
shadowOffsetY: 5,
shadowBlur: 15,
areaColor: "#53A2EB", //第二层地图的颜色
},
},
},
{
type: "map",
map: mapName,
zlevel: -3,
zoom: 1.2,
layoutCenter: ["50%", "52.4%"],
layoutSize: "100%",
roam: false,
silent: true,
itemStyle: {
normal: {
borderColor: "#CED2D8", //第三层地图投影
shadowColor: "#CED2D8", //第三层地图边框
shadowOffsetY: 15,
shadowBlur: 8,
areaColor: "#5387EB", //第三层地图颜色
},
},
},
],
series: [
{
type: "map",
layoutCenter: ["50%", "50%"],
layoutSize: "100%",
zoom:1.2,
label: {
normal: {
//静态的时候展示样式
show: true, //是否显示地图省份得名称
textStyle: {
color: "#333",
fontSize: 10,
},
},
emphasis: {
//动态展示的样式
color: "#fff",
},
}, // geoIndex: 0,
map: mapName,
tooltip: {
trigger: "item",
formatter: function (params) {
if (typeof params.value[2] == "undefined") {
var toolTiphtml = "";
for (var i = 0; i < toolTipData.length; i++) {
if (params.name.slice(0,2) == toolTipData[i].proName.slice(0,2)) {
toolTiphtml += toolTipData[i].proName + "<br>";
toolTiphtml += "总金额:" +toolTipData[i].roundMoneyUms.toString().replace(/\B(?=(\d{3})+$)/g, ",") +"万元" +"<br>";
toolTiphtml += "总重量:" +toolTipData[i].roundWeightNums.toString().replace(/\B(?=(\d{3})+$)/g, ",") +"吨" +"<br>";
vm.selectData={
name: toolTipData[i].proName,
transactionNum: toolTipData[i].roundMoneyUms,
weight: toolTipData[i].roundWeightNums,
}
}
}
return toolTiphtml;
} else {
var toolTiphtml = "";
for (var i = 0; i < toolTipData.length; i++) {
if (params.name.slice(0.2) ==toolTipData[i].proName.slice(0,2)) {
toolTiphtml += toolTipData[i].proName + "<br>";
toolTiphtml += "总金额:" +toolTipData[i].roundMoneyUms.toString().replace(/\B(?=(\d{3})+$)/g, ",") +"万元" +"<br>";
toolTiphtml += "总重量:" +toolTipData[i].roundWeightNums.toString().replace(/\B(?=(\d{3})+$)/g, ",") +"吨" +"<br>";
vm.selectData={
name: toolTipData[i].proName,
transactionNum: toolTipData[i].roundMoneyUms,
weight: toolTipData[i].roundWeightNums,
}
}
}
return toolTiphtml;
}
},
},
itemStyle: {
normal: {
label: {
show: true,
color: "#fff",
},
color: "#fff",
borderColor: "#45A5F8", //第一层地图描边
borderWidth: 1.5,
areaColor: {
type: "linear-gradient",
x: 0,
y: 1000,
x2: 0,
y2: 0,
colorStops: [
{
offset: 0.5,
color: "#DCE8FB", // 0% 处的颜色//深处整体地图展示的颜色
},
{
offset: 1,
color: "#DCE8FB", // 100% 处的颜色//浅
},
],
global: true, // 缺省为 false
},
},
emphasis: {
label: {
show: true,
color: "#fff",
},
borderWidth: 3,
borderColor: "#A6D1F9", //浮动地图的边框的颜色
shadowColor: "#669DD0", //浮动地图的投影颜色
shadowBlur: 10, //浮动地图的范围
textStyle: {
color: "#fff",
fontSize: 12,
backgroundColor: "transparent",
},
areaColor: new echarts.graphic.LinearGradient(
0,
0,
0,
1,
[
{
offset: 0,
color: "#45A5F8", //鼠标走过经过地图的渐变
},
{
offset: 1,
color: "#3348e7",
},
],
false
),
},
},
data: aData,
},
],
};
var count = 0;
var timer = null;
var chart = echarts.init(document.getElementById("placeOrderMap"));
var dataLength = option.series[0].data.length;
timer && clearInterval(timer);
timer = setInterval(() => {
chart.dispatchAction({
type: "downplay",
seriesIndex: 0,
});
chart.dispatchAction({
type: "highlight",
seriesIndex: 0,
dataIndex: count % dataLength,
});
chart.dispatchAction({
type: "showTip",
seriesIndex: 0,
dataIndex: count % dataLength,
});
count++;
}, 3000);
chart.on("mouseover", function (params) {
vm.changeValue = params.value;
clearInterval(timer);
chart.dispatchAction({
type: "downplay",
seriesIndex: 0,
});
chart.dispatchAction({
type: "highlight",
seriesIndex: 0,
dataIndex: params.dataIndex,
});
chart.dispatchAction({
type: "showTip",
seriesIndex: 0,
dataIndex: params.dataIndex,
});
// 无数据时操作无反应
if (isNaN(params.value)) {
chart.dispatchAction({
type: "downplay",
seriesIndex: 0,
});
return;
}
});
chart.getZr().on('mousemove', param => {
if (vm.changeValue) {//若鼠标滑过区域位置在当前图表范围内 鼠标设置为小手
chart.getZr().setCursorStyle('pointer')
}else{
chart.getZr().setCursorStyle('default')
}
})
chart.on("mouseout", function (params) {
timer && clearInterval(timer);
timer = setInterval(function () {
chart.dispatchAction({
type: "downplay",
seriesIndex: 0,
});
chart.dispatchAction({
type: "highlight",
seriesIndex: 0,
dataIndex: count % dataLength,
});
chart.dispatchAction({
type: "showTip",
seriesIndex: 0,
dataIndex: count % dataLength,
});
count++;
}, 3000);
});
chart.setOption(option);
},
注意:文档中的mapTooltipData为接口获取到的数据,数据格式如下:[{cityName:null,cityNo:null,moneyUms:239022,proCode:‘410000’,proName:‘河南省’,weightNums:2455,children:[{cityName:‘新乡市’,cityNo:‘410700’,moneyUms:2390,proCode:‘410000’,proName:‘河南省’,weightNums:245.5}]}]


 1918
1918


 被折叠的 条评论
为什么被折叠?
被折叠的 条评论
为什么被折叠?
 到【灌水乐园】发言


