


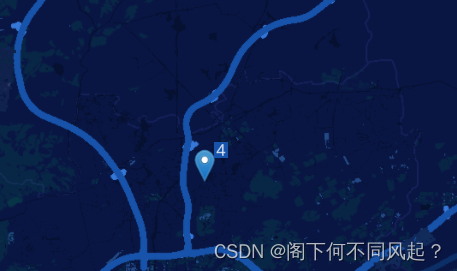
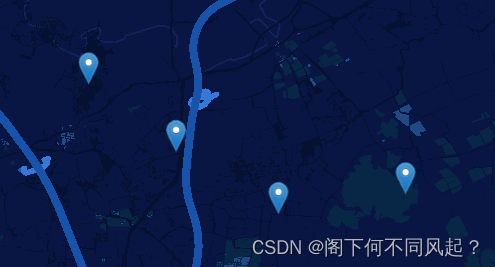
实现效果如图:
代码如下:
<template>
<div class="screen-container">
<div class="map-container">
<div class="rlt_btn">
<el-button class="btn" type="primary" @click="createclusterLayer('icon_1', 1)">添加点位1</el-button>
<el-button class="btn" type="primary" @click="createclusterLayer('icon_2', 2)">添加点位2</el-button>
</div>
<!-- 超图及echart组件 -->
<sm-web-map v-if="flag" @load="mapLoad" @click="mapClick" :loading="!flag" :map-options="options">
<sm-echarts-layer :options="echartsOptions"></sm-echarts-layer>
</sm-web-map>
<!-- 桩位信息浮窗 -->
<div :style="{ left: pointPosition.x + 160 + 'px', top: (pointPosition.y <= 200 ? 100 : pointPosition.y - 200) + 'px' }"
v-if="pointVisible" class="point-info">
<div class="pile-point-item" style="height:150px;">
<h2 class="pile-name">桩号:{{ pointPosition.data.stake_no }}</h2>
<p class="road-section">路段:{{ pointPosition.data.highway_service_name }}</p>
<div class="detail">
<p class="lnglat">X经度:{{ pointPosition.data.lng }}</p>
<p class="lnglat">Y纬度:{{ pointPosition.data.lat }}</p>
</div>
</div>
</div>
</div>
</div>
</template>
<script>
import { HomeApi } from '@/services/Home'
import '@supermap/iclient-mapboxgl';
import { DatasourceService, GetFeaturesByGeometryParameters } from '@supermap/iclient-mapboxgl';
import { gantry, blockList } from '@/assets/json/gantry'
import * as turf from '@turf/turf'
import icon_1 from '@/assets/ali.png'
const icon_2 = 'https://cdn.bootcdn.net/ajax/libs/leaflet/1.0.0/images/marker-icon.png'
export default {
data() {
return {
options: {
},
echartsOptions: {
},
flag: false,
visible: false,
// 超图实例
supermapInstance: {},
prefix: 'http://localhost:8090/',
nearestList: [],
symbolSize: 8,
pointVisible: false,
// 点位位置信息
pointPosition: {
x: 0,
y: 0,
data: {}
},
pos: {
x: 0,
y: 0
},
// echart实例
echartInstance: {},
heatMapLayer: {},
clusterLayer: null,//聚合图层
};
},
watch: {
},
props: {
},
computed: {
},
created() {
},
async mounted() {
await this.render()
},
methods: {
// 创建聚合图层
createclusterLayer(iconName, index) {
let e = this.supermapInstance;
if (e.map.getSource(`poidata-${index}`)) {
this.removeclusterLayer(index)
}
let iconMap = {
'icon_1': icon_1,
'icon_2': icon_2
}
const icon = iconMap[iconName]
var geojson = {
"type": "FeatureCollection",
"features": []
};
// 后端接口返回点坐标数据
geojson.features = [{
type: 'Feature',
geometry: {
type: 'Point',
coordinates: [120.02225397864616 + index * 0.1, 30.2407888431817 + index * 0.1]
},
properties: {
title: '点一',
id: 1,
}
},
{
type: 'Feature',
geometry: {
type: 'Point',
coordinates: [119.978604 + index * 0.1, 30.23495 + index * 0.1]
},
},
{
type: 'Feature',
geometry: {
type: 'Point',
coordinates: [119.94344968972486 + index * 0.1, 30.253317832596277 + index * 0.1]
},
},
{
type: 'Feature',
geometry: {
type: 'Point',
coordinates: [119.91344968972486 + index * 0.1, 30.273317832596277 + index * 0.1]
},
}
]
// 创建聚合图层
e.map.addSource(`poidata-${index}`, {
type: 'geojson',
data: geojson,
cluster: true,
//最大的聚合级别,超过级别不进行聚合
clusterMaxZoom: 12,
//聚合的半径,单位是像素
clusterRadius: 80,
//最小聚合的点数量
clusterMinPoints: 2
});
e.map.loadImage(icon, function (error, image) {
if (error) throw error;
e.map.addImage(`custom-icon-${index}`, image);
e.map.addLayer({
id: `clusters-${index}`,
type: "circle",// 第一个图层为circle类型,无需显示图标,目的是根据点位大小创建圆形图层,以供点击聚合点位缩放事件
source: `poidata-${index}`,
filter: ["has", "point_count"],
paint: {
"circle-color": [
"step",
["get", "point_count"],
"rgba(0,0,0,0)",
100,
"rgba(0,0,0,0)",
750,
"rgba(0,0,0,0)",
],
"circle-radius": [
"step",
["get", "point_count"],
20,
100,
30,
750,
40
]
}
});
e.map.addLayer({
id: `cluster-count-${index}`,
type: "symbol",
source: `poidata-${index}`,
filter: ["has", "point_count"],
layout: {
"text-field": "{point_count_abbreviated}",
"text-font": ["DIN Offc Pro Medium", "Arial Unicode MS Bold"],
"text-size": 16,
// "text-offset": [2, 2],
'icon-image': `custom-icon-${index}`,
'icon-size': 0.8,
},
paint: {
"text-color": "#fff",
"text-translate": [16, -16],
"text-halo-color": "#1753aa", // 文本的光晕颜色(可选,默认值为 rgba(0,0,0,0))
"text-halo-width": 16, // 文本的光晕宽度(可选,值 >= 0,默认值为 0,单位:像素)
// "text-halo-blur": 0, // 文本的光晕模糊宽度(可选,值 >= 0,默认值为 0,单位:像素)
}
});
e.map.addLayer({
id: `unclustered-point-${index}`,
type: "symbol",
source: `poidata-${index}`,
filter: ["!", ["has", "point_count"]],
layout: {
'icon-image': `custom-icon-${index}`,
'icon-size': 0.8,
}
});
// 监听聚合图层点击事件
// 聚合点点击事件
e.map.on('click', `clusters-${index}`, function (el) {
console.log(el)
var features = e.map.queryRenderedFeatures(el.point, {
layers: [`clusters-${index}`]
});
var clusterId = features[0].properties.cluster_id;
e.map.getSource(`poidata-${index}`).getClusterExpansionZoom(clusterId, function (
err, zoom) {
if (err)
return;
e.map.flyTo({
center: features[0].geometry.coordinates,
zoom: zoom
});
});
});
// 散点点击事件
e.map.on('click', `unclustered-point-${index}`, function (el) {
var features = e.map.queryRenderedFeatures(el.point, {
layers: [`unclustered-point-${index}`]
});
console.log(features, '散点点击事件')
});
e.map.on('mouseenter', `clusters-${index}`, function () {
e.map.getCanvas().style.cursor = 'pointer';
});
e.map.on('mouseleave', `clusters-${index}`, function () {
e.map.getCanvas().style.cursor = '';
});
});
},
// 清除聚合图层
removeclusterLayer(index) {
let e = this.supermapInstance;
if (e.map.getSource(`poidata-${index}`)) {
e.map.removeImage(`custom-icon-${index}`)
e.map.removeLayer(`clusters-${index}`)
e.map.removeLayer(`cluster-count-${index}`)
e.map.removeLayer(`unclustered-point-${index}`)
e.map.removeSource(`poidata-${index}`)
}
},
mapClick(e) {
this.render()
},
render() {
this.flag = false
this.echartsOptions = {
GLMap: {
roam: true
},
coordinateSystem: 'GLMap',
animation: false,
series: []
}
let baseUrl = this.prefix + '/iserver/services/map-hhymap0822/rest/maps/hhy@hhymap'
this.options = {
container: 'map', // 地图容器 id
style: {
'version': 8,
// glyphs为字体文件地址,必填,不然聚合缩放时聚合点位数量字体无法显示
"glyphs": "https://iserver.supermap.io/iserver/services/map-china400/rest/maps/China/tileFeature/sdffonts/{fontstack}/{range}.pbf",
'sources': {
'raster-tiles': {
'type': 'raster',
'tiles': [
`${baseUrl}/zxyTileImage.gif?z={z}&x={x}&y={y}&transparent=true`
],
'tileSize': 256
},
baseLayer_img: {
type: 'raster',
tiles: [
// process.env.BASE_IMG_API
`${baseUrl}/zxyTileImage.gif?z={z}&x={x}&y={y}&transparent=true`
],
tileSize: 256
},
baseLayer_vec: {
type: 'raster',
tiles: [
// process.env.BASE_VEC_API
`${baseUrl}/zxyTileImage.gif?z={z}&x={x}&y={y}&transparent=true`
],
tileSize: 256
},
labelLayer_img: {
type: 'raster',
tiles: [
// process.env.LABEL_IMG_API
`${baseUrl}/zxyTileImage.gif?z={z}&x={x}&y={y}&transparent=true`
],
tileSize: 256
},
labelLayer_vec: {
type: 'raster',
tiles: [
// process.env.LABEL_VEC_API
`${baseUrl}/zxyTileImage.gif?z={z}&x={x}&y={y}&transparent=true`
],
tileSize: 256
}
},
'layers': [
{
id: 'baseLayer_img',
type: 'raster',
source: 'baseLayer_img',
minzoom: 0,
maxzoom: 12
},
{
id: 'baseLayer_vec',
type: 'raster',
source: 'baseLayer_vec',
minzoom: 12,
maxzoom: 18
},
{
id: 'labelLayer_img',
type: 'raster',
source: 'labelLayer_img',
minzoom: 0,
maxzoom: 12
},
{
id: 'labelLayer_vec',
type: 'raster',
source: 'labelLayer_vec',
minzoom: 12,
maxzoom: 18
}
]
},
center: [120.02225397864616, 30.2407888431817], // 地图中心点
zoom: 10, // 地图初始缩放级别
minZoom: 8,
echartsOptions: this.echartsOptions
}
this.flag = true
},
getData() {
}
},
};
</script>


 1263
1263

 被折叠的 条评论
为什么被折叠?
被折叠的 条评论
为什么被折叠?
 到【灌水乐园】发言


