


第一篇:VUE 使用 HighCharts 画 3D环/饼图
前言:自己在弄一个大屏项目中,在使用Echarts 画3D环/饼图时遇到了问题,官方也没有例子,最后采用了 HighCharts 。
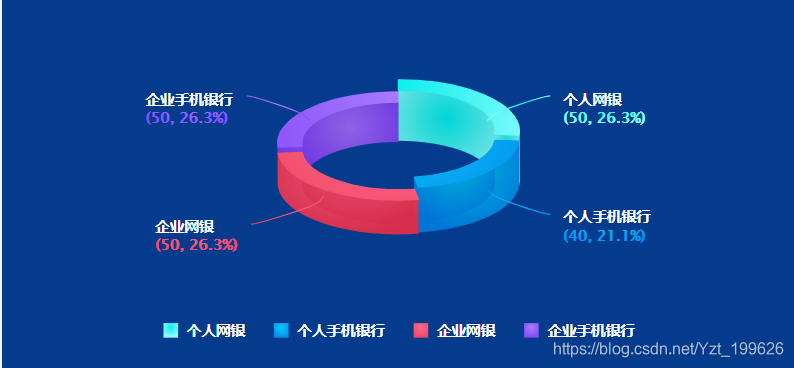
话不多说,先直接上效果图,有需要的大家可借鉴借鉴。
下面是步骤以及代码:
1.npm 安装 highcharts
npm install highcharts --save2.在main.js中引用 highcharts, 注意:画3D图需要使用到 highcharts里面的 highcharts-3d
import Highcharts from 'highcharts'

import Highcharts3d from 'highcharts/highcharts-3d'

Highcharts3d(Highcharts)
3. 封装一个pip.vue 用于接收传入的数据,并渲染成3D 环/饼 图
<template>
  <div class="container" id="container">
    <div :id="id" :option="option" class="echart-container"></div>
  </div>
</template>
<script>
import HighCharts from 'highcharts'
export default {
  props: {
    // id用于区分多处复用highcharts文件
    id: {
      type: String
    },
    //option 是图表的配置数据
    option: {
      type: Object
    }
  },
  data() {
    return {
      charts: null
    }
  },
  mounted() {
    // 页面加载完成之后再渲染图表
    this.setOption()
  },
  methods: {
    setOption() {
      if (this.charts) {
        this.charts.destroy()
      }
      this.charts = HighCharts.chart(this.id, this.option)
      this.charts.reflow()
    }
  }
}
</script>

<style lang="scss" scoped>
/* 容器 */
::v-deep.container {
  width: 100%;
  height: 100%;
  background: #043b8c;
  .echart-container {
    width: 100%;
    height: 100%;
  }
  // 去除水印
  .highcharts-credits {
    display: none;
  }
}
</style>
4.书写 3D饼/环 需要的相关数据和相关配置。
<template>
<div class="charts">
<pie :id="id" :option="option"></pie>
</div>
</template>
<script>
import pie from './pip.vue'
import HighCharts from 'highcharts'
export default {
components: {
pie
},
data() {
return {
id: 'echart-container',
option: {
title: {
text: null //图表的标题文字
},
subtitle: {
text: null //副标题文字
},
tooltip: {
backgroundColor: '#b2bec3',
borderColor: '#b2bec3',
style: {
color: '#FFFFFF'
}
},
legend: {
labelFormatter: function() {
/*
* 格式化函数可用的变量:this, 可以用 console.log(this) 来查看包含的详细信息
* this 代表当前数据列对象,所以默认的实现是 return this.name
*/
return this.name
},
align: 'center', //程度标的目标地位
verticalAlign: 'bottom', //垂直标的目标地位
x: 0, //间隔x轴的间隔
y: 0, //间隔Y轴的间隔
symbolRadius: 0,
itemStyle: {
cursor: 'pointer',
color: '#FFFFFF'
},
itemHoverStyle: {
color: '#FFFFFF'
}
},
// colors: ['#99FCFF', '#028EEF', '#F04864', '#854BF7'],
chart: {
type: 'pie',
renderTo: 'container',
plotBackgroundColor: null,
plotBorderWidth: null,
plotShadow: false,
backgroundColor: null,
animation: false,
events: {
load: function() {
var each = HighCharts.each,
points = this.series[0].points
each(points, function(p) {
p.graphic.attr({
translateY: -p.shapeArgs.ran
})
p.graphic.side1.attr({
translateY: -p.shapeArgs.ran
})
p.graphic.side2.attr({
translateY: -p.shapeArgs.ran
})
})
}
},
options3d: {
enabled: true,
alpha: 65,
beta: 0, //图表视图旋转角度
viewDistance: 40 //定义图表的浏览长度
}
},
plotOptions: {
pie: {
allowPointSelect: false,
cursor: 'pointer',
depth: 35,
innerSize: '80%',
textShadow: false,
shadow: false,
dataLabels: {
enabled: true,
formatter: function() {
return (
this.point.name +
'<br><p style="color:' +
this.color +
'">(' +
this.y +
', ' +
this.percentage.toFixed(1) +
'%)</p>'
)
},
style: {
color: '#FFFFFF',
fontSize: '12px',
textOutline: 'none'
}
},
states: {
inactive: {
opacity: 0.7,
size: '120%'
},
hover: {
halo: {
size: '120%',
attributes: {
fill: HighCharts.getOptions().colors[2],
'stroke-width': 2,
stroke: HighCharts.getOptions().colors[1]
}
}
}
}
},
series: {
point: {
events: {
mouseOver: function() {},
mouseOut: function() {},
hover: {
backgroundColor: '#000000'
}
}
}
},
column: {
events: {}
}
},
series: [
{
type: 'pie',
name: 'Browser share',
hoverAnimation: true,
size: '90%',
startAngle: 0,
showInLegend: true, // 默认值
colorByPoint: true,
data: [
{ name: '个人网银', y: 50, h: 20, sliced: true, selected: true }, //模块名和所占比,也可以{name: '测试1',y: 12}
{ name: '个人手机银行', y: 40, h: 15 }, //模块名和所占比,也可以{name: '测试1',y: 12}
{ name: '企业网银', y: 50, h: 5 }, //模块名和所占比,也可以{name: '测试1',y: 12}
{ name: '企业手机银行', y: 50, h: 10 } //模块名和所占比,也可以{name: '测试1',y: 12}
]
}
]
}
}
},
created() {
// 设置颜色渐变
this.setcolor()
// 设置饼图高度
this.setOptonHeight()
// 设置点击事件
this.setClick()
},
mounted() {},
methods: {
setOptonHeight() {
var each = HighCharts.each,
round = Math.round,
cos = Math.cos,
sin = Math.sin,
deg2rad = Math.deg2rad
HighCharts.wrap(
HighCharts.seriesTypes.pie.prototype,
'translate',
function(proceed) {
proceed.apply(this, [].slice.call(arguments, 1))
// Do not do this if the chart is not 3D
if (!this.chart.is3d()) {
return
}
var series = this,
chart = series.chart,
options = chart.options,
seriesOptions = series.options,
depth = seriesOptions.depth || 0,
options3d = options.chart.options3d,
alpha = options3d.alpha,
beta = options3d.beta,
z = seriesOptions.stacking
? (seriesOptions.stack || 0) * depth
: series._i * depth
z += depth / 2
if (seriesOptions.grouping !== false) {
z = 0
}
each(series.data, function(point) {
var shapeArgs = point.shapeArgs,
angle
point.shapeType = 'arc3d'
var ran = point.options.h
shapeArgs.z = z
shapeArgs.depth = depth * 0.75 + ran
shapeArgs.alpha = alpha
shapeArgs.beta = beta
shapeArgs.center = series.center
shapeArgs.ran = ran
angle = (shapeArgs.end + shapeArgs.start) / 2
point.slicedTranslation = {
translateX: round(
cos(angle) * seriesOptions.slicedOffset * cos(alpha * deg2rad)
),
translateY: round(
sin(angle) * seriesOptions.slicedOffset * cos(alpha * deg2rad)
)
}
})
}
)
;(function(H) {
H.wrap(HighCharts.SVGRenderer.prototype, 'arc3dPath', function(
proceed
) {
// Run original proceed method
var ret = proceed.apply(this, [].slice.call(arguments, 1))
ret.zTop = (ret.zOut + 0.5) / 100
return ret
})
})(HighCharts)
},
setcolor() {
// 颜色的填充
let color1 = ['#0DEFED', '#0ECAF6', '#FF698F', '#A77BFF']
let color2 = ['#99FCFF', '#028EEF', '#F04864', '#854BF7']
HighCharts.getOptions().colors = HighCharts.map(
HighCharts.getOptions().colors,
function(color, index) {
return {
radialGradient: { cx: 0.5, cy: 0.3, r: 0.7 },
stops: [
[0, color1[index]],
[1, color2[index]] // darken
]
}
}
)
},
setClick() {
let each = HighCharts.each
// todo 自定义图例事件
HighCharts.wrap(HighCharts.Legend.prototype, 'renderItem', function(
proceed,
item
) {
proceed.call(this, item)
var series = this.chart.series,
element = item.legendGroup.element
// todo 图例鼠标移入事件
element.onmouseover = function() {
each(series, function(seriesItem) {
if (seriesItem !== item) {
each(['group', 'markerGroup'], function(group) {
// todo 鼠标移入图例不改变颜色样式
seriesItem[group].attr('opacity', 1.0)
seriesItem[group].attr('color', '#e1e1e1')
})
}
})
}
// todo 图例点击事件
element.onclick = function() {
return false
}
})
}
}
}
</script>
<style lang="scss" scoped>
.charts {
height: 50%;
width: 50%;
}
</style>
5.有疑问的请留言,第一次在csdn上书写博客,大家一起学习一起进步,感谢。


 3836
3836


 被折叠的 条评论
为什么被折叠?
被折叠的 条评论
为什么被折叠?
 到【灌水乐园】发言


