


三、grafana
3.1、安装
grafana是一款近几年新兴的开源数据绘图工具。默认支持多种数据源Prometheus/MySQL/InfluxDB/PgSql/ES/...,新版本grafana已经支持了告警,不再需要单独部署alertmanager,这个看个人爱好!
版本选择:https://grafana.com/grafana/download

wget https://dl.grafana.com/oss/release/grafana-7.5.0-1.x86_64.rpm
sudo yum install grafana-7.5.0-1.x86_64.rpm
systemctl start grafana-server
默认监听3000
3.2、界面介绍
3.2.1、第一个dashboard
-
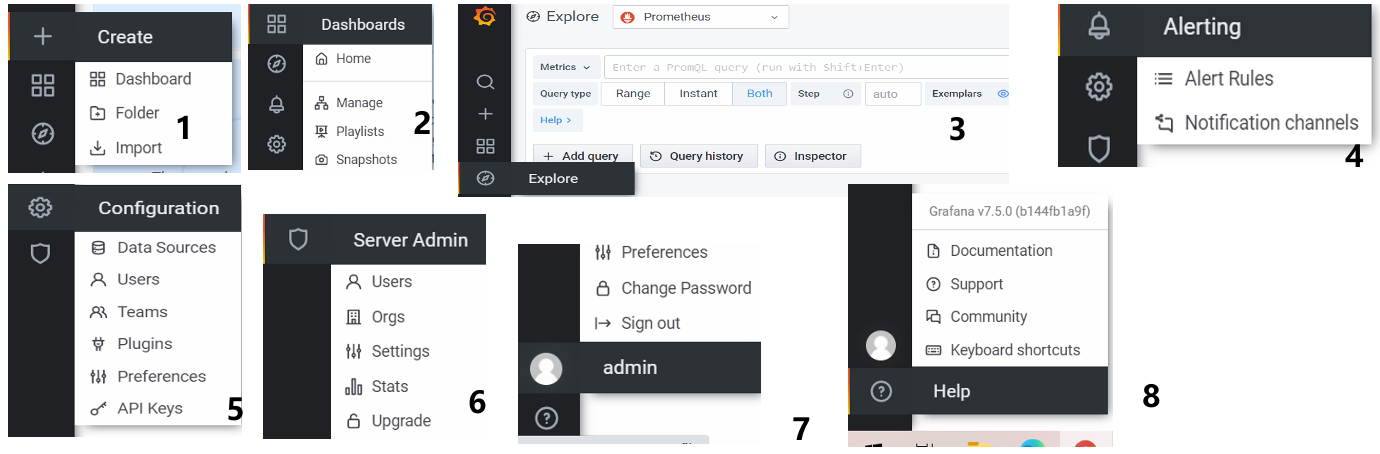
步骤1创建数据源:点击"5"->Data Sources->Add data sources->prometheus-> 填写信息 -
步骤2创建空dashboard:点击"1"->Create Dashboard->Add an empty panel- Add an empty panel: 添加一个空面板
- Add a new row: 添加一行,在改行下的panel可以进行折叠
-
步骤3创建图表:Query -> Metrics -> "$表达式"#输入自定义表达式内容(1-((node_memory_Buffers_bytes + node_memory_Cached_bytes + node_memory_MemFree_bytes) / node_memory_MemTotal_bytes)) * 100- 点击右上角"Save"即可保存
3.2.1、创建界面介绍
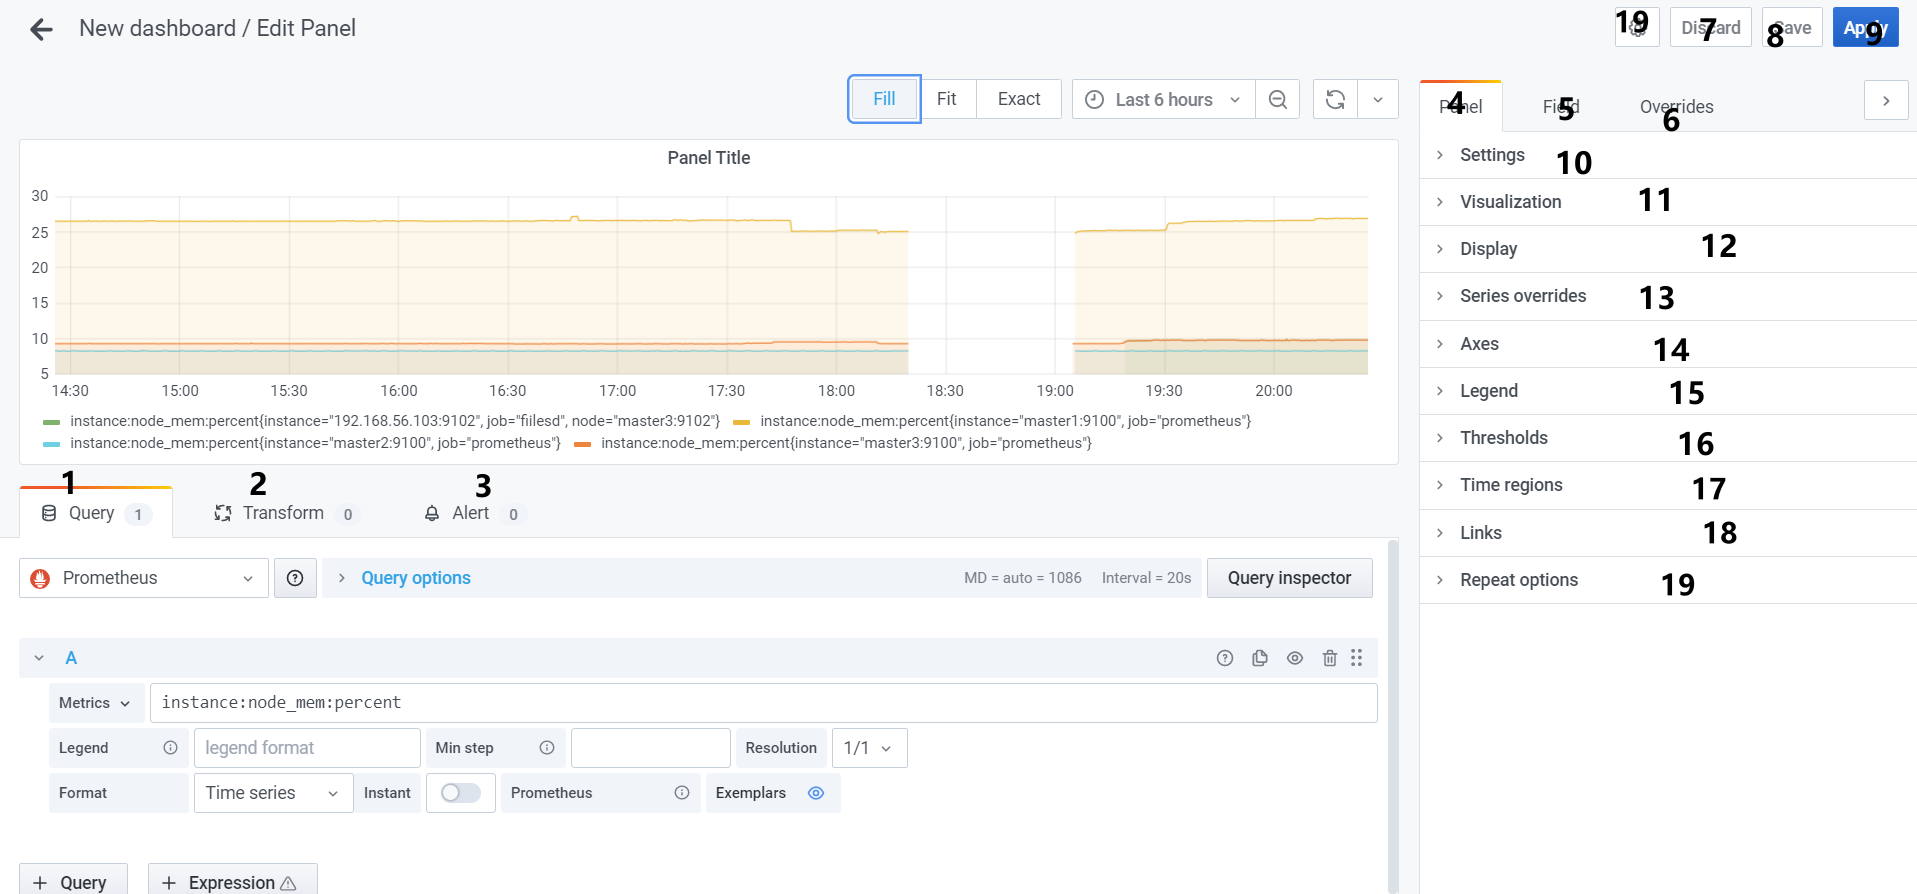
字段说明:(用到的时候再进行补充说明)
- 1、Query: prometheus对数据源进行查询以得到图标数据
- Metrics:时间序列的名称
- Legend:要展示的metric的主要信息,举例:
{{ instance }}则只展示master1:9100,master2:9100,...7 - Min step:prometheus range queries查询的最小间隔
- Format:
- Table: 只在 Visualization中有用
- Time series:
- Heatmap:适用于
Histogram类型的metric在Heatmap面板中展示
- Instant: 只提取最近一个值
- Query options:
- Max data points:
- Min interval:
- Interval:
- Relative time:
- TIme shift:
- 2、Transform:
- 3、Alert:
- 4、Panel:
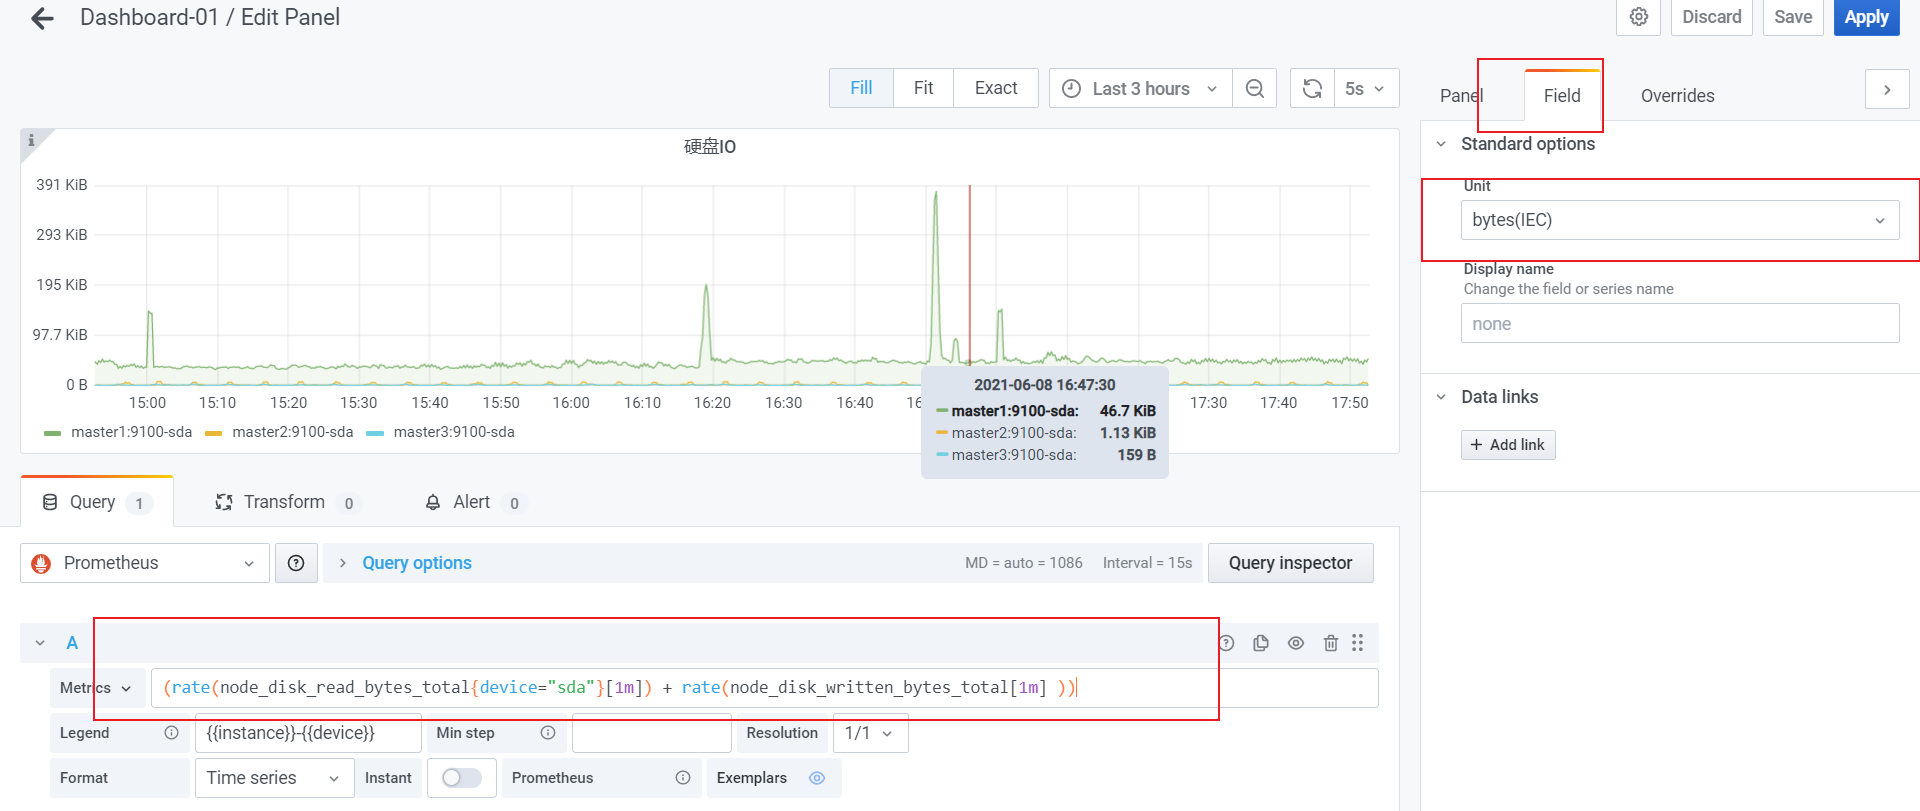
- 5、Field:
- 6、Overrides:
- 7到9:
- Save:保存修改记录,如果确认有变更要修改
- Discard: 丢弃修改记录
- Apply: 应用到当前dashboard,刷新后修改会丢失
- 10、Settings:
- 11、Visualization:
- 12、Display:
- 13、Series override:
- 14、Axes:
- 15、Legend:
- 16、Thresholds
- 17、Time regions:
- 18、Links:
- 19、Repeat options:
各个字段说明:https://grafana.com/docs/grafana/latest/datasources/prometheus/
3.2.3、查询变量
用于查询metric的name和label 或者label对应的value
| Name | Description |
|---|---|
label_names() | Returns a list of label names. |
label_values(label) | Returns a list of label values for the label in every metric. |
label_values(metric, label) | Returns a list of label values for the label in the specified metric. |
metrics(metric) | Returns a list of metrics matching the specified metric regex. |
query_result(query) | Returns a list of Prometheus query result for the query. |
3.2.4、其他常用功能
- 备份和还原
备份:点击单个dashboard->设置按钮->“view json”。可以备份json文件方式备份。
还原:grafana->左侧import
- grafana的告警功能
先在左侧添加:Alerting->Notification channels->创建new channel-> 中创建告警通道
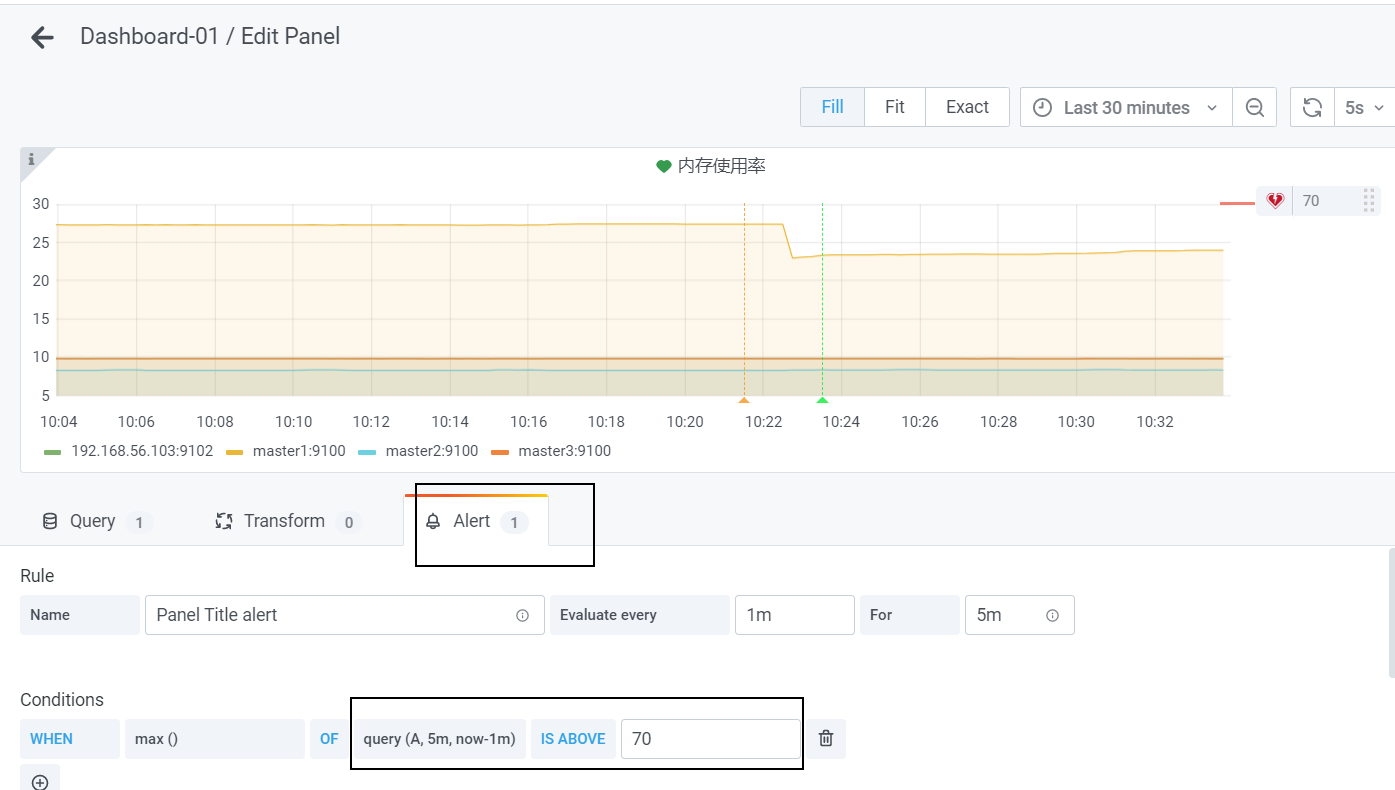
在这里添加后可以在左侧:Alerting->Alert rules-> 中看到,
- dashboard锁定:用于防止别人修改
点击 要锁定的dashboard->Settings->General->Editable[Read-only]
-
主题颜色调整:
左下角账户图标->preferences->UI Theme: -
dashboard如何设置:

dashboard-settings->variables
3.3、常见监控指标
- 监控CPU
100 - avg (irate(node_cpu_seconds_total{mode="idle"}[5m])) by (instance) * 100 #非空闲cpu使用率((sum(increase(node_cpu_seconds_total{mode="user"}[1m])) by (instance)) / (sum(increase(node_cpu_seconds_total[1m])) by (instance))) * 100 #用户空间cpu使用率((sum(increase(node_cpu_seconds_total{mode="system"}[1m])) by (instance)) / (sum(increase(node_cpu_seconds_total[1m])) by (instance))) * 100 #系统空间cpu使用率
- 监控内存
Linux实际可用内存=系统free memory+ buffer+cached
(1-((node_memory_Buffers_bytes + node_memory_Cached_bytes + node_memory_MemFree_bytes) / node_memory_MemTotal_bytes)) * 100
- 监控文件系统使用率
(1- ( node_filesystem_avail_bytes{device!="tmpfs",device!~".*centos-root"} / node_filesystem_size_bytes)) * 100
predict_linear() :可以实时检测硬盘使用率曲线变化情况。比如在很小一段时间内发现硬盘可使用空间急速的下降(跟之前相比较),那么这种下降的速度。进行一个一段时间的预测。如果发现未来比如5分钟内,按照这个速度要达到100%了。那么在当前使用率剩余20%的时候就告警。
- 监控文件描述符使用率
文件描述符监控。linux对每一个进程能打开的文件数量都是由一个限制的。linux系统默认的最大文件描述符个数为1024。
( node_filefd_allocated / node_filefd_maximum ) * 100 文件描述符使用个数
3.4、dashboards
在:https://grafana.com/grafana/dashboards 进行下载然后根据需要进行调整和使用
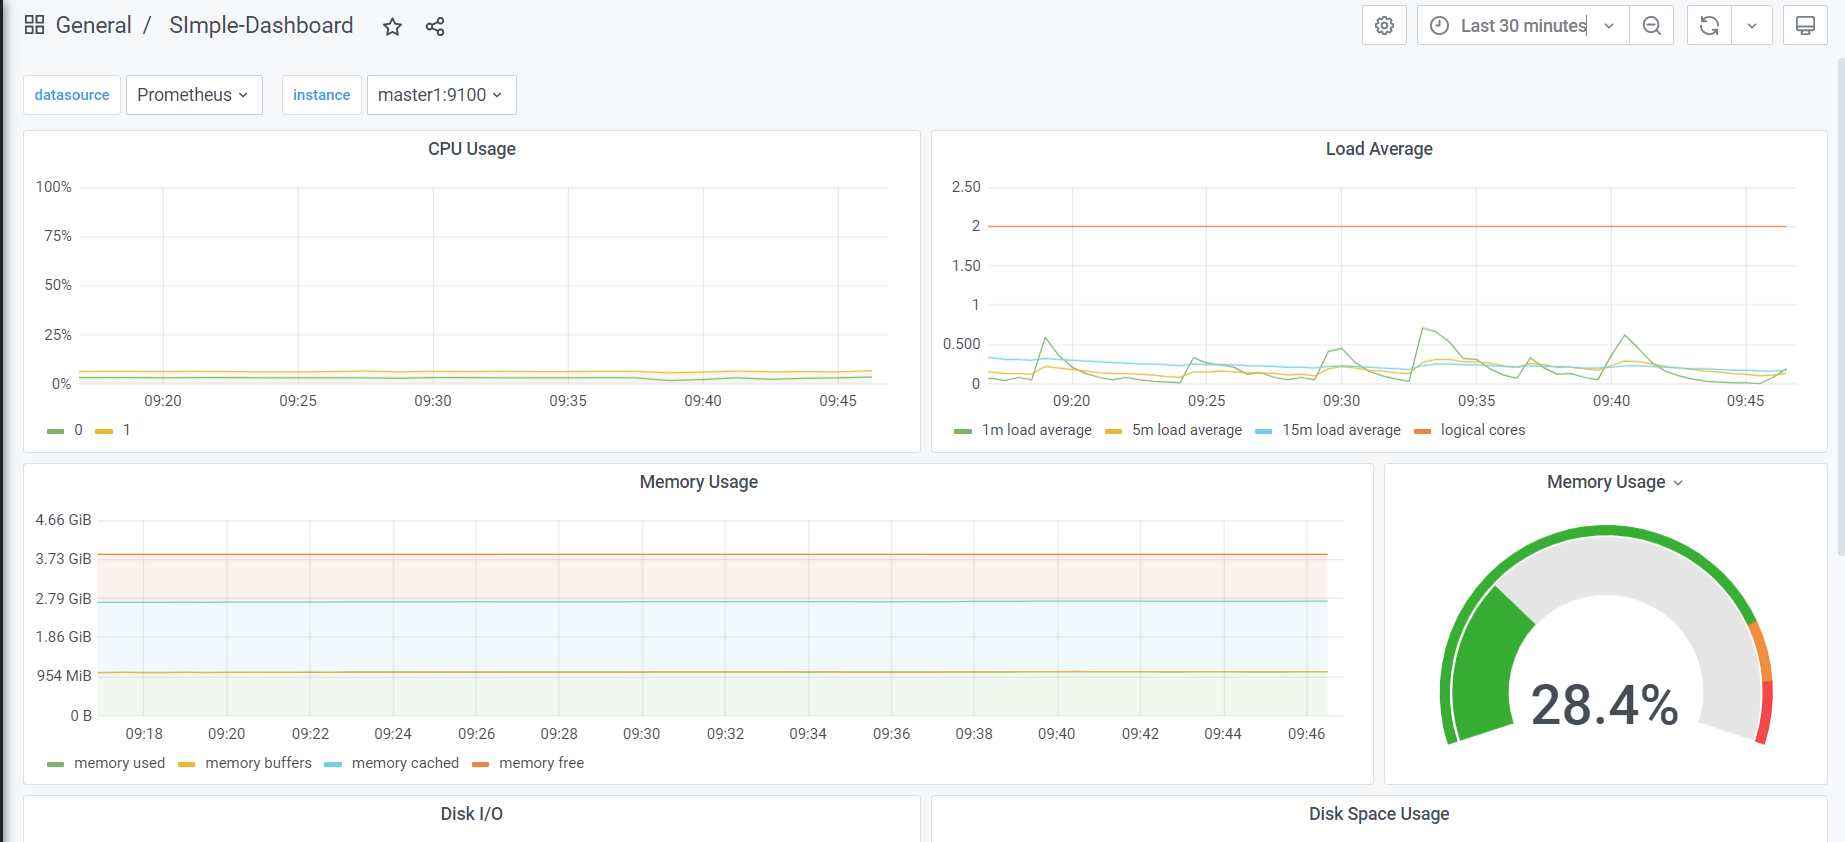
示例:
下载: https://grafana.com/grafana/dashboards/13978 这个dashboard对应的json文件,然后官方文档提示替换所有 job=node的标签为自己对应的标签,其他dashboard要修改的内容可能有所区别,看具体的说明即可
grafana->左侧+图标->Upload JSON file->复制内容->Load->
效果图如下:
更多Grafna用法参考:https://grafana.com/docs/grafana/latest/basics/


 3206
3206


 被折叠的 条评论
为什么被折叠?
被折叠的 条评论
为什么被折叠?
 到【灌水乐园】发言


