


安装native-echarts
npm install native-echarts
修改
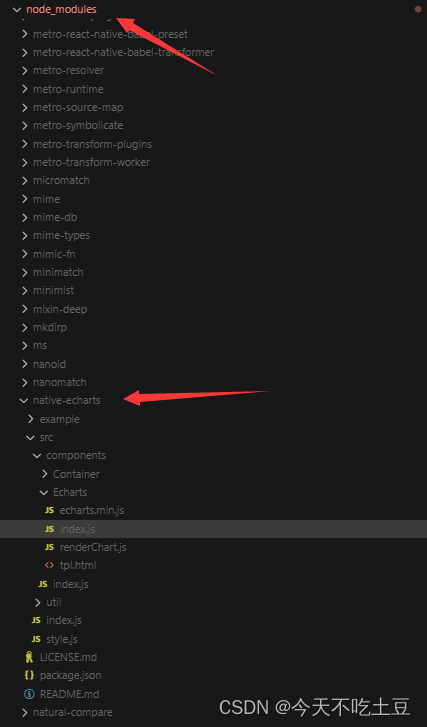
安装好打开node_modules找到native-echarts
安装react-native-webview
npm install react-native-webview
在native-echarts里修改native-echarts/src/components/Echarts/index,把从react-native里引入的WebView删了换成:
import WebView from 'react-native-webview',因为react-native把WebView移出去了现在用第三方包
import React, { Component } from 'react';
import {View, StyleSheet, Platform } from 'react-native';
import renderChart from './renderChart';
import echarts from './echarts.min';
import WebView from 'react-native-webview';

export default class App extends Component {

  constructor(props) {
    super(props);
    this.setNewOption = this.setNewOption.bind(this);
  }


    // 预防过渡渲染
    shouldComponentUpdate(nextProps, nextState) {
      const thisProps = this.props || {}
      nextProps = nextProps || {}
      if (Object.keys(thisProps).length !== Object.keys(nextProps).length) {
        return true
      }
      for (const key in nextProps) {
        if (JSON.stringify(thisProps[key]) != JSON.stringify(nextProps[key])) {
          // console.log('props', key, thisProps[key], nextProps[key])
          return true
        }
      }
      return false
    }

    componentWillReceiveProps(nextProps) {
      if(nextProps.option !== this.props.option) {

     // 解决数据改变时页面闪烁的问题
          this.refs.chart.injectJavaScript(renderChart(nextProps,false))
      }
  }

  setNewOption(option) {
    this.refs.chart.postMessage(JSON.stringify(option));
  }

  render() {
    return (
      <View style={{flex: 1, height: this.props.height || 400,}}>
        <WebView
          ref="chart"
          scrollEnabled = {false}
          injectedJavaScript = {renderChart(this.props)}
          style={{
            height: this.props.height || 400,
            backgroundColor: this.props.backgroundColor || 'transparent'
          }}
          scalesPageToFit={Platform.OS !== 'ios'}
          originWhitelist={['*']}
          source={{uri: 'file:///android_asset/tpl.html'}}
          onMessage={event => this.props.onPress ? this.props.onPress(JSON.parse(event.nativeEvent.data)) : null}
        />
      </View>
    );
  }
}然后把native-echarts/src/components/Echarts/tpl.html,把这个tpl.html复制一份出来,在android/app/src/main,在main文件下创建一个assets文件夹,把刚才的tpl.html复制到assets里面
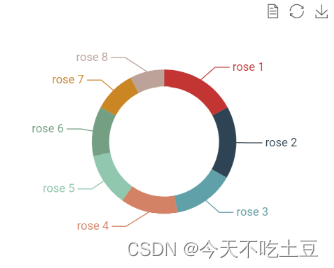
简单使用:
import React from "react";
import { View } from "react-native";
import Echarts from 'native-echarts';

export default ()=> {

  const getEcharts =() => {
      let option = {
          legend: {
            top: 'bottom'
          },
           tooltip: {
            trigger: 'item'
          },
          toolbox: {
            show: true,
            feature: {
              mark: { show: true },
              dataView: { show: true, readOnly: false },
              restore: { show: true },
              saveAsImage: { show: true }
            }
          },
          series: [
            {
              name: 'Nightingale Chart',
              type: 'pie',
              radius: ['38%', '50%'],
               padAngle: 3,
              itemStyle: {
                borderRadius: 1
              },
                emphasis: {
                label: {
                  show: true,
                  fontSize: 40,
                  fontWeight: 'bold'
                }
              },
              labelLine: {
                show: true
              },
              data: [
                { value: 40, name: 'rose 1' },
                { value: 38, name: 'rose 2' },
                { value: 32, name: 'rose 3' },
                { value: 30, name: 'rose 4' },
                { value: 28, name: 'rose 5' },
                { value: 26, name: 'rose 6' },
                { value: 22, name: 'rose 7' },
                { value: 18, name: 'rose 8' }
              ]
            }
          ]
        };

        return option;
   }

  return (
     <View>
          <Echarts option={getEcharts()} height={300} />
     </View>
  )

}注意:之前我用的时候图表没渲染出来,把html给显示在页面上了,解决就是我上面的那个native-echarts/src/components/Echarts/index里的修改,把WebView里的source那个内容换成:
最后保存重新运行一下就ok了,图表显示source={{uri: 'file:///android_asset/tpl.html'}}


 247
247

 被折叠的 条评论
为什么被折叠?
被折叠的 条评论
为什么被折叠?
 到【灌水乐园】发言


